Mirella Borba Santos Ferreira Costa
Front Pages
Wave and tidally induced processes on Rocas Atoll:
geomorphological implications and future projections
Thesis presented to the Oceanographic Institute of the University of São Paulo, in partial fulfilment for the degree of Doctor of Science in Oceanography, with emphasis in Geological Oceanography.
Advisor: Prof. Dr. Eduardo Siegle
ii
University of São Paulo Oceanographic Institute
Wave and tidally induced processes on Rocas Atoll:
geomorphological implications and future projections
Mirella Borba Santos Ferreira Costa
Thesis presented to the Oceanographic Institute of the University of São Paulo, in partial fulfilment for the degree of Doctor of Science in Oceanography, with emphasis in
Geological Oceanography.
Julgada em ___ / ___ / _____
____________________________________________________ Prof. Dr.
____________________________________________________ Prof. Dr.
____________________________________________________ Prof. Dr.
____________________________________________________ Prof. Dr.
iii
Rocas está com a sua evolução quasi terminada. Poucos anos faltarão para se completar, para se tornar uma ilha na verdadeira acepção da palavra.
Como precursores, prevemos a sua futura
de o i ação: Ilha de Ro as , augura do ta é ,
quem sabe ? a sua habitabilidade ? um posto de pesca ? uma base aérea militar ou comercial ? uma estação meteorológica ?
Tudo é possível e um futuro próximo nos dirá.
iv
v
Contents
Acknowledgements ... viii
Resumo ... ix
Abstract ... xi
Publications produced during the PhD Candidature... xiii
List of Figures ... xiv
List of Tables ... xix
1 INTRODUCTION ... 1
1.1 Objectives ... 3
1.2 Study area ... 4
1.3 Thesis layout ... 7
2 WAVE CLIMATE AND EXTREMES ON ROCAS ATOLL ... 8
2.1 Introduction ... 8
2.2 Methods ... 9
2.2.1 Global model ... 10
2.2.2 Local model ... 10
2.2.3 Definition of wave climate and extremes ... 12
2.3 Local model validation ... 13
2.4 Results ... 17
2.4.1 Typical conditions ... 17
2.4.2 Directional wave climatologies ... 19
2.4.3 Seasonality ... 20
2.4.4 Tide and wave climate ... 23
2.4.5 Wave extremes ... 23
2.4.6 Return periods ... 28
2.5 Discussion ... 31
2.5.1 Offshore wave climate ... 31
2.5.2 Lagoon wave climate ... 32
2.5.3 Extreme events ... 34
3 WAVE AND TIDAL FLUSHING ON ROCAS ATOLL ... 36
3.1 Introduction ... 36
3.2 Methods ... 37
vi
3.3 Results ... 38
3.3.1 Tides ... 38
3.3.2 Currents ... 40
3.3.3 Water exchanges through the passes ... 42
3.3.4 Waves, current at larger reef pass, and lagoon water level ... 42
3.4 Discussion ... 45
3.4.1 Atoll morphology and flow pattern ... 45
3.4.2 Drag coefficient at the main reef passage ... 47
3.4.3 Tidal influence on wave pumping ... 48
4 REEF ISLANDS MORPHODYNAMICS ON ROCAS ATOLL ... 51
4.1 Introduction ... 51
4.2 Methods ... 52
4.2.1 In situ wave data ... 53
4.2.2 Morphological surveys ... 53
4.2.3 Historical data ... 55
4.3 Results ... 56
4.3.1 Incident wave spectra ... 56
4.3.2 Reef islands and shingle bank morphology ... 57
4.3.3 Morphological changes ... 60
4.4 Discussion ... 69
4.4.1 Response to incident wave energy ... 69
4.4.2 Morphological adjustment of reef islands ... 71
5 RESPONSE OF WAVE REFRACTION TO SEA LEVEL RISE ON ROCAS ATOLL: IMPLICATIONS FOR REEF ISLANDS MORPHODYNAMICS ... 74
5.1 Introduction ... 74
5.2 Methods ... 75
5.2.1 Topographic and bathymetric surveys ... 75
5.2.2 Numerical wave model... 77
5.3 Results ... 78
5.3.1 Atoll topography... 78
5.3.2 Overall wave refraction ... 81
5.3.3 Wave vectors convergence ... 85
5.4 Discussion ... 88
vii
5.4.2 Sea level rise and wave vectors convergence displacement ... 89
5.4.3 Implications for reef island morphodynamics ... 90
6 CONCLUNDING REMARKS ... 91
6.1 Contribution to future works ... 94
7 REFERENCES ... 96
viii
Acknowledgements
O desenvolvimento desta pesquisa foi possível graças a um conjunto de pessoas que contribuíram de diferentes formas e em diferentes momentos na minha trajetória, mas que foram essenciais na sua elaboração e conclusão. Gostaria de agradecer especialmente a Eduardo Macedo, que esteve sempre presente durante a construção
desta ideia, ua do ‘o as e a ai da u so ho dista te ; por ser o principal incentivador deste projeto, desde o retorno de sua primeira expedição ao atol, contribuindo com importantes sugestões e discussões ao longo de todo o trabalho. Sou muito grata pelo seu apoio, incentivo, paciência e por todos os momentos de descontrações vividos nestes últimos anos.
Ao meu orientador, Eduardo Siegle, gostaria de agradecer por toda a confiança depositada no desenvolvimento deste projeto, todas as sugestões de melhoria, ensinamentos e ótimo convívio. Participar do Laboratório de Dinâmica Costeira foi uma ótima experiência tanto profissional quanto pessoal. Queria estender meus agradecimentos a todos os meus amigos do Instituto Oceanográfico, pelas boas conversas, cafezinhos, ajudas em dúvidas do dia-dia de pesquisa etc. Em especial, agradeço a Ana Amélia, Bruna, Caio, Carol, Dalton, Diana, Filipe, Giba, Hélio, Júlia, Juliana Damasceno, Juliana Ribeiro, Lilian, Mariana, Mirela, Nery, Paulo, Tito. Tenho certeza que vamos continuar em contato por muito tempo.
Gostaria de agradecer muito a Maurizélia Brito, por acreditar nesta pesquisa e apoiar todas nossas expedições. Mais ainda, gostaria de agradecer a ela por todo seu esforço em proteger aquele pequeno, mas importantíssimo ambiente. Nunca achei que fosse conhecer um lugar tão lindo e preservado e sei que a sua história de vida e a história de conservação do atol estão completamente ligadas. Gostaria de agradecer também aos colegas que participaram das expedições: Jarian, Miguel, Natan, Tiago, Gleice e Igor pela ajuda com os levantamentos de campo e pelos mergulhos e passeios no atol. E novamente a Eduardo Macedo, não só pelas aventuras naquele ambiente incrível, mas também pelos vários quilômetros que percorremos com o GPS. Também sou grata à tripulação e comandante do Borandá, Zeca e Ceará, pela ótima companhia durante a navegação até o atol e pela ajuda com o fundeio dos ADCPs externos. Sem dúvida as expedições foram a parte mais esperada desse trabalho. Este trabalho teve o apoio financeiro da Fundação de Apoio a Pesquisa do Estado de São Paulo (FAPESP – 2011/22663-2).
ix
Resumo
Os processos induzidos por ondas e marés em atóis são importantes forçantes da circulação, transporte de sedimentos e troca de água entre a laguna e oceano, que por sua vez, afetam a formação e estabilidade das suas ilhas recifais. Através da combinação de modelos numéricos e experimentos de campo, este trabalho teve por objetivo o estudo dos processos induzidos por ondas e marés no Atol das Rocas e suas implicações na dinâmica de sedimentos das ilhas recifais, considerando os efeitos do aumento do nível do mar. Experimentos de campo forneceram séries temporais de ondas, correntes, mares e informações topo-batimétricas ao longo de três expedições ao Atol das Rocas, totalizando 75 dias de levantamentos. Um modelo numérico de propagação de onda foi implementado e validado para a região.
Os resultados demonstram que o mecanismo de circulação e de propagação de ondas, que afetam as ilhas recifais, é controlado pela interação do clima de onda com a topografia do atol, sendo fortemente modulados pelas flutuações de meso-maré. O clima de ondas ao largo do atol é dominado por vagas formadas pelos ventos alísios de sudeste e por ondulações geradas em latitude médias de ambos os hemisférios. A incidência das ondulações no atol apresenta uma forte sazonalidade enquanto que a vagas de sudeste persistem ao longo do ano. As ondas ao largo são filtradas pela borda do atol, resultando em um clima de ondas na laguna mais homogêneo e controlado pela maré e topografia do atol. Eventos extremos ao largo são ocasionados por ondulações energéticas tanto do hemisfério sul quanto do hemisfério norte. No entanto, os eventos extremos na laguna só ocorrem quando os eventos energéticos ao largo ocorrem em conjunto com maré alta de sizígia.
As vagas que quebram constantemente no lado do atol exposto ao vento são importante forçantes na circulação geral do atol. A partir do processo de quebra, elas são responsáveis por bombear água para a laguna, criando intensas correntes geradas por ondas que fluem do lado exposto para o lado protegido. Este processo, modulado pela maré, resulta em variações periódicas da importância relativa da maré no controle da circulação. Foi também observada a presença de ondas longas dentro da laguna (infragravitacionais) provocada pela quebra do espectro de ondas incidente no recife. Através desses dados, o volume de fluxo de troca de água e o coeficiente de atrito no Barretão foram estimados. O mecanismo descrito para Rocas pode ser aplicado em outros atóis semelhantes sob regime de mesomaré, os quais ainda hoje têm sido pouco estudados.
x
adjacentes. Em escala decadal, a Ilha do Farol apresentou substancial acréscimo em área (59.6% em 75 anos), modificando sua forma alongada para uma forma de ferradura com formação de uma depressão central. Durante esse processo, o lado da ilha voltado para o oceano foi erodido, enquanto que o lado da laguna foi acrescido, caracterizando uma migração da ilha para a laguna. Não foram observadas modificações significativas na ilha do Cemitério, a qual está estabilizada atualmente pela presença de sedimentos consolidados expostos nos dois lados da ilha. Os resultados indicam que as ilhas são feições resilientes, capazes de se ajustar as mudanças nas condições de contornos.
No processo de refração das ondas, devido a sua morfologia, o Atol das Rocas funciona com uma plataforma recifal. Os vetores de ondas convergem no lado protegido e zonas de interferência podem ser observadas no lado exposto e na parte central da laguna. A localização das ilhas e do banco Zulu está relacionada com o padrão de refração, que promovem locais favoráveis à deposição de sedimentos no atol. O aumento do nível do mar promove um deslocamento na posição de convergência das ondas de acordo com o tipo de onda incidente. Isto indica que neste cenário futuro, as áreas deposicionais podem se tornar mais instáveis no atol promovendo o deslocamento das ilhas, mas não necessariamente em uma erosão generalizada.
xi
Abstract
Wave and tides are important drivers of circulation, sediment transport and water exchanges between ocean and lagoon in atolls, which in turn, affect the formation and stability of reef islands. Through a combination of field measurements and numerical modelling, this thesis examines the wave- and tidally-induced processes at Rocas Atoll and their implications on sediment dynamics. This comprehends the morphological responses of reef islands, including the effects of sea level rise. Wave, current, tide and topo-bathymetric data were collected during three expeditions to Rocas Atoll, totaling 75 days of in situ measurements. A spectral wave model has been implemented and validated for the Rocas Atoll.
Our results demonstrated that the mechanism of circulation and the wave propagation that affects the reef islands morphology are controlled by the interaction of wave climate with the atoll topography. Being under mesotidal setting, there is a strongly tide modulated process in Rocas. The offshore wave climate is dominated by southeast trade wind wave and swell from south and north mid-latitude hemispheres. The swell occurrence has a marked seasonality whereas the southeast wind waves persist during the whole year. Offshore waves are filtered by the reef rim resulting in a more homogenous lagoon wave climate, which is controlled by tide and reef topography. Offshore extreme events are promoted by energetic swells, either from north or south hemispheres. However, extreme events in the lagoon only occur when such offshore events are combined with spring high tide.
Wind waves that persistently break on the windward side of the atoll plays an important role on the overall circulation. They pump water into lagoon creating wave- generated currents that flow from the windward to the leeward side of the atoll. A water level threshold exists due to the large tidal oscillation, blocking inflow by wave pumping at lower water levels. This results in periodic variations in the relative importance of tidal controls in lagoon circulation along a tidal cycle interval. Such mechanism described for Rocas Atoll can be extended to other similar mesotidal atolls.
xii
sediments on both shores. Results indicate the resilient nature of reef islands and their potential adjustment to changes in boundary conditions.
In terms of wave refraction, Rocas Atoll works as a platform reef due to its morphology. Wave vectors converge mainly on the leeward side and an interference zone can be observed from the windward side trough the lagoon. Such refraction pattern controls the location of reef islands and shingle bank on Rocas. Sea level rise displaces the wave convergence zone according to the incident wave incidence climate (swell or wind wave). This indicates that under sea level rise scenarios areas prone to sediment accumulation may become less stable, although not implying in the erosion of reef islands.
xiii
Publications produced during the PhD Candidature
Peer-Reviewed:
Costa, MBSF; Araújo, M; Araújo, TCM; Siegle, E. Influence of reef geometry on wave attenuation on a Brazilian coral reef. Geomorphology (in press).
doi:10.1016/j.geomorph.2015.11.001
Costa, MBSF; Macedo, EC, Valle-Levinson, A; Schettini, CAF; Siegle, E. Wave and tidal flushing in a mesotidal near-equatorial atoll. Journal of Geophysical Research (in prep.).
Costa, MBSF and Siegle, E. Wave climate and extremes on a mesotidal atoll lagoon (Rocas Atoll, South Atlantic Ocean) (in prep.).
Costa, MBSF; Macedo, EC; Siegle, E. Reef islands morphodynamics in a near-equatorial shallow lagoon atoll. (in prep.).
Costa, MBSF and Siegle, E Response of wave refraction to sea level rise on Rocas atoll: implications for reef islands morphodynamics. (in prep.).
Conference Presentations:
Costa, MBSF; Araújo, M; Araújo, TCM; Siegle, E. Influence of reef geometry on wave attenuation on a brazilian coral reef. 12th International Coral Reef Symposium. Queensland, Australia. 2012.
Costa, MBSF; Macedo, EC. ; Siegle, E. Morphological response of reef island on Rocas Atoll (South Atlantic Ocean) to seasonal energetic wave conditions. 8th international conference in geomorphology. Paris, França. 2013.
Costa, MBSF; Macedo, EC; Couceiro, MAA; Contti Neto, N; Gagliardi, MH; Siegle, E.. Evolução geomorfológica do pontal arenoso da desembocadura do Rio Preguiças, Lençois Maranhenses, MA, Brasil. XIV Congresso Da Associação Brasileira de Estudos do Quaternário. Rio Grande do Norte, Brasil. 2013.
Costa, MBSF; Araújo, M; Araújo, TCM; Siegle, E. Wave – reef interaction controlling coastal processes: Northeast Brazil. 17th biennial Ocean Sciences Meeting, Hawaii, USA. 2014.
Costa, MBSF; Macedo, EC; Siegle, E. Shoreline changes analysis at Rocas Atoll as a tool to improve spatial planning strategies. 17th biennial Ocean Sciences Meeting, Hawaii, USA. 2014.
Costa, MBSF; Macedo, EC; Schettini, CAF; Siegle, E. Effects of tides and waves on the flushing rate of an atoll lagoon. 17th Physics of Estuaries and Coastal Seas. Porto de Galinhas, Brasil. 2014.
Costa, MBSF. Climatologia e extremo de ondas no Atol das Rocas e em Fernando de Noronha. I Encontro de Pesquisa de Fernando de Noronha, São Pedro e São Paulo e Atol das Rocas: Como integrar a gestão das Unidades de Conservação (UCs) em ilhas oceânicas do Nordeste?
xiv
List of Figures
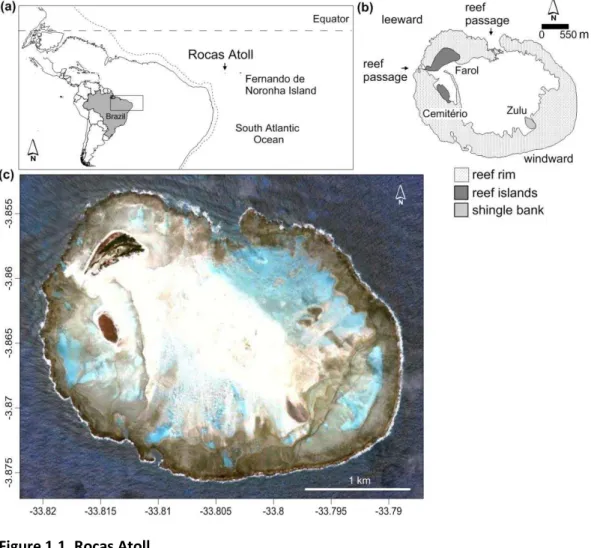
Figure 1.1. Rocas Atoll. ... 6
Figure 1.2. Distribution 304 atolls (a) sizes and (b) their maximum lagoon depths from Pacific, Indian and Atlantic Oceans. Rocas atoll is highlighted by a red dot on the graphs. For comparative purposes, letters on gray dots refers to Rose Atoll (Rs) and Rangiroa Atoll, Tuamotu (Ra) both on Pacific Ocean, Cocos-Keeling Atoll (Cc) and South Maalhosmadulu Atoll, Maldives (Sm) both on Indian Ocean. (c) Histogram showing the size frequency distribution. Database from GSA Data Repository item 2001075 available online at ftp://rock.geosociety.org/pub/reposit/2001/2001075.pdf. ... 7
Figure 2.1. Global framework to obtain offshore and lagoon wave databases. ... 10
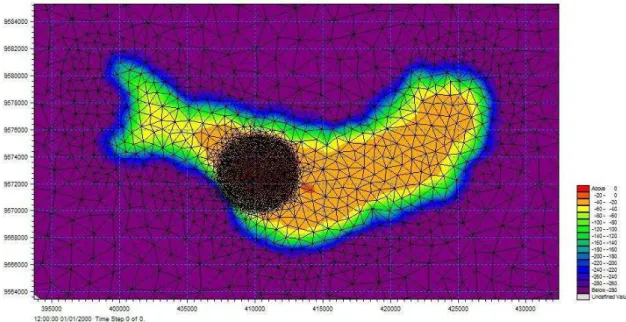
Figure 2.2. Computational mesh resolution of the domain modeled.Computational mesh resolution of the domain modeled. ... 11
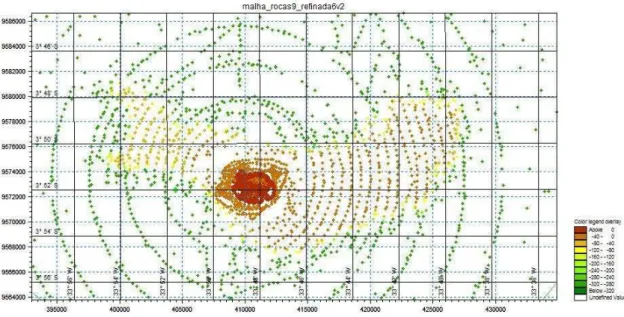
Figure 2.3. Bathymetric resolution used in the domain modeled. ... 12
Figure 2.4. Deployment of the (a) offshore and (b) lagoon ADCPs at Rocas Atoll. ... 14
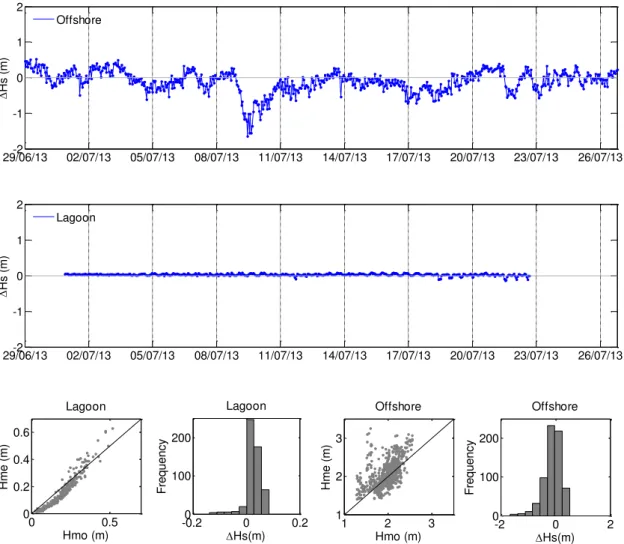
Figure 2.5. Time series of the difference of the modeled (Hmo) and measured (Hme) significant wave height at (a) offshore and (b) lagoon station. Model accuracy statistics: (c,e) histogram of model error and (b,f) scatter diagram of modeled (Hmo) and measured (Hme) significant wave height for offshore and lagoon station. ... 15
Figure 2.6. Time series of the measured (Hme) and modeled (Hmo) significant wave height used for validation at the (a) offshore and (b) lagoon station. ... 16
Figure 2.7. Time series of the difference of the modeled (Hmo) and measured (Hme) significant wave height plot against tide at lagoon station. ... 17
Figure 2.8. Histograms of (a,d) significant wave height, (b,e) peak period and (c,f) peak direction in the Rocas Atoll lagoon and offshore between 1980 and 2014... 18
Figure 2.9. Wave climate at offshore and at lagoon of Rocas Atoll. (a) Directional histogram of significant wave height (m) and (b) directional histogram of the peak period (s) of incident waves. ... 20
Figure 2.10. Monthly directional histograms of the significant offshore wave height (Hs). ... 21
Figure 2.11. Monthly directional histograms of the offshore peak period (Tp). ... 21
Figure 2.12. Monthly directional histograms of the significant lagoon wave height (Hs). ... 22
xv Figure 2.14. (a) Scatter plot of the tide (b) and offshore and lagoon wave and tide height. (c) Example of time series during September 2014 demonstrating the tidal oscillation and offshore and lagoon wave heights. ... 23
Figure 2.15. (a) Scatter plot of combined occurrences of significant wave height (Hs) and peak period (Tp) and (b) histogram of wave power (P) during the 35-year interval. The color scale represents the wave intensity classes. The values above each bar are the rounded percentage of occurrence values. ... 27
Figure 2.16. Directional histogram of wave power (P) for the (a) total dataset and (b) the class
of e t e es o l P ≥ kW/ . ... 27
Figure 2.17. Probability and quantile plots corresponding to the 35-year maximum values fit to the Generalized Extreme Value (GEV) distribution. ... 28
Figure 2.18. Return period of wave extremes estimated using the GEV distribution based on the 35-year time series of Hs, Tp, and P for offshore and Hs, Tp, and P for the lagoon. ... 29
Figure 3.1. The Rocas Atoll. Mooring locations indicated by black squares. ... 38
Figure 3.2. Water level oscillation samples for (a) ocean (station ES2) and lagoon (IL2) during the second leg (July 2013) and for (b) the reef passages (stations IBO3 and IBA3) during the second campaign (December 2013). ... 39
Figure 3.3. Directional histograms of measured flows (m.s-1). ... 41
Figure 3.4. Synchronous water elevation and current vectors at (a) southeast (F1) of the atoll, (b) lagoon (F2) and (c) larger (F3) reef passages during first expedition (July 2013). ... 41
Figure 3.5. Synchronous water elevation and current vectors at the (a) larger (S1) and smaller (S2) reef passages during second expedition (December 2013). ... 41
Figure 3.6. (a) Observed incident significant wave height (m), (b) peak period (s) and (c) wave energy spectra (m2 Hz-1) at offshore (station F1). (d) Instantaneous and tidally filtered currents in the larger reef pass (station F3). (e) Observed incident significant wave height (m) (f), peak period (s) and (g) wave energy spectra (m2 Hz-1) at the lagoon (station F2)... 44
Figure 3.7. (a) Comparison of water level records inside (station IBO2) and outside (station ES2) the lagoon. Note the lower water levels in the lagoon at every first half of rising tides (gray boxes). (b) Histogram of the water level difference between lagoon and ocean. ... 45
Figure 3.8. Water level (a) drag coefficient in the main channel (b) and drag coefficient values frequency distribution. ... 48
xvi Figure 3.10. (a) Water level heights along the reef rim. Distance in meters represents the perimeter of the reef rim (clockwise from A to B). (b) Reef rim during low tides. Note that no water is flowing over the reef rim due to wave breaking at the captured tidal stage. ... 50
Figure 3.11. General flow model of Rocas Atoll along a tidal cycle. ... 50
Figure 4.1. (a) Location of Rocas Atoll. (b) ADCPs positions at first (E1) and second expedition (E2). Example of topographic survey points for the (c) Farol Island, (d) Cemitério Island and (e) Zulu shingle bank during expedition 1. Satellite images from Google Earth. ... 55
Figure 4.2. (a) Time series of wave spectra and (b) mean directional wave energy distribution during first expedition (November 2012). Means of wave energy distribution were calculate for each frequency at each direction. ... 57
Figure 4.3. (a) Time series of wave spectra and (b) mean directional wave energy distribution during second expedition (July 2013). Means of wave energy distribution were calculate for each frequency at each direction. ... 57
Figure 4.4. Digital Elevation Model (DEM) of Farol and Cemitério islets and Zulu shingle bank with examples profiles from the northwest (A) to the southeast (B) and from the southwest (C) to the northeast (D). The numbering 1, 2, 3 and 4 on profile b correspond to NW oceanward ridge, central ridge, central depression and lagoonward ridge, respectively of Farol Island. Conversely, the numbering 5 and 6 on profile c correspond to oceanward ridge and the
lagoonward ridge of Cemitério Island. ... 59
Figure 4.5. (a) Intersection of beach sediments with the reef surface (toe of the beach) of Farol Island. (b) Beachrock on the oceanward beach of Cemitério Island. (c) Consolidated sediments on the lagooward beach of Cemitério Island. (d) Top of Zulu shingle bank during high neap tide. ... 60
Figure 4.6. Digital elevation model (DEM) of Farol Island generated from surveys conducted during first expedition (a) 01/11/2012 (b) 17/11/2012 (c) 29/11/2012 and the second
expedition (d) 06/07/2013 (e) 14/07/2013 (f) 20/07/2013. ... 61
Figure 4.7. Digital elevation model (DEM) of Cemitério Island generated from surveys conducted during first expedition (a) 02/11/2012 (b) 18/11/2012 (c) 30/11/2012 and the second expedition (d) 08/07/2013 (e) 15/07/2013 (f) 21/07/2013. ... 62
Figure 4.8. Digital elevation model (DEM) of Zulu shingle bank generated from surveys
conducted during first expedition (a) 12/11/2012 and the second expedition (b) 07/07/2013 (c) 22/07/2013. ... 62
xvii Figure 4.10. Difference in elevation of (a) Farol and (b) Cemitério reef islands and (c) Zulu shingle bank between two expeditions. Red colors represent loss of sediment whereas blue color represents gaining. Gross volume accretion and gross volume erosion are indicating by positive number and negatives numbers, respectively. Net volume change is indicating by bolds numbers. The date of each survey is showed on Table 4.1. They correspond to an interval of approximately 6 months (between two seasons). ... 65
Figure 4.11. Photographs of Farol Island from (a,b) 1939 and (c,d) 2014. The numberings 1, 2, 3, and 4 correspond to the oceanward ridge, central ridge, central depression, and lagoonward ridge, respectively. ... 67
Figure 4.12. Photographs of Farol Island at different times (from 1939 to 2014), showing the growth of the island towards the lagoon and the erosion of the oceanward beach. The year of each photograph is displayed on the upper right corner. The numberings 1, 2, 3, and 4
correspond to the oceanward ridge, central ridge, central depression, and lagoonward ridge, respectively. ... 68
Figure 4.13. Comparisons between a (a) small reef island on Keeling Island (Pulu Kembang) and (b) Farol Island on Rocas Atoll. Note the difference in orientation of the shallow internal lagoon (termed lagoonlet by Guppy 1889) in respect to the reef edge. The figures are not scaled. ... 73
Figure 5.1. (a) Location of Rocas Atoll. (b) Description of Rocas Atoll. (c) Bathymetric and topographic survey points for the lagoon, reef islands, shingle bank and reef rim. Black dots represent the survey track for the dry parts of atoll using the rover on a backpack kit during low tides. Orange dots represent the survey track for the lagoon and sand apron using the rover coupled to an echosound on a monohull vessel during high tides. ... 76
Figure 5.2. (a) Digital elevation model of Rocas Atoll. (b) Profile section from the leeward side (NW) to the windward side (SE). (c) Profile section of the reef rim perimeter (A to C); letter B correspond to Barretinha passage. Note: the reef boulders and the submerged depressions on the reef rim were not detailed in the survey. ... 79
Figure 5.3. Distribution of wave power P (kW/m) on Rocas Atoll for north southeast wind wave condition (a) SLR=0 and (b) SLR=1; south swell wave condition (c) SLR=0 and (d) SLR=1; and north swell wave condition (e) SLR=0 and (f) SLR=1; Data is present in logarithmic scale to show details of P distribution on shallow waters. Linear values of P are display besides the logarithm scale. Letters on map correspond to Farol islet (F), Cemitério islet (C) and Zulu shingle bank (Z) locations. Wave vectors are not scaled. ... 83
Figure 5.4. Cross-profile of significant wave height (Hs) and peak wave period (Tp) from the leeward to windward over a tidal cycle for the SLR=0 scenario. (a) Northern swell condition, (b) southern swell condition and (c) southeastern wind waves. Vertical lines indicate the reef rim (Rim), Farol Island (F), lagoon (Lagoon) and Zulu shingle bank (Z) limits. ... 84
xviii Figure 5.6. Details of wave vectors at the reef islands location. Letters on map correspond to Farol Island (F), Cemitério Island (C). Letters on map correspond to Farol islet (F), Cemitério islet (C). Wave vectors are not scaled. ... 86
Figure 5.7. Details of wave vectors convergence at the reef islands location. Letters on map correspond to Farol Island (F), Cemitério Island (C). Wave vectors are not scaled. ... 87
xix
List of Tables
Table 2.1. Wave intensity classification based on wave power. ... 13
Table 2.2. Typical and extreme values of significant wave height and peak period for Rocas Atoll. ... 18
Table 2.3. Summary of the maximum annual significant offshore wave heights (Hs) and peak period (Tp), with the associated hemisphere of incidence; and maximum annual offshore peak periods (Tp) and annual significant wave heights (Hs), with the associated hemisphere of incidence. ... 24
Table 2.4. Summary of the maximum annual significant lagoon wave heights (Hs) and peak period (Tp), with the associated hemisphere of incidence; and maximum annual offshore wave peak periods (Tp) and annual significant wave heights (Hs), with the associated hemisphere of incidence. ... 25
Table 2.5. Estimates of wave extremes for the various return periods, based on the 35-year offshore time series for Rocas Atoll. ... 30
Table 2.6. Most energetic wave events recorded at offshore of Rocas Atoll in the last 35 years (1980-2014), using the occurrence of 1% of the total number of events of the classes of
extremes (> 50 kW/m) and considering the peak of each event. ... 30
Table 3.1. Instruments deployment information. Their position is shown in Fig 1. ... 38
Table 3.2. Tidal harmonic constituents based on water level records at open ocean (Station ES2), lagoon (Station IL2) and the larger reef passage (Station IBO2). ... 39
Table 3.3. Mean water flow estimates through the reef passes. ... 42
Ta le . . I st u e ts deplo e t i fo atio . The i st u e ts positio is shown in Figure 4.1. ... 53
Table 4.2. Date of each topographic survey conducted on reef islands and shingle bank of Rocas Atoll. ... 53
Table 4.3. Summary of the topographic characteristics of the reef islands on Rocas Atoll. Estimation of perimeter, area and volume were horizontally limited by the toe of the beach (TOB) and the vegetation line (VL). Volumes estimations were vertically limited by the height of the surrounding reef flat. ... 60
Table 5.1. Summary of offshore dominant wave conditions on Rocas Atoll used to construct the wave propagation scenarios. ... 77
1
Chapter 1
1
INTRODUCTION
Atolls are ring-shaped ocean reefs formed by an internal lagoon and islands of unconsolidated sediments (Barry et al., 2007; Woodroffe et al., 1999). These islands, commonly known as reef islands, are recent geological formations (Holocene), formed by physical processes acting on biogenic sediments (Gourlay, 1988). They mainly consist of carbonate sands and gravels, both originated from and deposited on the reef platforms of the atoll system itself (Kench et al., 2005; Stoddart and Steers, 1977; Yamano et al., 2000).
Although atolls are superficially similar to each other, they significantly differ with regard to the number, size, continuity, and morphology of the reef islands (Barry et al., 2007). They typically have a low elevation (<3 m above the mean sea level), small area, vegetation in the central part, and narrow beaches around the entire perimeter (Kench and Brander, 2006a). The beach sector facing the ocean is typically formed by thicker sediments and with relative stability, except during the incidence of more energetic events. On the side facing the lagoon, the beach consists of finer sediments and shows greater morphological changes in response to processes that occur within the atoll (Sato and Yokoki, 2010).
The formation and stability of reef islands are related to sediment transport inside the atoll, whose main forces are waves and tides (Callaghan et al., 2006; Gourlay, 1988). The relative importance of these variables depends on the topography of the atoll edge and the local wave climate and tidal regimes. When the atoll has wide openings on the edge that are deep compared to the wave height and tidal range, the flow inside will mainly be generated by tides, and the lagoon water level will fluctuate according to their range. Conversely, when the atoll has a nearly uninterrupted edge whose elevation is approximately at the same level as the mean sea level (MSL), the waves might cause a significant flow during the surf process. In this case, the side of incidence of the most energetic waves will experience greater water rise that will overflow into the protected side (Callaghan et al., 2006). Wave-induced currents are key forces in sediment transport from the shallow parts of the reef structure, especially with regard to the sandy fraction (Gourlay, 1988). Its intensity is related to the magnitude of the wave set-up, whose increase is directly proportional to the wave height and period increase at the time of breaking and inversely proportional to the
ate le el o the eef s edge (Nelson and Lesleighter, 1985).
2
wherein, during low tides, waves mostly break on the atoll edge and, during high tides, waves partly manage to propagate into the atoll, dissipating their energy on the plateau and reef-islands (Kench and Brander, 2006b). Several authors show that the interaction between waves and reef structures may result in a wave energy reduction that ranges from 20% to 47% in the reef side and from 50% to 90% in the edge (Costa et al., 2015; Gerritsen, 1980; Kench and Brander, 2006a; Lugo-Fernández et al., 1998a; Roberts, 1980). These studies demonstrate that the leading factors that control the degree of wave attenuation include the geometry of the reef structure (elevation, slope, and width of the top), the relative depth between water level and the reef top, and the characteristics of the incident waves themselves (Costa et al., 2015; Gourlay, 1994; Hardy and Young, 1996). The wave energy that is able to propagate into the atoll plays a key role in activating the geomorphological and sediment transport processes and, therefore, in the formation and morphological changes of sandy islands (Brander et al., 2004; Gourlay, 1988; Kench, 1998a; Roberts et al., 1992).
In addition to short-term morphological changes caused in the time scale of a tide cycle, or in the seasonal scale of the wave climate, long-term changes may occur that result from global climate change (Gourlay, 1988). In particular, the rising sea level and frequency of extreme events are some of the most notable impacts that climate change may have on the sediment dynamics of an atoll (IPCC, 2007; Leatherman and Beller-Simms, 1997; Yamano et al., 2005). Most projections suggest that sea level may increase on the order of 0.5 m to 1.0 m by the year 2100 (Sato and Yokoki, 2010). Factors such as the low topography of reef-islands and the importance of the water level in the physical processes that occur in an atoll contribute to the vulnerability of these environments, based on climate projections for the next century (Woodroffe, 2008). Accordingly, the use of numerical models may contribute to developing future scenarios concerning the sediment dynamics of these oceanic environments (Kench and Cowell, 2000; Sato and Yokoki, 2010; Sheppard et al., 2005; Storlazzi et al., 2011; Yokoki et al., 2006).
3
Several studies about reef geology and sedimentology have been conducted at Rocas Atoll, especially since the establishment of the ICMBio research base (Gherardi and Bosence, 2005, 2001; Kikuchi and Leão, 1997; Pereira et al., 2013, 2010; Soares et al., 2011, 2009a). However, no study has yet attempted to quantify and analyze the wave- and tide-induced processes in the sediment transport and morphology of the reef islands at the Rocas Atoll. Furthermore, studies focusing on the processes controlling the sedimentary dynamics of that environment are relevant, considering the possible impacts of climate change on atolls worldwide.
The methodological strategy of this thesis was based on the hypotheses that waves and tides are the main forcing on the lagoonal processes, including circulation and sediment transport. This is expected due to Rocas Atoll characteristics, particularly the small-size reef rim, shallow lagoon and mesotidal regime. The water depth over the reef rim, in turn, plays an important role in modulating the wave propagation and dissipation. Thereby, rising sea level projected as a consequence of climate changes would increase the water depth over the reef rim, affecting the reef islands morphodynamics. In this work, we first attempt to study the effects of wave and tides on the circulation and sediment transport of Rocas Atoll, and then the resulting effects of sea level rise on the reef islands.
1.1 Objectives
Through a combination of field measurements and numerical modelling, this thesis examines the wave- and tide-induced processes at Rocas Atoll and their implications on sediment dynamics, particularly the morphological responses of reef islands. Future scenarios considering the climate predictions for 2100 are also examined in order to also contribute to the management of this environment.
The following specific objectives are proposed to achieve the overall goal:
- Analysis of offshore and lagoon wave climate and extremes on Rocas Atoll.
- In situ measurements and analysis of the variables controlling sediment dynamics at Rocas Atoll, including the waves, tides, and currents induced by these forces;
- Analysis of the process of tidal modulation of waves and its effect on reef islands daily, seasonal and decadal morphological changes;
4 1.2 Study area
Located 250 km off the northeast Brazilian coast, Rocas Atoll (3.511 S, 33.491W) is the only atoll on the South Atlantic Ocean and the first Brazilian marine protected area (Figure 1.1). Rocas Atoll was designated as a Biological Reserve (Reserva Biológica do Atol da Rocas) in 1979 by the Brazilian Government, a restricted category of marine protection in which research and education are the only allowed activities. The protected area comprises surrounding waters of Rocas Atoll above the depths of 1000 m. In 1993, the first research base was built on Rocas (Woelffel and Alvarez, 2009) and since then Rocas is continually occupied by a team of approximately four people (including researchers and managers) that alternate each month for research and monitoring activities. Access to the Rocas Atoll needs prior approval by the Instituto Chico Mendes de Conservação da Biodiversidade (ICMBio), the Brazilian agency responsible for managing the federal protected areas. ICMBio led the expeditions to Rocas which is made from a sailboat departing from Natal Harbour, 500 km away. There are only about 12 expeditions to Rocas in a year, with around 30 days each.
Rocas is one of the smaller and shallow lagoon atolls in the world (Figure 1.2). The small-sized reef rim has an elliptical shape, a length and width of 3.5 km and 2.5 km, respectively, and a west–east orientation, built by encrusting coralline red algae, vermetid gastropods, and encrusting foraminiferans (Gherardi and Bosence, 2001; Kikuchi and Leão, 1997). The main reef framework builder is the coralline algal genus Porolithon cf. pachydermum which occurs associated with four other coralline algae: Popolithon sp.; Lithophyllum sp.; LithoporelIa sp.; and Sporolithon sp. (Gherardi and Bosence, 1999). Corals are located in pools of water that remain deep enough over a tidal cycle (Ferreira et al., 2012) and there is no evidence of the their joint activity with coralline algae as constructors of the reef (Gherardi and Bosence, 2001). The dominant genus is the head coral Siderastrea (Gherardi, 1995). An 11.6 m long drill core on the western part of the reef, with the recovery rate of 40% shows that the reef growth began before 4.8 ky BP with the accretion rate varying from 1.5 to 3.2 m/ky (Kikuchi and Leão, 1997). Subaerialy exposed old reef spits, elevated above tidal range, and a beachrock cliff are evidences of an equal to or higher than present sea level in Rocas, earlier in the Holocene (Kikuchi and Leão, 1997).
5
molluscs (10% - 13%) (Soares et al., 2009b). Coral and other components comprising subordinate fractions (<10%) (Soares et al., 2009b). The reef islands are composed predominantly by coarse sand, the shingle bank by gravel and the sand apron by medium sand (Pereira et al., 2013). The vegetation of the islands is mostly herbaceous, and consists chiefly of Portulaca oleracea (Portulacaceae), Cyperus ligularis (Cyperaceae) and Iresine portulacoides (Amaranthaceae). On Cemitério Island the vegetation is composed almost exclusively of C. ligularis (Hazin and Macedo, 2006).
Despite the small size of the reef islands, they contain an abundant fauna of visiting or nesting birds. The islands shelter the largest breeding colonies of masked booby Sula dactylatra and brown noddy Anous stolidus in Brazil and of sooty tern Sterna fuscata for the South Atlantic (Schulz-Neto, 2004). It is also the second largest Chelonia mydas rookery in Brazil (Bellini et al., 1996) and an important place for the protection of a endemic specie of land crab (Johngarthia lagostoma) which only occurs on three other South Atlantic islands (Trindade, Fernando de Noronha and Ascension) (Godley et al., 2009).
The lagoon is a nearly closed water body connected to the open ocean through two passages in the north and northwest margins on the leeward side. At low tides the lagoon becomes partially dry exposing a large sand apron. Maximum depth is of about 7 m during high spring tides. The north passage (larger passage; locally named Barretão) is permanently connected to the shallow lagoon, has a mean depth of 5 m and is 330 m wide. The northwest passage (smaller passage; locally named Barretinha) is located between the two reef islands and is disconnected from the lagoon by an exposed sand bank during low tides. It has a mean depth of 3 m and a width of 30 m.
To date, there are no long-term tidal time series for the Rocas atoll, however, tide charts provided by the Brazilian Navy for the nearby island of Fernando de Noronha, 145 km to the east, show a semi-diurnal regime with an ocean tidal range of 2.8 m during spring tides and 1.7 m during neap tides. The tidal range ensures that the whole reef rim is exposed and at low tides it is 2 m above the ocean sea level on the windward side. The atoll is dominated by the southeast trade winds, which prevail for 93% of the year (BDC, 2015), varying in strength according to the Intertropical Convergence Zone (ITCZ) seasonality (McGregor and Nieuwolt, 1998). Average wind speed is approximately 5 m.s-1 with maximum speed around 11 m.s-1 (BDC, 2015). As a result, wind waves generated by these local winds dominate the wave field at Rocas and break on the windward reef crest most of the year (Chapter 2). Due to its location near the equator, North and South swells also contribute to the wave conditions at Rocas, and they are generated during both hemisphere winters (Chapter 2).
6
(Richardson and Walsh, 1986). Monthly mean sea surface temperature varies from 26 °C in September to 28.3 °C in April, with peak annual temperatures in March–April– May (Ferreira et al., 2012). Month average rainfall varies between 6 mm (October) and 132 mm (April), with annual average of 700 mm (BDC, 2015).
7
Figure 1.2. Distribution 304 atolls (a) sizes and (b) their maximum lagoon depths from Pacific, Indian and Atlantic Oceans. Rocas atoll is highlighted by a red dot on the graphs. For comparative purposes, letters on gray dots refers to Rose Atoll (Rs) and Rangiroa Atoll, Tuamotu (Ra) both on Pacific Ocean, Cocos-Keeling Atoll (Cc) and South Maalhosmadulu Atoll, Maldives (Sm) both on Indian Ocean. (c) Histogram showing the size frequency distribution. Database from GSA Data Repository item 2001075 available online at
ftp://rock.geosociety.org/pub/reposit/2001/2001075.pdf.
1.3 Thesis layout
8
Chapter 2
2
WAVE CLIMATE AND EXTREMES ON ROCAS ATOLL
2.1 Introduction
Geomorphic and ecological processes on atolls and coral reef lagoons are closely linked to local wave and tide climates (Woodroffe and Biribo, 2011). As open-ocean waves approach a reef and breaks they generates a rise in the dynamic sea level relative to the offshore mean sea level initiating water transport across the rim towards the lagoon (Atkinson et al., 1981; Kraines et al., 1999; Lowe and Falter, 2015; Tartinville et al., 1997). The directions of these wave-induced currents will depend on the swell and wind wave direction. The side facing the largest waves will have large amounts of water pushed over the reef rim while water will drain to the ocean on the leeward side, and this process is modulated by tides (Callaghan et al., 2006).
The combination of tide and wave-driven flows through the rim are critical for ecological functioning of reef systems such as renewal of water and oxygen and their uptake by corals (Hearn et al., 2001; Jokiel, 1978; Nakamori et al., 1992), removal of metabolic wastes and flushing of reef lagoons (Dumas et al., 2012; Frith and Mason, 1986; Kench, 1998a) and, the dispersal and recruitment of larvae (Abelson and Denny, 1997; Black, 1993; Hamner and Wolanski, 1988)
However, depending on the local tidal setting, not all wave energy will be dissipated at the reef edge at high tide (Kench et al., 2006). Instead, waves may propagate onto the reef surface either as transformed incident waves, reformed waves, or wave bores (Lugo-Fernández et al., 1998a; Nelson, 1996). The wave energy that leaks onto coral reef surfaces is of critical importance in activating the geomorphic processes of sediment transport and governing reef island construction and morphological change (Brander et al., 2004; Gourlay, 1988; Kench, 1998b; Roberts et al., 1992).
9
Downscaling is the method to obtain wave climate information at high spatial resolution from relatively coarse resolution (Camus et al., 2011). The implementation of high-resolution wave models can be used to downscale the historical wave climate from hindcast models and reconstruct the spatial wave fields in shallow water, where depth variations and local bathymetry are important variables for wave transformation.
Specifically in atolls, the characteristics of waves that propagate into the lagoon may be very different from the conditions observed offshore due to wave transformation and interaction with the reef. The tide plays a key role in this process, controlling the water level above the reef and modulating the amount of energy that can be transmitted by the atoll rim. Thus, the definition of extreme conditions inside the lagoon may be directly related not only to the extreme conditions of offshore waves but also, and especially, to the joint occurrence with spring tides.
Through the reconstruction of lagoon long-term time series by downscaling offshore historical wave climate, this study aims to assess the wave climate and wave extremes analysis on a mesotidal atoll lagoon (Rocas Atoll); this step involves the implementation and validation of a high-resolution numerical wave model. Moreover, this study addresses the joint recurrence of energetic wave conditions and high tides and the implications of the differences on the offshore and lagoon wave climates to geomorphological process inside the atoll.
2.2 Methods
10
Figure 2.1. Global framework to obtain offshore and lagoon wave databases.
2.2.1 Global model
The wave climate analysis of Rocas Atoll was performed using data from the global wave generation model WAVEWATCH III (NWW3) version 2.2, developed by the National Oceanic and Atmospheric Administration/National Centers for Environmental Prediction (NOAA/NCEP; Tolman 2002), which uses the wind fields produced by the global atmospheric model Global Forecast System (GFS) as forcings. The model solves the wave action spectral density conservation equation to generate global domain spectral and wave characteristics data. The data are available at 3 h intervals with 0.5-degree spatial resolution, except in regions at latitudes above 78°, where the surface becomes predominantly solid in both hemispheres (ice or continent). The Climate Forecast System Reanalysis and Reforecast (CFSRR) dataset (Springs et al., 2010), whose period extends from 1979 to 2009, generating a total of 35 years (from 1979 to 2014) of data collected for the grid nearest the Rocas Atoll, and the historical dataset from 2005 to 2014 were used to enable greater temporal coverage.
2.2.2 Local model
11
energy by shoaling, refraction, diffraction, and dissipation by both depth-induced wave breaking and bottom friction. Wind forcing can be included in the model, but it has been ignored in the present work. The domain and the governing equations are discretized using the finite volume method. The model is quasi-stationary using a Runge-Kutta iterative procedure to compute the stationary wave field at each time step. A detailed description of the model can be found in Sørensen et al. (2004).
A o sta t eake oeffi ie t γ = . as used to pa a ete ize the a e eaki g -induced dissipation. The gamma value controls the wave steepness conditions, wherein a threshold ratio is reached before the break, considering the local depth. Its formulation is reported in (Battjes and Janssen, 1978). Wave dissipation due to bottom friction was based on the formulation by (Madsen et al., 1988), using a constant Nikuradse bed roughness length of Kn = 0.04 m. This value is equivalent to a friction factors (fw) of 0.1 for smooth healthy coral reefs (Sheppard et al., 2005). The friction coefficient was held constant over the entire domain, but in practice, friction is only a significant factor for shallower reef flat regions (Baldock et al., 2014).
An unstructured mesh containing 6953 triangular elements was prepared with 3 different resolutions to solve the differences in the bathymetric scale along the model domain (Figure 2.2). A fine grid with approximately 60 m spatial resolution was defined inside connected to the lower offshore resolution of approximately 1.5 km by an intermediate resolution grid with cells of approximately 600 m. The long-term time series from the global model NWW3 was applied to the lateral wave boundary of the outer grid; thus, wave transformations over the submerged mountain of which Rocas Atoll is located could be estimated before being passed to the finer portion of the grid.
12
To represent the complex topography of the atoll used at the finer grid, topographic and bathymetric surveys were conducted using a Trimble dual-frequency kinematic Global Position System (GPS) coupled with a Garmin echosounder and installed in a monohull vessel. The measurements were done along equally spaced profiles (100 m) across the lagoon. At dry section of the atoll, such as the reef rim and the reef islands, surveys were conducted by foot during low tides using the rover GPS unit mounted in a backpack kit. The data were tidally corrected and processed by a post-kinematic technic using the TBC software. Details on the acquisition of the topography and bathymetry can be found in Chapter 5. The bathymetry used in the intermediate and coarse grid (offshore waters) was gathered from Brazilian Navy nautical charts 5101 and 5102 (Figure 2.3). The datum of both sources (in situ survey and nautical charts) was adjusted to the Rocas Atoll hydrographic zero.
Figure 2.3. Bathymetric resolution used in the domain modeled.
The tidal variation time series for the analysis period (from 1979 to 2014) was used as the model input to reconstruct the wave climate inside the lagoon. This time series was reproduced using the tidal harmonic constants extracted from in situ data on the sea level variation collected at Fernando de Noronha Archipelago, encompassing 611 sampling days with 60 min intervals, totaling 14,664 heights recorded. Those data were provided by the National Bank of Oceanographic Data of the Brazilian Navy (Banco Nacional de Dados Oceanográficos da Marinha do Brasil).
2.2.3 Definition of wave climate and extremes
The lagoon and offshore wave climate of Rocas Atoll was defined by analyzing the seasonality and extremes events based on the time series from 1980 to 2014. Directional wave climatologies were constructed by discretizing wave parameters Hs
13
correspond to the 8 wave direction octants (N, NE, E, SE, S, SW, W, NW). These binned values were then analyzed for the most frequent occurrences of Hs and Tp (typical conditions) and the 99th percentiles (maximum condition). This method allows for an examination of how often (in a year or season) a particular wave direction/frequency event tends to occur and its average magnitude (Hoeke et al., 2011).
Considering that the greatest heights are not necessarily associated with the longest annual periods and that the combination of both high values corresponds to the highest wave energy events, the wave force was calculated to classify the swell intensity and characterize extreme events. The wave force (P, expressed as kW/m) correlates Hs and Tp through the product between group velocity (Cg) and wave
energy (E), resulting in the following equation:
=
�2�2� (1)he e ρ is the ate de sit kg/ 3) and g is the acceleration due to gravity.
High values of both parameters (Hs and Tp) are associated with energetic events capable of causing significant changes in sediment morphology. This equation is used to define the swell intensity classes incidents at Rocas Atoll according to the intervals listed in Table 2.1.
Table 2.1. Wave intensity classification based on wave power.
Intensity Wave Power (kW/m)
Extreme P ≥
Severe > P ≥
Strong > P ≥
Moderate > P ≥
Weak > P ≥
Calm P < 10
2.3 Local model validation
14
assess the quality of the model regarding the wave transformation through the edge of the atoll and the tidal effect on this process.
Figure 2.4. Deployment of the (a) offshore and (b) lagoon ADCPs at Rocas Atoll.
The calibration process included variations in the parameters described in the previous section (e.g., mesh resolution, wave breaking parameter, bottom friction) to find the best relationship between computational effort demand and agreement with the in situ data. The difference between the modeled significant wave height (Hmo) and the measured significant wave height (Hme), mean difference (bias), root-mean-square error (RSME), and correlation coefficient (cc) for ADCP match points were used to verify the performance of the model.
H H
H mo me
1
N i H N bias 1 1 2
N i H N RMSE 1 2 1 3
N i N i mo mo me me N i mo mo me me H H H H H H H H cc 1 1 2 2 1 415
The comparison between the measure and modeled time series is show in Figure 2.6. The process of tidal modulation of waves inside the lagoon is observed, with greater heights at high tide and smaller heights at low tide, and this process is well resolved by the model. Figure 2.5 and Figure 2.6 draw attention to a specific event that was not reproduced by the model in the offshore station using NWW3 data as the input, generating a 1.65 m difference between the modeled and measured waves. However, this event had no effect on the quality of the wave height modeled in the lagoon because this difference was only -0.002 m. Thus, short variations in offshore wave height are not significant in relation to the expected wave height inside the lagoon, considering that the tide is the main factor controlling the energy level of the incident wave to be propagated into the atoll, which explains why the model reproduced the wave characteristics inside the lagoon more accurately.
Figure 2.5. Time series of the difference of the modeled (Hmo) and measured (Hme) significant wave height at (a) offshore and (b) lagoon station. Model accuracy statistics: (c,e) histogram of model error and (b,f) scatter diagram of modeled (Hmo) and measured (Hme) significant wave height for offshore and lagoon station.
29/06/13-2 02/07/13 05/07/13 08/07/13 11/07/13 14/07/13 17/07/13 20/07/13 23/07/13 26/07/13 -1 0 1 2 H s (m ) Offshore
29/06/13-2 02/07/13 05/07/13 08/07/13 11/07/13 14/07/13 17/07/13 20/07/13 23/07/13 26/07/13 -1 0 1 2 H s (m ) Lagoon 0 0.5 0 0.2 0.4 0.6 Hmo (m) H m e ( m ) Lagoon
-0.20 0 0.2
100 200 Hs(m) F re q u e n cy Lagoon
1 2 3
1 2 3 Hmo (m) H m e ( m ) Offshore
-2 0 2
16
Figure 2.6. Time series of the measured (Hme) and modeled (Hmo) significant wave height used for validation at the (a) offshore and (b) lagoon station.
A more detailed analysis of the time error in the lagoon indicates that the main differences between the measured and modeled data occurred as a result of the relationship between the level of energy dissipation and depth (Figure 2.7). Changing the friction parameter of the model is only possible by varying the field and keeping it constant in time. However, the greatest errors occurred at high tide, and the attenuation of modeled data should be greater during neap tide and smaller during spring tide. This finding agrees with the dynamic change of bottom friction due to the changing water level and tidal currents suggested by Arora & Bhaskaran (2012) for tidal dominated regions. The general trend is that the friction coefficient has higher values during less energetic neap tides and lower values during more energetic spring tides (Jarosz et al., 2005). Furthermore, when the mean tidal velocity has higher energy, e.g., during spring tides, the roughness length is lower, and during neap tides, when tidal energies are reduced, the roughness length increases. They address a new resistance law for bottom friction under the combined action of waves and currents that takes into account varying water levels, the reversal of the current system, and associated shear on the seabed. This formulation may improve the accuracy of the model for the region. However, the data modeled for the lagoon are highly satisfactory for the purpose of the present study.
29/06/13 02/07/13 05/07/13 08/07/13 11/07/13 14/07/13 17/07/13 20/07/13 23/07/13 26/07/13 0,5 1 1,5 2 2,5 Offshore H s (m ) Hmo Hme
17
Figure 2.7. Time series of the difference of the modeled (Hmo) and measured (Hme) significant wave height plot against tide at lagoon station.
2.4 Results
After implementing and validating the model, the wave climate series inside the lagoon was reconstructed. The results shown below correspond to the analysis of 2 data series of 35 years each, including 1 series directly extracted from the global model NWW3 that represents the offshore wave climate and another series reconstructed using the local model MIKE 21 SW that represents the lagoon wave climate. The first data year was extracted from both time series because it has spurious values. The offshore series had a total of 102,271 data points for each characteristic, with a 3 h interval, whereas the lagoon series had a total of 306,813 data points for each characteristic, considering that the output interval of the global model was 1 h.
2.4.1 Typical conditions
The typical and extreme conditions are shown using classes of wave occurrence values and plotting the results in 2-dimensional histograms (Figure 2.8). In addition, Table 2.2 outlines the percentage values of the class that represents the mode of the Tp and Hs distribution, which is used to characterize the typical pattern, and the values that occur above the 99% percentile, which are used to characterize the extreme values.
29/06/13 02/07/13 05/07/13 08/07/13 11/07/13 14/07/13 17/07/13 20/07/13 23/07/13 26/07/13
-0.2 -0.1 0 0.1 0.2
H
s
(m
)
-1 0 1 2 3
T
id
e
(
m
18
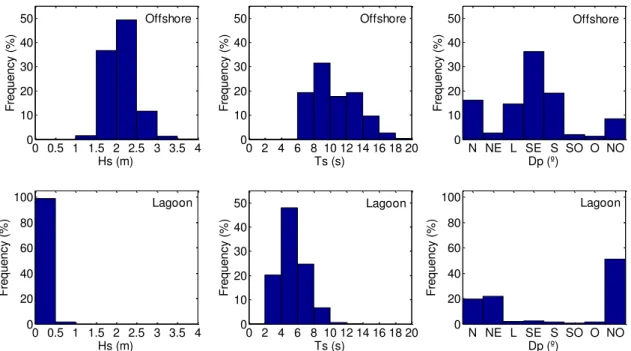
Figure 2.8. Histograms of (a,d) significant wave height, (b,e) peak period and (c,f) peak direction in the Rocas Atoll lagoon and offshore between 1980 and 2014.
Table 2.2. Typical and extreme values of significant wave height and peak period for Rocas Atoll.
Significant wave height Peak wave period Pattern Class Range (m) Percentual (%) Range (s) Percentual (%)
Offshore
Typical Modal class 2,0 – 2,5 49,2 8,0 – 10,0 31,4
Extreme Percentil 99% 3,04 – 3,93 1 17,24 – 21,79 1
Lagoon
Typical Modal class 0,0 – 0,5 98,6 4,0 – 6,0 47,9
Extreme Percentil 99% 0,52 – 0,81 1 9,72 – 13,32 1
The significant offshore wave heights ranged from 1.09 m to 3.93 m, averaging 2.12 m. Significant wave heights between 2.0 m and 2.5 m were predominant, at 49.2% frequency of occurrence, followed by heights between 1.5 m and 2.0 m, at a frequency of 36.6%. Peak periods had a distribution between 5.20 s and 21.79 s, with a mean of 10.54 s. Periods between 8 s and 10 s occurred in 31.4% of all records and between 6 s and 8 s in 19.3%. Most waves came from the SE (36.1%), followed by the S and N octants, with 19.0% and 16.1% each, respectively, and by the E and NW octants, with 14.4% and 8.5%, respectively. The remaining octants had a frequency of lower than 3% of all occurrences (Figure 2.8). For the extreme pattern, the 99% percentile covered an Hs range between 3.04 m and 3.93 m and a Tp range from 17.24 s to 21.79 s (Table 2.1).
The significant lagoon wave heights ranged from 0.01 m to 0.81 m, averaging 0.16 m. Significant heights between 0 m and 0.5 m corresponded to 98.6% of the occurrences
0 0.5 1 1.5 2 2.5 3 3.5 4 0 10 20 30 40 50 Hs (m) F re q u e n cy (% ) Offshore
0 2 4 6 8 10 12 14 16 18 20 0 10 20 30 40 50 Ts (s) F re q u e n cy (% ) Offshore
N NE L SE S SO O NO 0 10 20 30 40 50 Dp (º) F re q u e n cy (% ) Offshore
0 0.5 1 1.5 2 2.5 3 3.5 4 0 20 40 60 80 100 Hs (m) F re q u e n cy (% ) Lagoon
0 2 4 6 8 10 12 14 16 18 20 0 10 20 30 40 50 Ts (s) F re q u e n cy (% ) Lagoon
19
in the lagoon, followed by 1.3% for the class between 0.5 and 1.0 m. Peak periods had a distribution between 1.81 s and 13.32 s, with a mean of 5.37 s. Periods between 4 s and 6 s occurred in 47.9% of all records and between 6 s and 8 s in 24.7%. Most waves came from the NW (51.2%), followed by the NE and N octants, with 21.6% and 19.8% each, respectively. The other octants had a frequency of lower than 3% of all occurrences (Figure 2.8). For the extreme pattern in the lagoon, the 99% percentile covered an Hs range between 0.52 m and 0.81 m and a Tp range from 9.72 s to 13.32 s (Table 2.2).
2.4.2 Directional wave climatologies
Figure 2.9 shows the directional histograms of the joint distribution of Hs and Tp by directional sector (Dp). The typical offshore SE direction is associated with an Hs and Tp ranging from 2.0 m to 2.5 m (51.7%) and from 8 s to 10 s (21.9%), respectively. In this directional sector, the extreme values range from 3.12 m to 3.86 m (1%) and from 12.59 s to 18.02 s (1%). The S, N, and NW directions are typically associated with waves with longer periods, ranging from 12 s to 14 s (39.8%, 34.3%, and 48.2%, respectively), with heights ranging from 2.0 m to 2.5 m (50.4%, 49.2%, and 46.1%, respectively). The extreme values range from 3.09 m to 3.66 m (1%) and 17.65 s to 20.72 s (1%) for the S sector, from 2.85 m to 3.93 m (1%) and 17.65 s to 21.23 s (1%) for the N sector, and from 2.84 m to 3.50 m (1%) and 17.68 s to 21.79 s (1%) for the NW sector. The E quadrant is associated with waves with shorter periods, ranging from 6 s to 8 s (56.5%), typical Hs from 1.5 m to 2.0 m (47.2%), and extreme values ranging from 2.74 m to 3.14 m (1%) and 11.29 s to 14.39 s (1%).
Throughout the period of analysis, the N, NW, and NE waves with periods longer than 12 s had 23.59% of occurrence, whereas the S, SW, and SE waves with periods longer than 12 s had 23.95%. The remainder (52.46%) consisted of waves with periods shorter than 12 s of various directions, but mainly SE and E.
20
Figure 2.9. Wave climate at offshore and at lagoon of Rocas Atoll. (a) Directional histogram of significant wave height (m) and (b) directional histogram of the peak period (s) of incident waves.
2.4.3 Seasonality
Figure 2.10 and Figure 2.11 show the monthly offshore wave climate characteristics, highlighting the seasonality of incident wave fields at Rocas Atoll. The waves from the SE quadrant are present throughout the year, reaching the atoll with greater intensity between July and October. Rocas Atoll experiences the effect of waves from the N and NW quadrant during the period from October to April, and February is the month with the strongest effect in the percentage of total occurrence of waves derived from this sector. Conversely, the waves coming from the S are prominent in May, June, July, August, and September, despite occurring at a low frequency in the other months. April is the transition between the N, NW, and S wave fields, displaying the most heterogeneous wave incidence conditions.
In the lagoon, the wave climate is very homogeneous throughout the year (Figure 2.12 and Figure 2.13). The NW direction is predominant throughout the year, and variation is only observed in the frequency of SE waves, which become more significant from May to November, with the increase in the number of offshore waves from the SE.
21
Figure 2.10. Monthly directional histograms of the significant offshore wave height (Hs).
22
Figure 2.12. Monthly directional histograms of the significant lagoon wave height (Hs).
23 2.4.4 Tide and wave climate
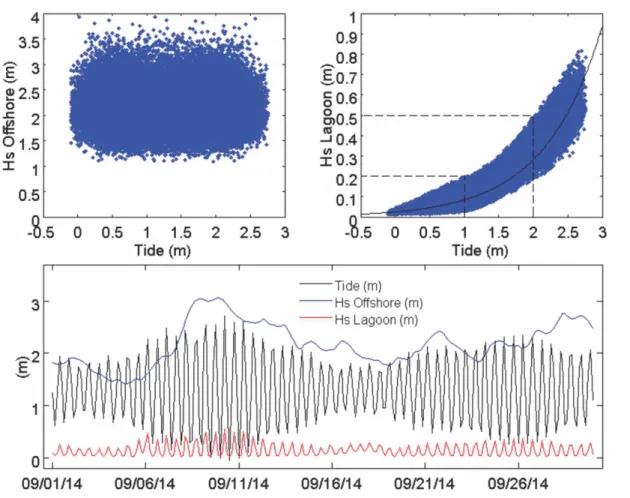
As showed above using in situ data, the tide has a strong effect on the lagoon wave height (Figure 2.6). The scatter plots show this relationship based on the 35 years of modeled data (Figure 2.14). The offshore wave conditions have no significant relationship with the tide (p = 0.6775). However, the variation in lagoon wave height is positively related to the tide (p < 0.05, R2 = 0.87), with maximum height limits well defined according to the water level. The waves have a small Hs range (from 0 m to 0.20 m) at low tide (from 0 m to 1 m). The range increases to 0.5 m at intermediary (from 1 m to 2 m) and high (higher than 2 m) tides, and no waves higher than 0.5 m are found at intermediary tide or shorter than 0.2 m at high tide.
Figure 2.14. (a) Scatter plot of the tide (b) and offshore and lagoon wave and tide height. (c) Example of time series during September 2014 demonstrating the tidal oscillation and offshore and lagoon wave heights.
2.4.5 Wave extremes
24
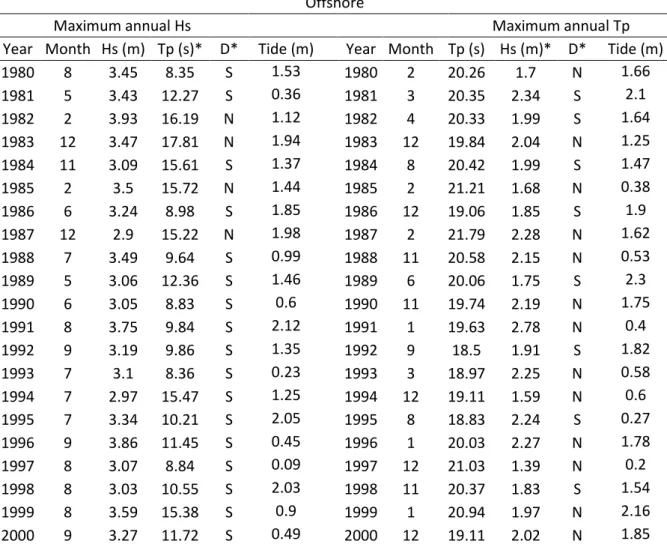
directions) are associated with higher peak period values (mean of 16.3 s) that may represent more energetic conditions. These events from the Northern Hemisphere stand out as annual maxima, occurring only 5 times in 35 years and mostly in the 1980s. In turn, the occurrence of peak period annual maxima has a more homogeneous distribution in relation to the hemisphere of origin, although most are from the Northern Hemisphere (57% of occurrences). They occur predominantly in December. The heights associated with the maximum periods do not exceed 3 m, with a mean of 2 m. The random tide values associated with the annual maxima are observed, highlighting the lack of relationship between the two variables.
The maximum annual lagoon wave heights occurred concurrently with the spring high tides. This finding was expected because higher waves may only propagate into the lagoon during high tides, demonstrating the tidal dependence of extreme wave conditions inside the atoll. The annual maxima of both Hs and Tp were preferentially northerly. However, nearly half the annual maxima of Hs (45%) were southerly.
Table 2.3. Summary of the maximum annual significant offshore wave heights (Hs) and peak period (Tp), with the associated hemisphere of incidence; and maximum annual offshore peak periods (Tp) and annual significant wave heights (Hs), with the associated hemisphere of incidence.
Offshore
Maximum annual Hs Maximum annual Tp
Year Month Hs (m) Tp (s)* D* Tide (m) Year Month Tp (s) Hs (m)* D* Tide (m)
1980 8 3.45 8.35 S 1.53 1980 2 20.26 1.7 N 1.66
1981 5 3.43 12.27 S 0.36 1981 3 20.35 2.34 S 2.1
1982 2 3.93 16.19 N 1.12 1982 4 20.33 1.99 S 1.64
1983 12 3.47 17.81 N 1.94 1983 12 19.84 2.04 N 1.25
1984 11 3.09 15.61 S 1.37 1984 8 20.42 1.99 S 1.47
1985 2 3.5 15.72 N 1.44 1985 2 21.21 1.68 N 0.38
1986 6 3.24 8.98 S 1.85 1986 12 19.06 1.85 S 1.9
1987 12 2.9 15.22 N 1.98 1987 2 21.79 2.28 N 1.62
1988 7 3.49 9.64 S 0.99 1988 11 20.58 2.15 N 0.53
1989 5 3.06 12.36 S 1.46 1989 6 20.06 1.75 S 2.3
1990 6 3.05 8.83 S 0.6 1990 11 19.74 2.19 N 1.75
1991 8 3.75 9.84 S 2.12 1991 1 19.63 2.78 N 0.4
1992 9 3.19 9.86 S 1.35 1992 9 18.5 1.91 S 1.82
1993 7 3.1 8.36 S 0.23 1993 3 18.97 2.25 N 0.58
1994 7 2.97 15.47 S 1.25 1994 12 19.11 1.59 N 0.6
1995 7 3.34 10.21 S 2.05 1995 8 18.83 2.24 S 0.27
1996 9 3.86 11.45 S 0.45 1996 1 20.03 2.27 N 1.78
1997 8 3.07 8.84 S 0.09 1997 12 21.03 1.39 N 0.2
1998 8 3.03 10.55 S 2.03 1998 11 20.37 1.83 S 1.54
1999 8 3.59 15.38 S 0.9 1999 1 20.94 1.97 N 2.16