Bronchial Epithelial Cells Exposed to Zearalenone
Mei Yu So1, ZhiPeng Tian1,2, Yong Shian Phoon1, Sha Sha1, Michael N. Antoniou3, JiangWen Zhang1, Rudolf S. S. Wu1, Kian C Tan-Un1,2*
1School of Biological Sciences, The University of Hong Kong, Hong Kong SAR, China,2School of Professional and Continuing Education, The University of Hong Kong, Hong Kong SAR, China,3Department of Medical and Molecular Genetics, Gene Expression and Therapy Group, King’s College London School of Medicine, Guy’s Hospital, London, United Kingdom
Abstract
Zearalenone (ZEA), a mycoestrogen produced byFusariumfungal species, is mainly found in cereal crops such as maize, wheat and barley. Although ZEA has been reported to be present in air, little is known about the health risk or the molecular basis of action when lung cells are exposed to ZEA. As ZEA has a similar structure to estrogen, its potential risk as an endocrine disrupting chemical (EDC) has thus aroused both environmental and public health concerns. The purpose of this study is to identify the responses and underlying molecular changes that occur when human bronchial epithelial BEAS-2B cells are exposed to ZEA. Differential gene expression profiles were identified in cells that were treated with 40mM ZEA for 6 h and 24 h by high-throughput microarray analysis using Affymetrix Human Gene 2.0 GeneChip. The array results showed that after ZEA treatment, 262 genes at 6 h and 1073 genes at 24 h were invovled in the differential regulation. Pathway analysis revealed that diverse cellular processes were affected when lung cells were exposed to ZEA resulting in impaired response to DNA damage, cell cycle arrest, down-regulation of inflammatory responses and alterations of epigenetic marks. Results of further experiments indicated that 40mM ZEA decreased cell viability, induced apoptosis and promoted reactive oxygen species (ROS) generation in a time-dependent manner. Immuno-suppressive effects of ZEA were further revealed through the suppression of lipopolysaccharide (LPS)-induced expression of pro-inflammatory cytokines (IL-6, IL-8 and IL-1b). Interestingly, the level of global DNA methylation was markedly decreased after 24 h exposure to ZEA. Collectively, these observations suggested that a broad range of toxic effects are elicited by ZEA. Particularly, ROS may play a pivotal role in ZEA-induced cell death. These adverse effects observed in lung cells suggest that exposure to ZEA may increase susceptibility of lung cells to diseases and required further investigations.
Citation:So MY, Tian Z, Phoon YS, Sha S, Antoniou MN, et al. (2014) Gene Expression Profile and Toxic Effects in Human Bronchial Epithelial Cells Exposed to Zearalenone. PLoS ONE 9(5): e96404. doi:10.1371/journal.pone.0096404
Editor:John D Minna, Univesity of Texas Southwestern Medical Center at Dallas, United States of America ReceivedJanuary 20, 2014;AcceptedApril 5, 2014;PublishedMay 2, 2014
Copyright:ß2014 So et al. This is an open-access article distributed under the terms of the Creative Commons Attribution License, which permits unrestricted
use, distribution, and reproduction in any medium, provided the original author and source are credited.
Funding:The work was supported by the Seed Funding Programme for Basic Research and CRCG grants for postgraduate students of the University of Hong Kong as well as funding from HKU School of Professional and Continuing Education (SPACE). The funders had no role in study design, data collection and analysis, decision to publish, or preparation of the manuscript.
Competing Interests:The authors have declared that no competing interests exist. * E-mail: address: [email protected]
Introduction
Mycotoxin Zearalenone (ZEA) is a secondary metabolite produced by various Fusarium fungal species [1,2] which are usually found in contaminated maize, wheat and barley [3]. Due to its structural similarity to estrogen, ZEA competes with estradiol for binding to estrogen receptors (ERs) and provokes estrogenic activities. Extensive studies have found that ZEA caused endocrine disruption and reproductive disorders in in vitro models and in laboratory and farm animals [4,5,6,7]. In addition, other effects of ZEA including developmental toxicity, immunotoxicity and genotoxicity have also been reported [3]. Increasing evidence suggested that these effects are not exclusively due to the estrogenic potency of ZEA but that oxidative stress may be an important mediator of these observed toxic effects [8,9,10].
Besides foods and feeds, inhalation is another route of exposure to ZEA. The detection of ZEA-producing fungi and toxigenic spores in nasal cavity has been reported [11,12]. In addition, the detection of air-borne ZEA was also documented. In a Belgium study, the maximum level of ZEA detected was 2.4mg/kg ZEA
which meant that exposure through dust inhalation for workers in those companies was estimated to be 0.1% of the tolerable daily intake of ZEA [13]. In a study carried out in Dalian, China, it was reported that the daily inhaled ZEA by a worker in a poultry house was estimated to be 17.432–20.512 ng respectively [14].
Estrogens have been shown to induce proliferation of non-small cell lung cancer (NSCLC) through ER-mediated signaling pathways [15]. Additionally, estrogen is also involved in the activation of carcinogens via the metabolism of polycyclic aromatic hydrocarbonds (PAHs) which promotes the formation of catechol estrogens and potentially mutagenic DNA adducts [16,17]. Interestingly, large cohort epidemiological studies indicate that females are more susceptible to developing chronic lung diseases including asthma and Chronic Obstructive Pulmonary Disease (COPD) [18].
induction of oxidative stress. A BEAS-2B cell line over-expressing a free radical scavenger, cytoglobin (CYGB) confirm that ZEA generates free radicals.
Materials and Methods
Cell culture and treatments
Human bronchial epithelial BEAS-2B cell line [19] (from the American Type Culture Collection, ATCC) was cultured in Dulbecco’s Modified Eagles Medium (DMEM) supplemented with 10% (v/v) fetal bovine serum (FBS) and 100 U/ml of penicillin
and 10mg/ml of streptomycin. All cells were maintained in a 37uC humidified incubator with 5% CO2. DMEM with Geneticin (G418, 200mg/ml) were used to maintain and select Cygb
overexpressing cells.
ZEA powder (Sigma) was dissolved in DMSO, aliquoted and stored at220uC. The stock solution of ZEA was freshly diluted by culture medium before use. BEAS-2B cells were seeded overnight to achieve confluency. Cells were exposed to different concentra-tion of ZEA or 0.05% DMSO solvent control for different durations (6, 12, 24 and 48 h) depend on experiments. For immune-responsive experiments, cells were stimulated by 2mg/ml
lipopolysaccharide (LPS, Sigma) for 6 h.
Cell viability assay
16104–16105 cells were seeded in 96-well plates. After incubation overnight, cells were exposed to a serial concentration of ZEA (from 0 to 160 uM) for 6 h, 24 h or 48 h. 20ml of 3-(4,5-dimethylthiazol- 2-yl)-2,5-diphenyltetrazolium bromide (MTT, Invitrogen) solution was then added to each well. After 3 hours incubation, the medium was removed and DMSO was added to dissolve the purple formazan. The optical density of each well was quantified by measuring absorbance at 540 nm. The viabilities of treated groups were expressed as a percentage of control group, which was assumed as 100%.
Sample preparation and RNA extraction
56105 cells were seeded onto 6-well plates. After incubation
overnight, cells were treated with either 0.05% DMSO (solvent control) or 40mM ZEA (treatment) for 6 h and 24 h. RNA was extracted by Trizol reagent (Invitrogen) according to the manufacturer’s protocol. The quality of RNA for microarray analysis was analyzed by the RNA 6000 Nano total RNA Assay using the Agilent 2100 Bioanalyzer. Only RNA samples with an A260/A280 ratio ,1.8, 28S/18S ratio larger than 1.8 and RNA integrity number (RIN) larger than 8.0 were used for downstream GeneChip analysis.
Gene expression profiling and data analysis
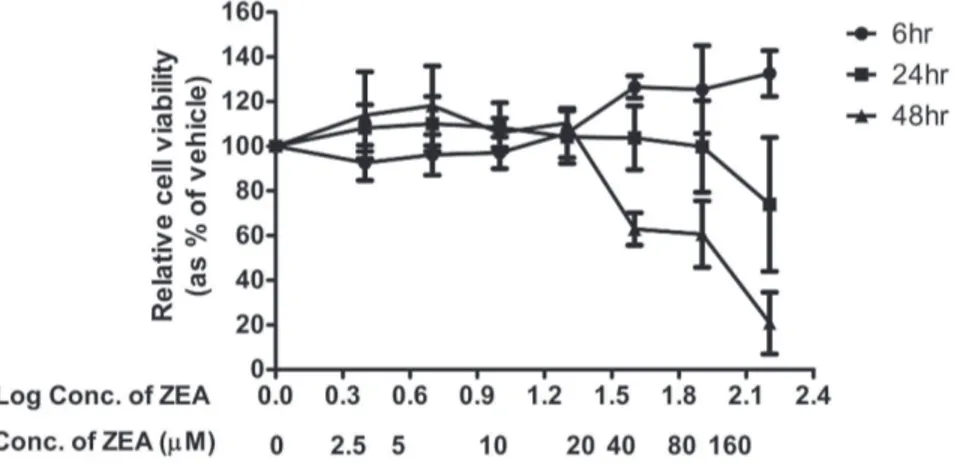
The gene expression profiles were determined using GeneChipH Human Gene 2.0 ST Arrays (Affymetrix). Samples were hybridized onto array chips, stained, washed, and scanned according to Affymetrix protocol. The array image and cell intensity files (.CEL files) were generated by Affymetric GeneChip Figure 1. Cytotoxic effects of ZEA on BEAS-2B cells determined by MTT assay.Cells were treated with increasing concentrations of ZEA (from 0 to 160mM) for 48 h. Cell viability was expressed as percentages of control (values taken as 100%) and are mean 6SD of at least 3
independent experiments. * representsp,0.05 significantly different from control as assessed by t-test. doi:10.1371/journal.pone.0096404.g001
Command Console. Both the RNA quality control tests and GeneChip analysis were conducted by Center for Genomic Services, HKU.
The data of GeneChip were analyzed using Agilent GeneSpring GX11 Software, Affrymetrix Transcriptome Analysis Console (TAC) Software and R software (http://www.r-project.org). When using the GeneSpring Software, filtering was performed to remove background noise. Probes that have signals weaker than 20th percentile of overall signal were not included into analysis. Differentially expressed genes were identified as fold change $ 1.5 and p,0.05 by unpaired t-test. Over-represented Gene Ontology (GO) terms and enriched pathways associated with the list of differentially expressed genes were generated by the built-in GO and Single Experiment Analysis (SEA) of GeneSpring. Only GO terms and pathways that have more than 2 entities (§3) involved and p-value,0.05 were considered.
To further analyze the gene expression data, the Gene Set Enrichment Analysis (GSEA) were used to identify cohorts of genes which are linked to certain biological processes/cellular signaling pathways. Differentially expressed genes with annota-tions and known features were subjected to GSEA. Pathways are ranked according to the significance of enrichment [61]. Gene sets with a p-value,0.05 by one-way ANOVA and False Discovery Rate (FDR),0.05 by multiple test correction of were considered to be significantly affected.
Validation of gene expression by Quantitative Real-time PCR (qPCR)
cDNA was synthesized from 1mg RNA by using PrimeScriptTM
RT Master Mix (Takara) according to manufacturer’s instructions. Primers were designed to avoid amplification of genomic DNA
Table 1.The 30 most differentially expressed genes in BEAS-2B cells after 6 h treatment with ZEA.
Gene symbol Gene description
Fold
change p-value
Up-regulated:
HSPA1B, HSPA1A Heat shock 70 kDa protein 1B, heat shock 70 kDa protein 1A 3.78 7.87E-07 SDIM1 Stress responsive DNAJB4 interacting membrane protein 1 2.63 0.00041
COPG2IT1 COPG2 imprinted transcript 1 (non-protein coding) 2.56 0.00087
DNAJA4 DnaJ (Hsp40) homolog, subfamily A, member 4 2.29 8.2E-05
LINC00473 Long intergenic non-protein coding RNA 473 2.29 6.4E-05
PARD6G-AS1 PARD6G antisense RNA 1 (non-protein coding) 2.25 7.2E-05
FAM72C Family with sequence similarity 72, member C 2.22 0.0003
HSPA4L Heat shock 70 kDa protein 4-like 2.17 1.7E-05
DDIT4 DNA-damage-inducible transcript 4 2.15 0.00044
ARL17A, ARL17B ADP-ribosylation factor-like 17A, ADP-ribosylation factor-like 17B, ADP-ribosylation factor-like protein 17-like 2.13 9.25E-07
BAG3 BCL2-associated athanogene 3 2.12 2.1E-05
MT1F Metallothionein 1F 2.05 0.00039
DRP2 Dystrophin related protein 2 2.03 0.00581
CHORDC1 Cysteine and histidine-rich domain (CHORD) containing 1 2.02 0.00012
LINC00310 Long intergenic non-protein coding RNA 310 1.98 6.9E-05
Down-regulated:
KRTAP2-4 Keratin associated protein 2-4-like, keratin associated protein 2-4 23.28 7.7E-05 SERPINB2, SERPINB10 Serpin peptidase inhibitor, clade B (ovalbumin), member 2, serpin peptidase Inhibitor, clade B (ovalbumin),
member 10
22.87 4E-06
PLAU Plasminogen activator, urokinase 22.79 4.2E-05
SHISA2 Shisa homolog 2 (Xenopus laevis) 22.72 0.00001
CYP1B1 Cytochrome P450, family 1, subfamily B, polypeptide 1 22.66 7E-06
DLX2 Distal-less homeobox 2 22.63 0.00007
EDN1 Endothelin 1 22.57 6.9E-05
FOSL1 FOS-like antigen 1 22.44 1.1E-05
ADAMTS1 ADAM metallopeptidase with thrombospondin type 1 motif, 1 22.29 0.00062
SMAD7 SMAD family member 7 22.24 0.00039
KLF10 Kruppel-like factor 10 22.22 0.00018
IL8 Interleukin 8 22.22 0.0107
KRT80 Keratin 80 22.11 0.00016
RUNX2 Runt-related transcription factor 2 22.05 2.6E-05
LOC100131234 Familial acute myelogenous leukemia related factor 22.04 8.4E-05
using Primer Premier 5 software. The sequences of the primers used are shown in Table S1. qPCR was performed using FastStart Universal SYBR Green Master mix (Roche) and reaction mixes were set up as per manufacturer’s instructions. The cycles were set as 95uC, 10 min, 40 cycles of 95uCfor 15 sec, 60uCfor 20 sec and 72uCfor 45 sec followed by melting curve analysis. The change in gene expression was calculated by comparative CT method with the housekeeping geneb–actin used for normalization.
Measurement of Reactive Oxygen Species (ROS) levels by DCFH-DA assay
The intracellular ROS levels were quantified by a fluorescent probe, 29,79-dichlorofluorescein-diacetate (DCFH-DA, Molecular
Probes). After treatment with 40mM ZEA, cells were washed and resuspended in PBS at a concentration of 106cells/ml and then incubated with 10mM DCFH-DA at 37uC for 40 minutes in the dark. The ROS production was quantified by DCF fluorescence intensity from 104cells by flow cytometry. Results were expressed as the percentage of ROS generation as compared to control.
Establishment ofCygbstably overexpressing cells
The stable BEAS-2B over-expressing Cytoglobin (Cygb) by comprising the coding region of mouseCygbwhich was cloned to pcDNA 3.1/V5-His A vector (Invitrogen) between Hind III and Xho I sites.
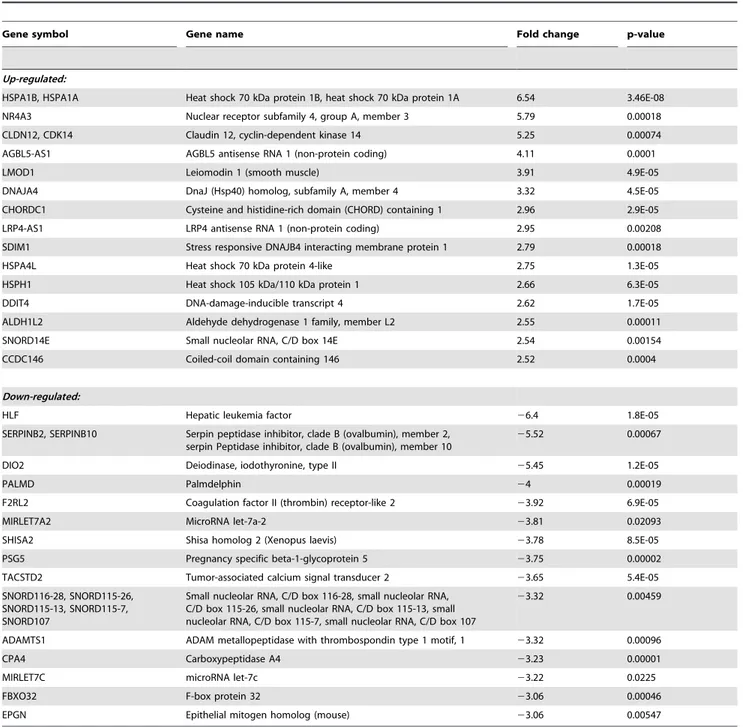
Table 2.The 30 most differentially expressed genes in BEAS-2B cells after 24 h treatment with ZEA.
Gene symbol Gene name Fold change p-value
Up-regulated:
HSPA1B, HSPA1A Heat shock 70 kDa protein 1B, heat shock 70 kDa protein 1A 6.54 3.46E-08 NR4A3 Nuclear receptor subfamily 4, group A, member 3 5.79 0.00018 CLDN12, CDK14 Claudin 12, cyclin-dependent kinase 14 5.25 0.00074
AGBL5-AS1 AGBL5 antisense RNA 1 (non-protein coding) 4.11 0.0001
LMOD1 Leiomodin 1 (smooth muscle) 3.91 4.9E-05
DNAJA4 DnaJ (Hsp40) homolog, subfamily A, member 4 3.32 4.5E-05
CHORDC1 Cysteine and histidine-rich domain (CHORD) containing 1 2.96 2.9E-05
LRP4-AS1 LRP4 antisense RNA 1 (non-protein coding) 2.95 0.00208
SDIM1 Stress responsive DNAJB4 interacting membrane protein 1 2.79 0.00018
HSPA4L Heat shock 70 kDa protein 4-like 2.75 1.3E-05
HSPH1 Heat shock 105 kDa/110 kDa protein 1 2.66 6.3E-05
DDIT4 DNA-damage-inducible transcript 4 2.62 1.7E-05
ALDH1L2 Aldehyde dehydrogenase 1 family, member L2 2.55 0.00011
SNORD14E Small nucleolar RNA, C/D box 14E 2.54 0.00154
CCDC146 Coiled-coil domain containing 146 2.52 0.0004
Down-regulated:
HLF Hepatic leukemia factor 26.4 1.8E-05
SERPINB2, SERPINB10 Serpin peptidase inhibitor, clade B (ovalbumin), member 2, serpin Peptidase inhibitor, clade B (ovalbumin), member 10
25.52 0.00067
DIO2 Deiodinase, iodothyronine, type II 25.45 1.2E-05
PALMD Palmdelphin 24 0.00019
F2RL2 Coagulation factor II (thrombin) receptor-like 2 23.92 6.9E-05
MIRLET7A2 MicroRNA let-7a-2 23.81 0.02093
SHISA2 Shisa homolog 2 (Xenopus laevis) 23.78 8.5E-05
PSG5 Pregnancy specific beta-1-glycoprotein 5 23.75 0.00002
TACSTD2 Tumor-associated calcium signal transducer 2 23.65 5.4E-05 SNORD116-28, SNORD115-26,
SNORD115-13, SNORD115-7, SNORD107
Small nucleolar RNA, C/D box 116-28, small nucleolar RNA, C/D box 115-26, small nucleolar RNA, C/D box 115-13, small nucleolar RNA, C/D box 115-7, small nucleolar RNA, C/D box 107
23.32 0.00459
ADAMTS1 ADAM metallopeptidase with thrombospondin type 1 motif, 1 23.32 0.00096
CPA4 Carboxypeptidase A4 23.23 0.00001
MIRLET7C microRNA let-7c 23.22 0.0225
FBXO32 F-box protein 32 23.06 0.00046
EPGN Epithelial mitogen homolog (mouse) 23.06 0.00547
To establish stably Cygb expressing cells, a 1576 bp core ubiquitously-acting chromatin opening element (UCOE, a gift from Dr. Michael Antoniou, School of Medicine, King’s College London, UK) was inserted to the upstream of the CMV promoter of pcDNA 3.1/V5-His A/Cygb. Successfully transfected cells were selected using selective medium (DMEM with 10% FBS and 600mg/ml G418). After 14 days of selection, single colonies were picked and expression levels were checked to identify the clones
withCygbover-expression. The incorporation of the UCOE onto the Cygb–transgene construct resulted in the sustained high expression of cytogobin in the stable BEAS-2B cell line. This stable over-expression cell line was employed as a model system to investigate the effects of free radicals generated by ZEA on cell viability.
Table 3.Key pathways predicted by Single Experiment Analysis (SEA) following treatment with ZEA in BEAS-2B cells.
Pathway
Number of differential entities involved
Total number of entities in the
category p-values
Treated with ZEA for 6 hr:
TGF-beta signaling pathway 3 55 0.00499
Treated with ZEA for 24 hr:
DNA Replication 14 42 0
G1 to S cell cycle control 17 68 1.21E-10
Cell cycle 19 103 2.33E-10
Synthesis of DNA 7 13 1.01E-09
Cholesterol biosynthesis 7 17 2.26E-08
Regulation of DNA replication 5 7 6.95E-08
SREBP signaling 10 56 1.45E-07
TGF Beta Signaling Pathway 9 55 1.55E-06
miRNA regulation of DNA Damage Response 10 98 2.64E-05
Lymphocyte TarBase 22 420 4.97E-05
Epithelium TarBase 17 278 5.52E-05
Senescence and Autophagy 10 106 6.23E-05
DNA damage response 8 68 7.07E-05
E2F-MIRHG1 feedback-loop 3 5 8.12E-05
Mitotic M-M-G1 phases 4 15 1.93E-04
AhR pathway 5 28 2.28E-04
SREBF and miR33 in cholesterol and lipid homeostasis 4 18 4.13E-04
APC-C-mediated degradation of cell cycle proteins 3 10 9.03E-04
L1CAM interactions 4 27 0.0011
BMP signaling and regulation 3 12 0.0016
Androgen receptor signaling pathway 7 85 0.0018
Unfolded Protein Response 3 14 0.0021
Leukocyte TarBase 8 128 0.0043
p38 MAPK Signaling Pathway 4 34 0.0048
MAPK signaling pathway 9 161 0.0056
TSH signaling pathway 5 65 0.010
Complement and Coagulation Cascades 4 64 0.020
Mitotic G1-G1-S phases 2 11 0.020
Metabolism of nucleotides 2 12 0.024
Apoptosis 5 83 0.027
Integrin cell surface interactions 2 16 0.032
Interleukin-1 signaling 2 15 0.032
Keap1-Nrf2 Pathway 2 14 0.032
Cancer prevention 2 15 0.036
Cell Cycle Checkpoints 2 16 0.036
miRNAs involved in DDR 4 69 0.043
Interleukin-11 Signaling Pathway 3 40 0.047
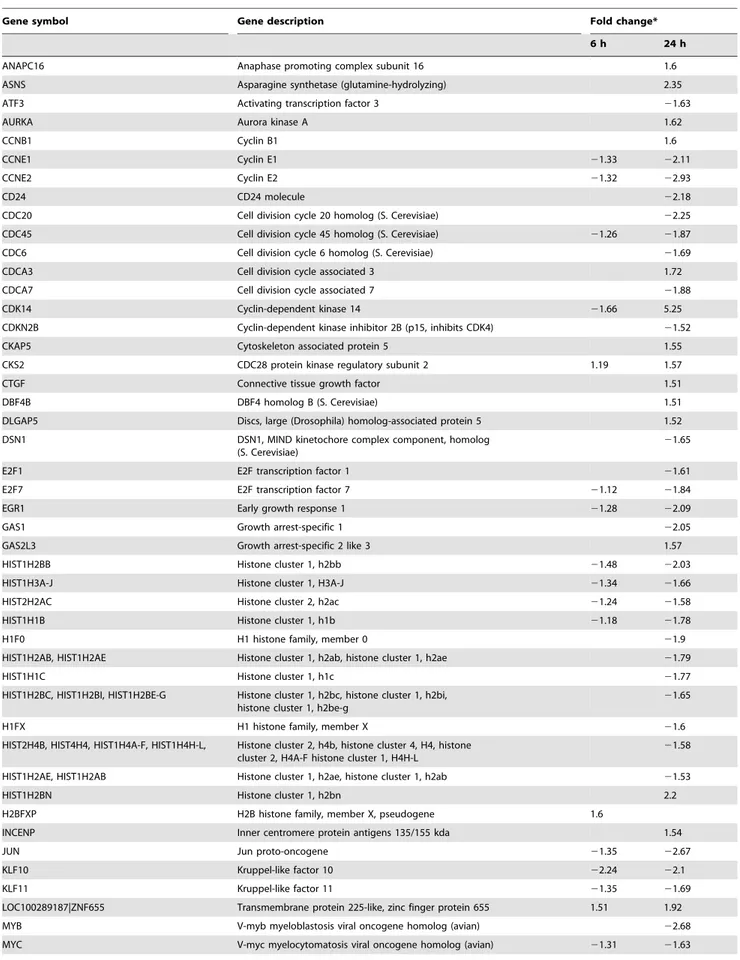
Table 4.Differentially expressed genes related to cell cycle regulation.
Gene symbol Gene description Fold change*
6 h 24 h
ANAPC16 Anaphase promoting complex subunit 16 1.6
ASNS Asparagine synthetase (glutamine-hydrolyzing) 2.35
ATF3 Activating transcription factor 3 21.63
AURKA Aurora kinase A 1.62
CCNB1 Cyclin B1 1.6
CCNE1 Cyclin E1 21.33 22.11
CCNE2 Cyclin E2 21.32 22.93
CD24 CD24 molecule 22.18
CDC20 Cell division cycle 20 homolog (S. Cerevisiae) 22.25
CDC45 Cell division cycle 45 homolog (S. Cerevisiae) 21.26 21.87
CDC6 Cell division cycle 6 homolog (S. Cerevisiae) 21.69
CDCA3 Cell division cycle associated 3 1.72
CDCA7 Cell division cycle associated 7 21.88
CDK14 Cyclin-dependent kinase 14 21.66 5.25
CDKN2B Cyclin-dependent kinase inhibitor 2B (p15, inhibits CDK4) 21.52
CKAP5 Cytoskeleton associated protein 5 1.55
CKS2 CDC28 protein kinase regulatory subunit 2 1.19 1.57
CTGF Connective tissue growth factor 1.51
DBF4B DBF4 homolog B (S. Cerevisiae) 1.51
DLGAP5 Discs, large (Drosophila) homolog-associated protein 5 1.52
DSN1 DSN1, MIND kinetochore complex component, homolog (S. Cerevisiae)
21.65
E2F1 E2F transcription factor 1 21.61
E2F7 E2F transcription factor 7 21.12 21.84
EGR1 Early growth response 1 21.28 22.09
GAS1 Growth arrest-specific 1 22.05
GAS2L3 Growth arrest-specific 2 like 3 1.57
HIST1H2BB Histone cluster 1, h2bb 21.48 22.03
HIST1H3A-J Histone cluster 1, H3A-J 21.34 21.66
HIST2H2AC Histone cluster 2, h2ac 21.24 21.58
HIST1H1B Histone cluster 1, h1b 21.18 21.78
H1F0 H1 histone family, member 0 21.9
HIST1H2AB, HIST1H2AE Histone cluster 1, h2ab, histone cluster 1, h2ae 21.79
HIST1H1C Histone cluster 1, h1c 21.77
HIST1H2BC, HIST1H2BI, HIST1H2BE-G Histone cluster 1, h2bc, histone cluster 1, h2bi, histone cluster 1, h2be-g
21.65
H1FX H1 histone family, member X 21.6
HIST2H4B, HIST4H4, HIST1H4A-F, HIST1H4H-L, Histone cluster 2, h4b, histone cluster 4, H4, histone cluster 2, H4A-F histone cluster 1, H4H-L
21.58
HIST1H2AE, HIST1H2AB Histone cluster 1, h2ae, histone cluster 1, h2ab 21.53
HIST1H2BN Histone cluster 1, h2bn 2.2
H2BFXP H2B histone family, member X, pseudogene 1.6
INCENP Inner centromere protein antigens 135/155 kda 1.54
JUN Jun proto-oncogene 21.35 22.67
KLF10 Kruppel-like factor 10 22.24 22.1
KLF11 Kruppel-like factor 11 21.35 21.69
LOC100289187|ZNF655 Transmembrane protein 225-like, zinc finger protein 655 1.51 1.92
MYB V-myb myeloblastosis viral oncogene homolog (avian) 22.68
Cell death pathway analysis by Annexin V/PI double staining
The apoptotic statuses of cells were determined using Annexin V-FITC Apoptosis Detection Kit I (BD Pharmingen) following manufacturer’s instructions. Briefly, cells treated with 40mM ZEA were washed with phosphate buffered saline (PBS) and then resuspended in binding buffer at a concentration of 106cells/ml. Annexin V-FITC and Propidium Iodide (PI) were added to the resuspended cells. Cells were incubated for 15 min at room temperature in the dark. Apoptotic cells were analysed from 104 cells with a Beckman-Coulter FACScan flow cytometer. The percentage of living, early apoptotic and dead cells were quantified using the Modfit LT program.
Global DNA methylation analysis
To obtain an insight into the epigenetic effects of ZEA, global DNA methylation levels were investigated. 5-aza-cytidine, a known DNA methylation inhibitor acting as a substitute substrate for DNA methyltransferase, was used as positive control. BEAS-2B cells were treated with DMSO, 40mM ZEA or 1mM
5-aza-cytidine for 24 h. After treatment, genomic DNA was extracted using UltraClean Tissue & Cells DNA Isolation Kit (MO Bio Laboratories, Inc.) according to the manufacturer’s protocols. The concentrations and qualities of DNA were quantified by Nano-Drop ND-1000 Spectrophotometer (Nano-Nano-Drop Technologies) and checked by 0.7% agarose gel electrophoresis, respectively. The global DNA methylation levels were determined using MethylFlash Methylated DNA Quantification Kit (Colorimetric) (Epigentek Group Inc.) following manufacturer’s instructions. DNA is bound to specifically treated strip wells that have high DNA affinity. The 5-methylcytosine of DNA is detected using antibodies and quantified using an ELISA-like reaction by reading absorbance at 450 nm.
Statistical analysis
Unless otherwise specified, all data are results of 3 independent experiments, each with 3 samples per group and represent as mean6 SD. Student t-test and one-way analysis of variance (ANOVA) followed by Duncan’s post hoc test were conducted using SPSS v11.5 software. Values ofp,0.05 were considered as significant.
Results
ZEA reduced viability of BEAS-2B cells
The cytotoxic effects of ZEA on cell viability were determined using MTT assay. The results revealed that ZEA induced cell death in a time- and dose-dependent manner (p,0.05). After 48 h treatments, the Lowest Observable Adverse Effect Level (LOAEL) was 40mM, with a percentage of viable cells of 62.9667.30% (Figure 1). As 40mM has no significant inhibitory effect on cell
viability after 6 h and 24 h treatments but was the LOAEL after 48 h treatment, it was chosen as the concentration for use in subsequent experiments.
Identification of differentially expressed genes
The number of differentially expressed genes are observed to increase in a time-dependent manner. According to the Tran-scriptome Analysis Console (TAC) software, out of 53,617 gene probes on the Genechip, 262 (131 genes up-regulated and 131 genes down-regulated) and 1073 (357 genes up-regulated and 716 genes down-regulated) genes were differentially expressed at 6 h and 24 h, respectively. The complete list of the differentially expressed genes and their fold change at 6 h and 24 h are shown in Table S2 and S3, respectively. The number of commonly up-regulated and down-up-regulated genes at both time points is 67 and 68, respectively (Figure 2).
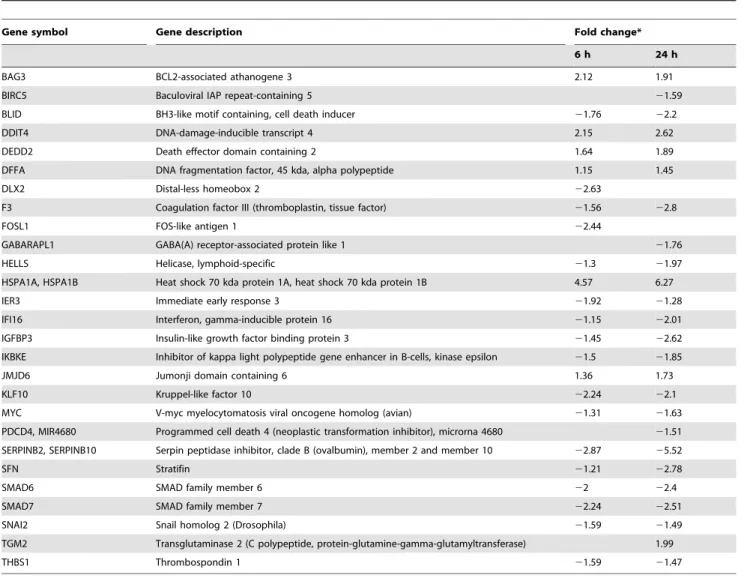
For both time-point, the most significantly up-regulated genes are heat shock proteins of 70 kDA in size (HSPA1B, HSPA1A) which increased by 3.7-fold and 6.54-fold at 6 h and 24 h,
Table 4.Cont.
Gene symbol Gene description Fold change*
6 h 24 h
NEK2 NIMA (never in mitosis gene a)-related kinase 2 2.17
NEK6 NIMA (never in mitosis gene a)-related kinase 6 21.24 21.57
NOG Noggin 21.95 22.35
PAK3 P21 protein (Cdc42/Rac)-activated kinase 3 1.63 1.91
PLK2 Polo-like kinase 2 21.16 21.64
RHOB Ras homolog gene family, member B 21.43 21.81
SERPINE1 Serpin peptidase inhibitor, clade E (nexin, plasminogen activator inhibitor type 1), member 1
21.09 22.33
TGFB2 Transforming growth factor, beta 2 21.2 21.75
TGFBR1 Transforming growth factor, beta receptor 1 21.51
TGFBR3 Transforming growth factor, beta receptor III 21.57
THBS1 Thrombospondin 1 21.59 21.47
UBE2C Ubiquitin-conjugating enzyme E2C 1.77
UBE2S Ubiquitin-conjugating enzyme E2S 1.62
WISP2 WNT1 inducible signaling pathway protein 2 21.26 22.24
respectively (Table 1 and Table 2). On the other hand, the most significantly down-regulated gene common for both time points is serpin peptidase inhibitor, clade B (ovalbumin), member 2 and 10 (SERPINB2, B10) which decreased by 2.87-fold and 5.52-fold at 6 h and 24 h, respectively.
Functional classification of differentially expressed genes
The identification of enriched ‘‘Biological Processes’’ under GO category was performed using GeneSpring. The enriched GO terms at 6 h and 24 h are shown in Table S4 and Table S5 respectively. The most significantly enriched GO term at 6 h is ‘‘protein folding’’ (p = 5.59E-07) while that at 24 h is ‘‘DNA dependent DNA replication’’ (p = 1.35E-14).
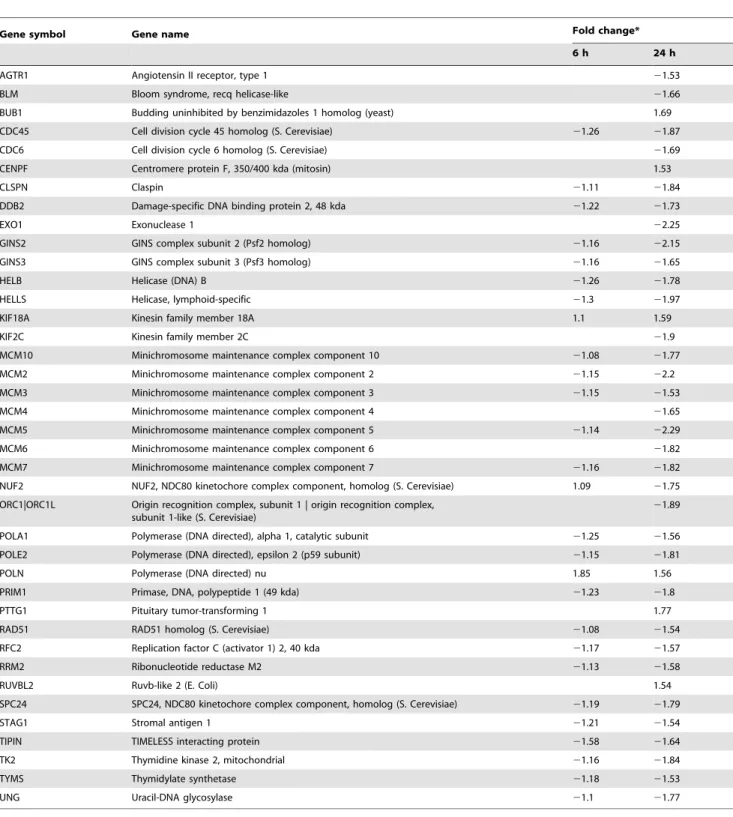
Table 5.Differentially expressed genes related to replication, damage and repair of DNA.
Gene symbol Gene name Fold change*
6 h 24 h
AGTR1 Angiotensin II receptor, type 1 21.53
BLM Bloom syndrome, recq helicase-like 21.66
BUB1 Budding uninhibited by benzimidazoles 1 homolog (yeast) 1.69
CDC45 Cell division cycle 45 homolog (S. Cerevisiae) 21.26 21.87
CDC6 Cell division cycle 6 homolog (S. Cerevisiae) 21.69
CENPF Centromere protein F, 350/400 kda (mitosin) 1.53
CLSPN Claspin 21.11 21.84
DDB2 Damage-specific DNA binding protein 2, 48 kda 21.22 21.73
EXO1 Exonuclease 1 22.25
GINS2 GINS complex subunit 2 (Psf2 homolog) 21.16 22.15
GINS3 GINS complex subunit 3 (Psf3 homolog) 21.16 21.65
HELB Helicase (DNA) B 21.26 21.78
HELLS Helicase, lymphoid-specific 21.3 21.97
KIF18A Kinesin family member 18A 1.1 1.59
KIF2C Kinesin family member 2C 21.9
MCM10 Minichromosome maintenance complex component 10 21.08 21.77
MCM2 Minichromosome maintenance complex component 2 21.15 22.2
MCM3 Minichromosome maintenance complex component 3 21.15 21.53
MCM4 Minichromosome maintenance complex component 4 21.65
MCM5 Minichromosome maintenance complex component 5 21.14 22.29
MCM6 Minichromosome maintenance complex component 6 21.82
MCM7 Minichromosome maintenance complex component 7 21.16 21.82
NUF2 NUF2, NDC80 kinetochore complex component, homolog (S. Cerevisiae) 1.09 21.75 ORC1|ORC1L Origin recognition complex, subunit 1 | origin recognition complex,
subunit 1-like (S. Cerevisiae)
21.89
POLA1 Polymerase (DNA directed), alpha 1, catalytic subunit 21.25 21.56 POLE2 Polymerase (DNA directed), epsilon 2 (p59 subunit) 21.15 21.81
POLN Polymerase (DNA directed) nu 1.85 1.56
PRIM1 Primase, DNA, polypeptide 1 (49 kda) 21.23 21.8
PTTG1 Pituitary tumor-transforming 1 1.77
RAD51 RAD51 homolog (S. Cerevisiae) 21.08 21.54
RFC2 Replication factor C (activator 1) 2, 40 kda 21.17 21.57
RRM2 Ribonucleotide reductase M2 21.13 21.58
RUVBL2 Ruvb-like 2 (E. Coli) 1.54
SPC24 SPC24, NDC80 kinetochore complex component, homolog (S. Cerevisiae) 21.19 21.79
STAG1 Stromal antigen 1 21.21 21.54
TIPIN TIMELESS interacting protein 21.58 21.64
TK2 Thymidine kinase 2, mitochondrial 21.16 21.84
TYMS Thymidylate synthetase 21.18 21.53
UNG Uracil-DNA glycosylase 21.1 21.77
Pathway analysis of differentially expressed genes
The pathways altered after ZEA treatments were identified by single experiment analysis (SEA) using GeneSpring. The over-represented pathways at 6 h and 24 h are shown in Table 3. At 6 h, only the ‘‘transforming growth factor-beta (TGF-b) signaling’’ pathway is altered. At 24 h, the top five most significantly altered pathways are ‘‘DNA Replication’’, ‘‘G1 to S cell cycle control’’, ‘‘cell cycle’’, ‘‘synthesis of DNA’’ and ‘‘cholesterol biosynthesis’’. These results suggest that ZEA alters DNA replication and cell cycle progression in BEAS-2B cells. The differentially expressed genes associated with the progression of cell cycle from G1 to S phase, the replication, damage and repair of DNA and the apoptotic pathway are shown in Table 4, Table 5 and Table 6 respectively.
In addition, the analysis also revealed significantly enriched Keap1-Nrf2 pathway (p-value = 0.032, Table 3) which suggested that the oxidative status of cells is altered. The apoptotic pathway is another significantly altered biological process that was observed (p-value = 0.027, Table 3). The list of differentially expressed genes related to apoptosis is summarized in Table 6.
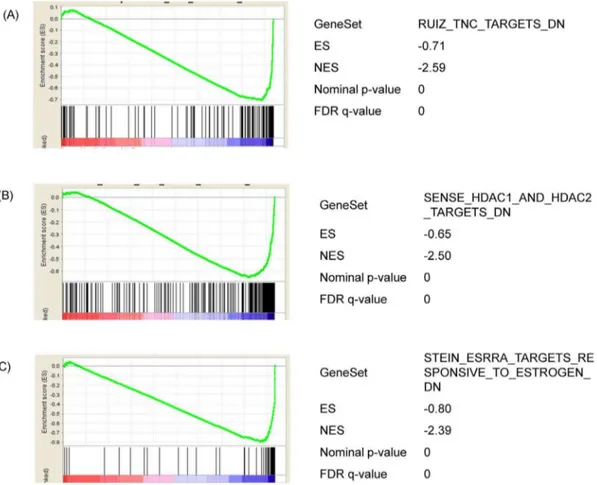
To further identify the dysregulated biological processes, differential regulated genes were subjected to Gene Set Enrich-ment Analysis (GSEA). GSEA enabled us to determine whether a
priori defined set of genes is statistically significantly (with nominal p-value ,0.05 and FDR,0.25) enriched after treatment with ZEA. The detailed results are shown in Table S6. Interestingly, in addition to the pathways as identified by SEA, gene sets related to the extracellular matrix molecule tenascin C [20], histone deacetylation [21] and estrogenic responses [22] were also recognized to be enriched (Figure 3).
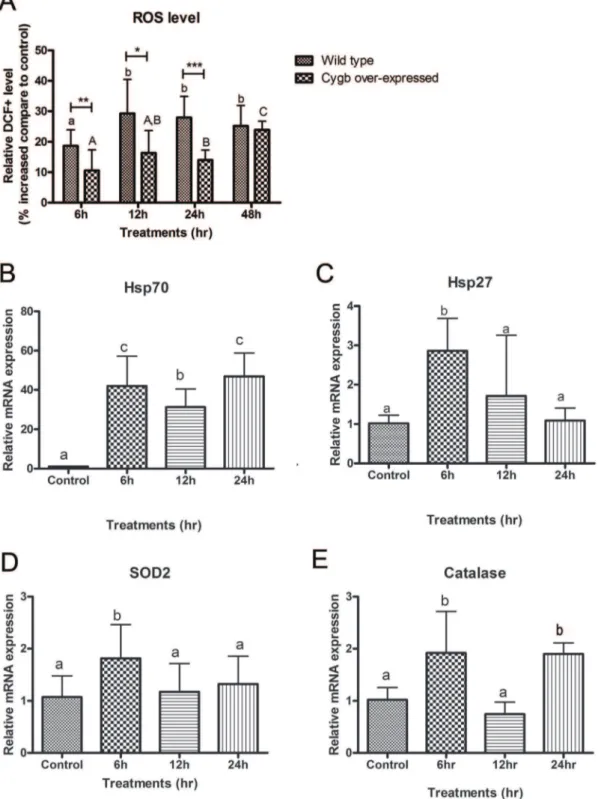
ZEA induced oxidative stress in BEAS-2B cells
The generation of ROS after treatment with ZEA was detected by flow cytometry. The fluorescence intensity in wild type cells that were exposed to 40mM ZEA for 6, 12, 24 and 48 h increased
in a time-dependent manner by 18.4, 29.3, 28.0 and 25.1%, respectively (Figure 4A).
Concurred with the induction of ROS levels, the expressions of selected oxidative stress-related genes were up-regulated (Figure 4B-E). The up-regulation of heat shock protein 27 (Hsp27), superoxide dismutase (SOD2) and catalase were more pronounced at 6 h and their expression were increased by 2.86, 1.81 and 1.92 folds, respectively. Moreover, the expression of heat shock protein 70 (Hsp70) was dramatically increased by 41.98 folds and the up-regulation was maintained after 12 and 24 h treatment.
Table 6.Differentially expressed genes related to apoptosis.
Gene symbol Gene description Fold change*
6 h 24 h
BAG3 BCL2-associated athanogene 3 2.12 1.91
BIRC5 Baculoviral IAP repeat-containing 5 21.59
BLID BH3-like motif containing, cell death inducer 21.76 22.2
DDIT4 DNA-damage-inducible transcript 4 2.15 2.62
DEDD2 Death effector domain containing 2 1.64 1.89
DFFA DNA fragmentation factor, 45 kda, alpha polypeptide 1.15 1.45
DLX2 Distal-less homeobox 2 22.63
F3 Coagulation factor III (thromboplastin, tissue factor) 21.56 22.8
FOSL1 FOS-like antigen 1 22.44
GABARAPL1 GABA(A) receptor-associated protein like 1 21.76
HELLS Helicase, lymphoid-specific 21.3 21.97
HSPA1A, HSPA1B Heat shock 70 kda protein 1A, heat shock 70 kda protein 1B 4.57 6.27
IER3 Immediate early response 3 21.92 21.28
IFI16 Interferon, gamma-inducible protein 16 21.15 22.01
IGFBP3 Insulin-like growth factor binding protein 3 21.45 22.62
IKBKE Inhibitor of kappa light polypeptide gene enhancer in B-cells, kinase epsilon 21.5 21.85
JMJD6 Jumonji domain containing 6 1.36 1.73
KLF10 Kruppel-like factor 10 22.24 22.1
MYC V-myc myelocytomatosis viral oncogene homolog (avian) 21.31 21.63 PDCD4, MIR4680 Programmed cell death 4 (neoplastic transformation inhibitor), microrna 4680 21.51 SERPINB2, SERPINB10 Serpin peptidase inhibitor, clade B (ovalbumin), member 2 and member 10 22.87 25.52
SFN Stratifin 21.21 22.78
SMAD6 SMAD family member 6 22 22.4
SMAD7 SMAD family member 7 22.24 22.51
SNAI2 Snail homolog 2 (Drosophila) 21.59 21.49
TGM2 Transglutaminase 2 (C polypeptide, protein-glutamine-gamma-glutamyltransferase) 1.99
THBS1 Thrombospondin 1 21.59 21.47
Over-expression of CYGB reduced ZEA-induced ROS generation and apoptosis in BEAS-2B cells
Over-expression of CYGB, a free radical scavenger, was used to study the role of oxidative stress upon ZEA-induced cytotoxicity. Unlike the wild type BEAS-2B cells, the detection of significantly increased level of ROS was delayed to after 24 h and 48 h ZEA exposure. In addition, the level of induction was lowered to 14.0 and 23.9%, respectively (Figure 4A). These results suggested that over-expression of CYGB can attenuate and postpone the increase of ROS levels induced by ZEA.
The detection of apoptotic cells was done by flow cytometry. Apoptotic cells were found in both wild type and CYGB-overexpressing cells after 24 and 48 h ZEA treatment (Figure 5). Over-expression of the endogenous free radcial scavenger, CYGB, conferred protective effects against ZEA-induced cell death. After ZEA exposure for 48 h, 13.6862.96% of wild type whilst 74.5560.78% of CYGB-overexpressing cells were still alive. On the other hand, 72.5762.61% of wild type whilst 13.9561.15% of CYGB-overexpressing cells underwent apoptosis and were at late apoptotic states.
Validation of differentially expressed genes by qPCR
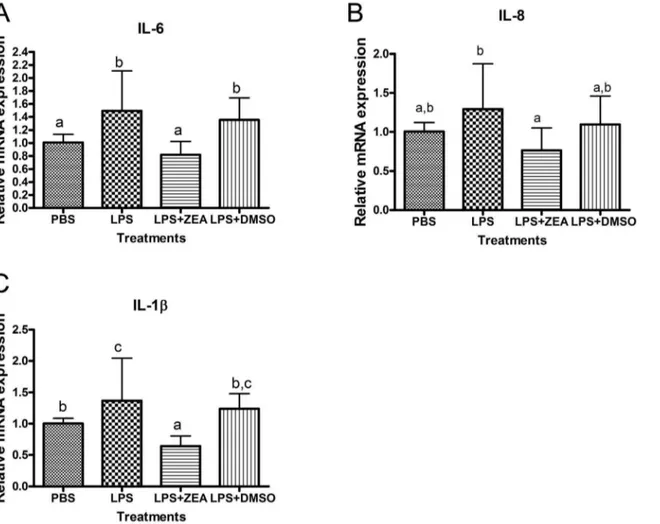
Disturbingly, many of the pro-inflammatory responsive genes were down-regulated while those anti-inflammatory genes were up-regulated (Table 7). The anti-inflammatory effects of ZEA were further revealed in its ability to reduce lipopolysaccharide (LPS)-induced release of pro-inflammatory cytokines. After 6 h treat-ment, LPS alone induced the expressions of IL-6, IL-8 and IL-1b
by 1.49, 1.37 and 1.29 folds, respectively. However, the inductions of these cytokines were significantly suppressed by ZEA (Figure 6). After analyzing the microarray data, the expression changes of 10 selected genes including SERPINB2 and PLAU (apoptosis), CYP1B1 (aryl hydrocarbon receptor signaling), SMAD7 (TGF-b
signaling), IL-8 and IL-37 (inflammatory response), JUN and EGR1 (regulation of transcription), CCNE2 (progression of cell cycle) and DDIT4 (response to DNA damage) were verified by quantitative real-time PCR (qPCR). The expression pattern (direction of regulation) showed a good agreement between the data of microarray and qPCR, although the fold-changes detected by qPCR appeared to be more pronounced (Figure 7).
Figure 3. Analysis of the functional gene set enrichment after 24 h ZEA treatment by GSEA.Differential gene expression was ranked by fold change. The most up-regulated genes are shown on the left while the most down-regulated genes are shown on the right. The black vertical lines indicate where the genes in the signature get set appeared. (A) Genes that is down-regulated in the presence of extracellular matrix molecule Tenascin C. (B) Genes that are down-regulated upon knockdown of boh histone deacetylase (HDAC) 1 and 2. (C) Genes that are down-regulated by estradol and down-regulated by estrogen-related receptor alpha. Enrichment score (ES, Y axis) is a running-sum statistic showing if the prior defined set of genes are randomly distributed or found at the extremes (top or bottom) of the list. If the genes are overrepresented at the bottom of our ranked list of genes, the ES will be close to21 and vice versa. A normalized enrichment score (NES) takes into account the number of genes in the pathway. A negative NES indicates ‘‘bottom’’ enrichment of the list. The interpretation of the plots referred to [61].
Figure 4. Induction of oxidative stress in BEAS-2B cells by ZEA.(A) Levels of ROS in wild type and CYGB over-expressed cells detected by DCFH-DA probe using flow cytometry. Relative DCF+levels (equivalent to intracellular ROS levels) were expressed as percentage increased compare
to DMSO control. Bars with a and b denote significant differences in wild type whereas A,B and C reflect significant differences in CYGB over-expressed cells (One-way ANOVA,p,0.05). *, ** and *** representp,0.05,p,0.01 andp,0.001 denoting significant differences from respective wild type values. The mRNA expression of oxidative stress related genes in BEAS-2B cells were quantified by real-time PCR. The mRNA expression ofb– actin was used for normalization. (B) Heat shock protein 70 (Hsp70). (C) Heat shock protein 27 (Hsp27). (D) Superoxide dismutase 2 (SOD2). (E) Catalase. Results represent the mean6SD of at least 3 independent experiments. Bars with different alphabets are significant different (One-way ANOVA,p,0.05).
ZEA caused global DNA hypomethylation in BEAS-2B cells
As shown in Figure 8, the level of global DNA methylation was significantly lowered to 40.3611.1% (p,0.01) and 53.09633.75% (p,0.01) relative to control in cells treated with 1mM
5-aza-cytidine or 40mM ZEA respectively. These results suggest that
global DNA demethylation occurs when BEAS-2B cells are exposed to ZEA.
Discussion
The aim of this study is to decipher the toxic effects and molecular mechanisms induced by ZEA in human bronchial epithelial cells (BEAS-2B). Our experiments and biological interpretation of the genome-wide transcriptome analysis indicat-ed that induction of oxidative stress, arrest of cell cycle progression, initiation of apoptosis, suppression of inflammatory
responses and changes of epigenetic marks are the consequences of exposure to ZEA.
Induction of oxidative stress by ZEA
The broad range of toxic events provoked by ZEA is believed not solely due to the interaction with estrogen receptors but also through the induction of oxidative stress. Our results indicated that the Keap1-Nrf2 pathway was suppressed (Table 3), as the levels of intracellular ROS was increased (Figure 4A) and the expression of free radical scavengers, SOD2 and catalase, were up-regulated (Figure 4D and E) after ZEA treatment. Nrf2 is a transcription factor that binds to the antioxidant responsive element at the regulatory region of target genes that confer protection against oxidative stress [23]. Nrf2 is normally seques-tered and inhibited at the cytoplasm by Keap1. However, under stress conditions, Nrf2 dissociates from Keap1 and translocates to the nucleus to control gene expression [23]. The expression of Figure 5. Induction of apoptosis in BEAS-2B cells by ZEA.Early apoptotic cells stained with Annexin V are shown in lower right quadrant. Late apoptotic or necrotic cells are stained with both Annexin V and PI and are shown in upper right quadrant. Living cells are not stained and are shown in lower left quadrant. (A) 24 h wild type control. (B) 24 h wild type ZEA-treated. (C) 48 h wild type control. (D) 48 h wild type ZEA-treated. (E) 24 h CYGB over-expressed control. (F) 24 h CYGB over-expressed treated. (G) 48 h CYGB over-expressed control. (H) 48 h CYGB over-expressed ZEA-treated.
doi:10.1371/journal.pone.0096404.g005
Figure 6. Quantitative PCR showing mRNA expression of inflammatory cytokines and chemokines in LPS stimulated BEAS-2B cells.
The mRNA expression ofb–actin was used for normalization. (A) Interleukin 6 (IL-6). (B) Interleukin 8 (IL-8). (C) Interleukin 1, beta (IL-1b). Results represent the mean6SD of at least 3 independent experiments and bars with different alphabets show significant differences (One-way ANOVA,p,
0.05).
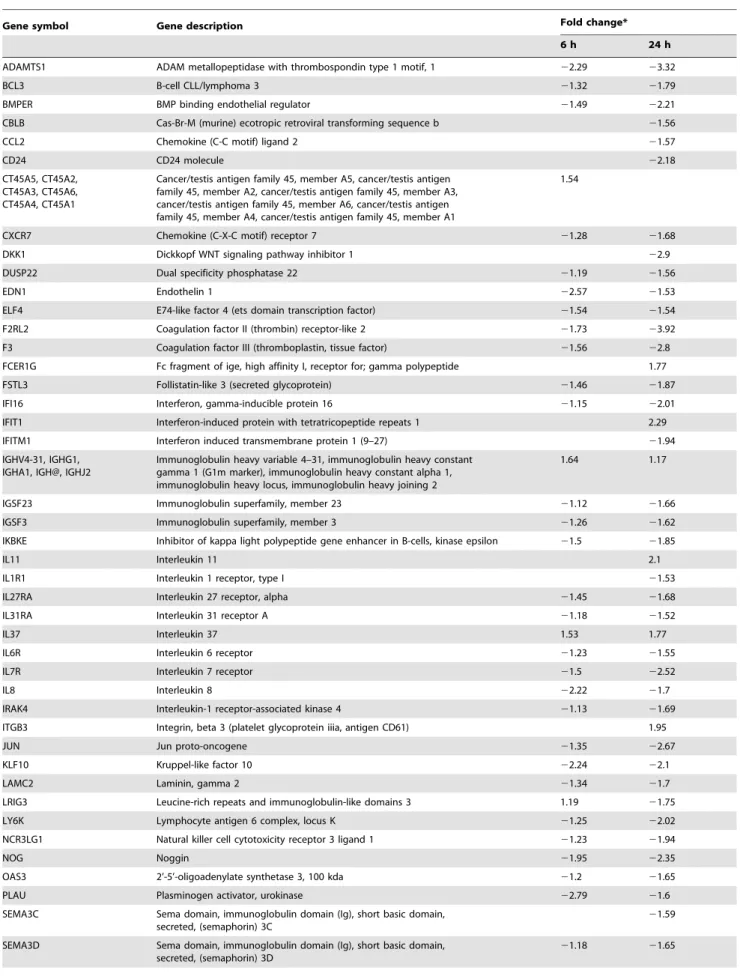
Table 7.Differentially expressed genes related to inflammatory responses.
Gene symbol Gene description Fold change*
6 h 24 h
ADAMTS1 ADAM metallopeptidase with thrombospondin type 1 motif, 1 22.29 23.32
BCL3 B-cell CLL/lymphoma 3 21.32 21.79
BMPER BMP binding endothelial regulator 21.49 22.21
CBLB Cas-Br-M (murine) ecotropic retroviral transforming sequence b 21.56
CCL2 Chemokine (C-C motif) ligand 2 21.57
CD24 CD24 molecule 22.18
CT45A5, CT45A2, CT45A3, CT45A6, CT45A4, CT45A1
Cancer/testis antigen family 45, member A5, cancer/testis antigen family 45, member A2, cancer/testis antigen family 45, member A3, cancer/testis antigen family 45, member A6, cancer/testis antigen family 45, member A4, cancer/testis antigen family 45, member A1
1.54
CXCR7 Chemokine (C-X-C motif) receptor 7 21.28 21.68
DKK1 Dickkopf WNT signaling pathway inhibitor 1 22.9
DUSP22 Dual specificity phosphatase 22 21.19 21.56
EDN1 Endothelin 1 22.57 21.53
ELF4 E74-like factor 4 (ets domain transcription factor) 21.54 21.54
F2RL2 Coagulation factor II (thrombin) receptor-like 2 21.73 23.92
F3 Coagulation factor III (thromboplastin, tissue factor) 21.56 22.8 FCER1G Fc fragment of ige, high affinity I, receptor for; gamma polypeptide 1.77
FSTL3 Follistatin-like 3 (secreted glycoprotein) 21.46 21.87
IFI16 Interferon, gamma-inducible protein 16 21.15 22.01
IFIT1 Interferon-induced protein with tetratricopeptide repeats 1 2.29
IFITM1 Interferon induced transmembrane protein 1 (9–27) 21.94
IGHV4-31, IGHG1, IGHA1, IGH@, IGHJ2
Immunoglobulin heavy variable 4–31, immunoglobulin heavy constant gamma 1 (G1m marker), immunoglobulin heavy constant alpha 1, immunoglobulin heavy locus, immunoglobulin heavy joining 2
1.64 1.17
IGSF23 Immunoglobulin superfamily, member 23 21.12 21.66
IGSF3 Immunoglobulin superfamily, member 3 21.26 21.62
IKBKE Inhibitor of kappa light polypeptide gene enhancer in B-cells, kinase epsilon 21.5 21.85
IL11 Interleukin 11 2.1
IL1R1 Interleukin 1 receptor, type I 21.53
IL27RA Interleukin 27 receptor, alpha 21.45 21.68
IL31RA Interleukin 31 receptor A 21.18 21.52
IL37 Interleukin 37 1.53 1.77
IL6R Interleukin 6 receptor 21.23 21.55
IL7R Interleukin 7 receptor 21.5 22.52
IL8 Interleukin 8 22.22 21.7
IRAK4 Interleukin-1 receptor-associated kinase 4 21.13 21.69
ITGB3 Integrin, beta 3 (platelet glycoprotein iiia, antigen CD61) 1.95
JUN Jun proto-oncogene 21.35 22.67
KLF10 Kruppel-like factor 10 22.24 22.1
LAMC2 Laminin, gamma 2 21.34 21.7
LRIG3 Leucine-rich repeats and immunoglobulin-like domains 3 1.19 21.75
LY6K Lymphocyte antigen 6 complex, locus K 21.25 22.02
NCR3LG1 Natural killer cell cytotoxicity receptor 3 ligand 1 21.23 21.94
NOG Noggin 21.95 22.35
OAS3 2’-5’-oligoadenylate synthetase 3, 100 kda 21.2 21.65
PLAU Plasminogen activator, urokinase 22.79 21.6
SEMA3C Sema domain, immunoglobulin domain (Ig), short basic domain, secreted, (semaphorin) 3C
21.59
SEMA3D Sema domain, immunoglobulin domain (Ig), short basic domain, secreted, (semaphorin) 3D
SOD2 and catalase are up-regulated under oxidative stress by the binding of Nrf2 to their promoters [24]. In addition, our results show dramatic up-regulation of heat shock proteins, which are early markers of oxidative stress [25,26].
On the other hand, the generation of ROS (Figure 4A) and the induction of apoptosis (Figure 5) were significantly attenuated by the over expression of CYGB, a potent free radical scavenger. Collectively, our results suggest that ZEA is a strong inducer of ROS and oxidative stress is the underlying mediator of ZEA-induced cytotoxicity. These observations substantiate early reports showing that exogenous antioxidants including vitamin E and Tunisian radish protect against ZEA-induced oxidative damage and subsequent apoptosis [27,28].
The mechanism by which ZEA induces production of ROS is ambiguous. It is known that upon metabolism of ZEA, 3a-/3b -hydroxysteroid dehydrogenases catalyze the formation of two major reductive metabolites,a– andb-Zearalenol [29]. Pfeiffer et al [30] identified two highly unstable oxidative metabolites of ZEA, 13-hydroxy-ZEA and 15-hydroxy ZEA, which are demon-strated to possess the same potency for causing oxidative DNA damage (as measured by the level of 8-oxo-29-deoxyguanosine of DNA) as catechols of estradiols [31]. Therefore, we believe that ROS could be generated during the formation of these metabo-lites. In addition, ROS may be generated due to the alteration of mitochondrial NADPH-oxidase which functions to generate superoxide anions (O22) from normal oxygen [32]. Our array results support this supposition as the expression of NADPH-oxidase (NOX5) is up-regulated by 1.32 and 1.6 fold upon 6 and 24 h exposure to ZEA (Table S2 and S3).
DNA damages and inhibition of DNA repair by ZEA
Excessive generation of ROS can oxidize cellular macromole-cules including DNA, protein and lipids. The ability of ZEA to cause oxidative DNA damage including DNA fragmentation, single- and double stranded breakage as well as formation of 8-oxoguanine were reported [9,27,33]. Our microarray results also signified the suppression of DNA repair and induction of DNA damage (Table 3 and 5). The expression of breast cancer 1, early onset (BRCA1), RAD51, bloom syndrome, RecQ helicase-like (BLM), flap-endonuclease 1 (FEN1), uracil-DNA glycosylase (UNG), damage-specific DNA binding protein 2 (DDB2) and exonuclease 1 (EXO1) were significantly suppressed after 24 h ZEA treatment (Table 5).
BRCA1 functions in response to the signal of DNA damage and transcriptionally control downstream effectors [34,35]. RAD51 and BLM are involved in the repair of DNA double-strand break through homologous recombination [36,37]. BRCA1 and RAD51
also interact to control recombination and maintain the integrity of the genome [38]. FEN1 [39], UNG [40], DDB2 [41] and EXO1 [42] are involved in DNA base-excision repair, DNA mismatch repair and homologous recombination. On the other hand, DNA-damage-inducible transcript 4 (DDIT4) and never in mitosis gene a-related kinase 2 (NEK2) which are involved in controlling DNA damage checkpoint and proper DNA repair, are significantly induced by 2.62 and 2.17 folds respectively after 24 h ZEA treatment (Table 5). Our transcriptome analysis suggested that ZEA inhibited DNA repair and induced DNA damages.
Our microarray data also revealed that the progression of cell cycle and replication of DNA in BEAS-2B cells was suppressed by ZEA (Table 4 and 5). The expressions of cyclin E (CCNE1, CCNE2), which are essential for S phase progression, are significantly down-regulated by 2.11 and 2.93 folds respectively while p21 activated kinase 3 (PAK3), a known inhibitor of Cdk4, is simultaneously induced by 1.91 folds after 24 h of ZEA treatment. These observations suggest that cyclinD/cdk4 and cyclinE/cdk2 complexes which are essential for G1/S cell cycle progression have been suppressed.
Arrest of cell cycle by ZEA
In addition, many genes related to DNA replication, which are also essential for S phase progression, are down-regulated after 24 h of ZEA treatment (Table 5). The essential components of the pre-replicative complex (pre-RC) including origin recognition complex, subunit 1 (ORC1), cell division cycle 6 (CDC6) and most member of minichromosome maintenance protein (MCM 2–7) show decreased levels of expression (Table 5). In addition, the assembly and activation complex comprising MCM 10, CDC45, replication factor C (activator 1) 2 (RFC2) and interaction with subunits of replicative polymerase, including polymerase (DNA directed), alpha 1 (POLA1), polymerase (DNA directed), epsilon 2 (POLE2) and primase, DNA, polypeptide 1 (PRIM1), are also down-regulated (Table 5). DNA helicase B (HELB), which is involved in DNA synthesis, is down-regulated by 1.78 folds (Table 5). From the above results, it can be concluded that ZEA directly affects the machinery for DNA replication and synthesis in BEAS-2B cells.
Taken together, it is tempting to speculate that ZEA induces DNA damage and halts cell cycle at G1/S phase as attempts to repair the damage are unsuccessful. These findings are in agreement with earlier studies which reported that ZEA induced DNA fragmentation and cell cycle arrest [27,33]. The presence of irreparable DNA lesions may lead to the occurrence of subsequent apoptosis in the affected cells (Figure 9).
Table 7.Cont.
Gene symbol Gene description Fold change*
6 h 24 h
SMAD6 SMAD family member 6 22 22.4
SMAD7 SMAD family member 7 22.24 22.51
SMAD9 SMAD family member 9 21.5 21.58
TGFB2 Transforming growth factor, beta 2 21.2 21.75
TGFBR1 Transforming growth factor, beta receptor 1 21.51
TNFAIP8L1 Tumor necrosis factor, alpha-induced protein 8-like 1 1.88
Down-regulation of inflammatory responses by ZEA
Due to the large surface structure of the lung, its innate immune response is essential as the first line of defense to act against environmental particles, allergens and invasion of pathogens. The responses often include production of cytokines and chemokines to recruit inflammatory effector cells such as macrophages, neutro-phils, eosinophils and lymphocytes [43]. Our results indicated that ZEA weakened the innate immune response to bacterial pathogens (LPS) in bronchial epithelial cells through down-regulating the expression of various inflammatory genes (Figure 6 and Table 7). The mechanism of this down-regulation is possibly through the inhibition of the toll-like receptor (TLR) signaling pathway (Table 3). TLR is a cell surface member of the pattern recognition receptors (PRRs) which are essential as first line defense of the host’s responses to allergens and pathogens [44,45]. IL-1 receptor-associated kinase 4 (IRAK4) is an intrinsic kinase which mediates inhibition of IL-1/TLR induced NF-kB activation [44]. Upon activation and stimulation of TLRs, association of MyD88 recruits IRAK4 which in turn induces the phosphoryla-tion of IRAK1 and triggers downstream activaphosphoryla-tion of NF-kB [44]. In our microarray results, the expression of both MyD88 and IRAK4 are respectively down-regulated by 1.45 and 1.69 folds, pointing to the upstream suppression of TLR signaling and subsequent activation of NF-kB.
Both suppressive and inductive effects of ZEA on inflammatory responses have been reported [46,47,48] albeit with different models, dosage and duration of incubation with ZEA. Oxidative stress could trigger inflammation signals through activation of transcription regulators, NF-kB and AP-1 [49]. In our results, however, ZEA induced ROS generations but suppressed inflam-matory responses. These observations could be explained by the suppression of NF-kB activation through inhibition of the TLR signaling Myd88-dependent pathway as aforementioned. The finding is consistent with earlier proteomic study in H295R cells showing possible suppression of NF-kB pathway after ZEA exposure [50]. Importantly, our results also indicate that the expressions of JUN, FOSL1 and ATF3 which form the AP-1 transcription complex are significantly decreased (Table 7) suggesting that the AP-1 activation is possibly inhibited by ZEA.
These observations suggested that exposure to air-borne ZEA may increase susceptibility of bronchial epithelial cells to infections due to down-regulation of the expression of inflammatory cytokines and chemokines.
Potential epigenetic changes by ZEA
On the other hand, GSEA of the array results indicated that the histone deacetylation pathway is altered (Figure 3). Histone deacetlyation is associated with pathogenesis of lung diseases. For example, in COPD, the progressive reduction of HDAC activity is linked to the severity of the disease [51,52,53]. Methylated promoters are often coupled with regional histone deacetylation and contribute to transcriptional inactivation. Global hypomethylation was also observed in BEAS-2B cells incubated with ZEA (Figure 8). Possibly, the presence of 8-OHdG [54,55] and O6-methylguanine formed during ROS-induced DNA damage prevented the methylation of adjacent cytosine residues [56,57,58]. Disturbingly, global DNA hypomethylation is a feature of tumorigenesis [59,60]. The role of DNA hypomethy-lation in the development of cancer is still a paradox. Demeth-ylation of DNA usually occurs at intragenic regions and at repetitive DNA sequences. Three mechanisms including causing instability of chromosome, reactivation of transposable elements and loss of imprinting are proposed [60]. More importantly, altered DNA methylation levels can be stably inherited during DNA replication and disturb subsequent generations. Our results raised the concern on long-lasting effect of ZEA to lung cells which required further investigation.
Figure 7. Validation of the expressions of selected genes by real-time PCR.(A) 6 hr. (B) 24 hr. Real-time PCR results are represented as mean6SD of at least 3 independent experiments
doi:10.1371/journal.pone.0096404.g007
Figure 8. Induction of global DNA demethylation in BEAS-2B cells by exposure to ZEA for 24 h.Results represent the mean6SD of at least 3 independent experiments and ** represents p,0.01 significantly different from DMSO control values as assessed by t-test. doi:10.1371/journal.pone.0096404.g008
Figure 9. Proposed mechanisms of apoptosis induced by ZEA in BEAS-2B cells.The expression changes of genes associated with the biological processes are indicated.
Conclusions
Our results clearly pointed out the diverse biological responses that ensued when BEAS-2B lung epithelial cells are exposure to ZEA. It also gives us an insight into the molecular mechanisms underlying the adverse consequences of air-borne ZEA. Disturb-ingly, our results suggested that exposure to ZEA may increase susceptibility of bronchial epithelial cells to diseases through i) the down-regulation of inflammatory cytokines and ii) demethylation of DNA which is a feature of lung carcinogenesis.
Supporting Information
Table S1 Primers used for real-time quantitative PCR.
(DOCX)
Table S2 The complete list of differentially expressed genes (fold change.1.5, ANOVA p-value,0.05) in BEAS-2B cells after 6 h treatment.
(DOCX)
Table S3 The complete list of differentially expressed genes (fold change.1.5, ANOVA p-value,0.05) in BEAS-2B cells after 24 h treatment.
(DOCX)
Table S4 Summary of the enriched gene ontology (GO) terms in BEAS-2B cells after 6 h treatment with ZEA.
(DOCX)
Table S5 Summary of the enriched gene ontology (GO) terms in BEAS-2B cells after 24 h treatment with ZEA.
(DOCX)
Table S6 Pathways enriched in BEAS-2B cells after 24 h treatment with ZEA.
(DOC)
Acknowledgments
The work was supported by the Seed Funding Programme for Basic Research and CRCG grants for postgraduate students of the University of Hong Kong as well as funding from HKU School of Professional and Continuing Education (SPACE).
Author Contributions
Conceived and designed the experiments: KCT. Performed the experi-ments: MYS YSP SS MNA. Analyzed the data: MYS YSP ZPT JWZ RW KCT. Contributed reagents/materials/analysis tools: MNA RW KCT. Wrote the paper: MYS KCT. Supervised: RW KCT.
References
1. Caldwell RW, Tuite J, Stob M, Baldwin R (1970) Zearalenone production by Fusarium species. Applied microbiology 20: 31–34.
2. Sweeney MJ, Dobson ADW (1998) Mycotoxin production by Aspergillus, Fusarium and Penicillium species. Int J Food Microbiol 43: 141–158. 3. Zinedine A, Soriano JM, Molto JC, Ma es J (2007) Review on the toxicity,
occurrence, metabolism, detoxification, regulations and intake of zearalenone: An oestrogenic mycotoxin. Food Chem Toxicol 45: 1–18.
4. Chang K, Kurtz HJ, Mirocha CJ (1979) Effects of the mycotoxin zearalenone on swine reproduction. Am J Vet Res 40: 1260.
5. Minervini F, Giannoccaro A, Cavallini A, Visconti A (2005) Investigations on cellular proliferation induced by zearalenone and its derivatives in relation to the estrogenic parameters. Toxicol Lett 159: 272–283.
6. Ruzsas C, Biro-Gosztonyi M, Wo¨ller L, Mess B (1979) Effect of the fungal toxin (zearalenone) on the reproductive system and fertility of male and female rats. Acta Biol Acad Sci Hung 30: 335.
7. Sheehan DM, Branham WS, Medlock KL, Shanmugasundaram ERB (1984) Estrogenic activity of zearalenone and zearalanol in the neonatal rat uterus. Teratology 29: 383–392.
8. Abid-Essefi S, Zaied C, Bouaziz C, Salem IB, Kaderi R, et al. (2011) Protective effect of aqueous extract of Allium sativum against zearalenone toxicity mediated by oxidative stress. Exp Toxicol Pathol 64: 689–695.
9. Hassen W, Ayed-Boussema I, Oscoz AA, De Cerain Lopez A, Bacha H (2007) The role of oxidative stress in zearalenone-mediated toxicity in Hep G2 cells: Oxidative DNA damage, gluthatione depletion and stress proteins induction. Toxicology 232: 294–302.
10. Salah-Abbes JB, Abbes S, Ouanes Z, Houas Z, Abdel-Wahhab MA, et al. (2008) Tunisian radish extract (Raphanus sativus) enhances the antioxidant status and protects against oxidative stress induced by zearalenone in Balb/c mice. J Appl Toxicol 28: 6–14.
11. Dornbusch HJ, Buzina W, Summerbell RC, Lass-Flo¨rl C, Lackner H, et al. (2005) Fusarium verticillioides abscess of the nasal septum in an immunosup-pressed child: case report and identification of the morphologically atypical fungal strain. J Clin Microbiol 43: 1998–2001.
12. Yan X, Yu C, Shi Z, Wang S, Zhang F (2013) Nasal Cutaneous Infection in a healthy boy caused by Fusarium moniliforme. Pediatr Dermatol 30: e43–45. 13. Tangni EK, Pussemier L (2007) Ergosterol and mycotoxins in grain dusts from
fourteen Belgian cereal storages: A preliminary screening survey. J Sci Food Agric 87: 1263–1270.
14. Wang Y, Chai T, Lu G, Quan C, Duan H, et al. (2008) Simultaneous detection of airborne Aflatoxin, Ochratoxin and Zearalenone in a poultry house by immunoaffinity clean-up and high-performance liquid chromatography. Env Res 107: 139–144.
15. Ma´rquez-Garba´n DC, Chen H-W, Fishbein MC, Goodglick L, Pietras RJ (2007) Estrogen receptor signaling pathways in human non-small cell lung cancer. Steroids 72: 135–143.
16. Siegfried JM (2001) Women and lung cancer: does oestrogen play a role? Lancet Oncol 2: 506.
17. Cavalieri E, Rogan E (2006) Catechol quinones of estrogens in the initiation of breast, prostate, and other human cancers. Ann N Y Acad Sci 1089: 286–301.
18. Tam A, Morrish D, Wadsworth S, Dorscheid D, Man SP, et al. (2011) The role of female hormones on lung function in chronic lung diseases. BMC Womens Health 11: 24.
19. Reddel RR, Ke Y, Gerwin BI, McMenamin MG, Lechner JF, et al. (1988) Transformation of human bronchial epithelial cells by infection with SV40 or adenovirus-12 SV40 hybrid virus, or transfection via strontium phosphate coprecipitation with a plasmid containing SV40 early region genes. Cancer Res 48: 1904–1909.
20. Ruiz C, Huang W, Hegi ME, Lange K, Hamou M-F, et al. (2004) Differential gene expression analysis reveals activation of growth promoting signaling pathways by tenascin-C. Cancer Res 64: 7377–7385.
21. Senese S, Zaragoza K, Minardi S, Muradore I, Ronzoni S, et al. (2007) Role for histone deacetylase 1 in human tumor cell proliferation. Mol Cell Biol 27: 4784– 4795.
22. Stein RA, Chang C-y, Kazmin DA, Way J, Schroeder T, et al. (2008) Estrogen-Related ReceptoraIs Critical for the Growth of Estrogen Receptor–Negative Breast Cancer. Cancer Res 68: 8805–8812.
23. Itoh K, Chiba T, Takahashi S, Ishii T, Igarashi K, et al. (1997) An Nrf2/small Maf heterodimer mediates the induction of phase II detoxifying enzyme genes through antioxidant response elements. Biochem Biophys Res Commun 236: 313–322.
24. Numazawa S, Yoshida T (2004) Nrf2-dependent gene expressions: a molecular toxicological aspect. J Toxicol Sci 29: 81–89.
25. Arrigo AP, Firdaus WJJ, Mellier G, Moulin M, Paul C, et al. (2005) Cytotoxic effects induced by oxidative stress in cultured mammalian cells and protection provided by Hsp27 expression. Methods 35: 126–138.
26. Kiang JG, Tsokos GC (1998) Heat Shock Protein 70 kDa* 1:: Molecular Biology, Biochemistry, and Physiology. Pharmacol Ther 80: 183–201. 27. Abid-Essefi S, Baudrimont I, Hassen W, Ouanes Z, Mobio TA, et al. (2003)
DNA fragmentation, apoptosis and cell cycle arrest induced by zearalenone in cultured DOK, Vero and Caco-2 cells: prevention by Vitamin E. Toxicology 192: 237–248.
28. Salah-Abbe`s JB, Abbe`s S, Abdel-Wahhab MA, Oueslati R (2010) In-vitro free radical scavenging, antiproliferative and anti-zearalenone cytotoxic effects of 4-(methylthio) -3-butenyl isothiocyanate from Tunisian Raphanus sativus. J Pharm Pharmacol 62: 231–239.
29. Olsen M (1989) Metabolism of zearalenone in farm animals. Topics in Secondary Metabolism.
30. Pfeiffer E, Hildebrand A, Damm G, Rapp A, Cramer B, et al. (2009) Aromatic hydroxylation is a major metabolic pathway of the mycotoxin zearalenone in vitro. Mol Nutr Food Res 53: 1123–1133.
31. Fleck SC, Hildebrand AA, Mu¨ller E, Pfeiffer E, Metzler M (2012) Genotoxicity and inactivation of catechol metabolites of the mycotoxin zearalenone. Mycotoxin Res 28: 267–273.
32. Babior BM (1999) NADPH oxidase: an update. Blood 93: 1464–1476. 33. Abid-Essefi S, Ouanes Z, Hassen W, Baudrimont I, Creppy E, et al. (2004)
Cytotoxicity, inhibition of DNA and protein syntheses and oxidative damage in cultured cells exposed to zearalenone. Toxicol In Vitro 18: 467–474. 34. Venkitaraman AR (2002) Cancer susceptibility and the functions of BRCA1 and
35. Xu B, Kim S-t, Kastan MB (2001) Involvement of Brca1 in S-phase and G2-phase checkpoints after ionizing irradiation. Mol Cell Biol 21: 3445–3450. 36. Baumann P, Benson FE, West SC (1996) Human Rad51 protein promotes
ATP-dependent homologous pairing and strand transfer reactions in vitro. Cell 87: 757–766.
37. Sung P, Robberson DL (1995) DNA strand exchange mediated by a RAD51-ssDNA nucleoprotein filament with polarity opposite to that of RecA. Cell 82: 453–461.
38. Scully R, Chen J, Plug A, Xiao Y, Weaver D, et al. (1997) Association of BRCA1 with Rad51 in mitotic and meiotic cells. Cell 88: 265–275.
39. Klungland A, Lindahl T (1997) Second pathway for completion of human DNA base excision-repair: reconstitution with purified proteins and requirement for DNase IV (FEN1). EMBO J 16: 3341–3348.
40. Rada C, Williams GT, Nilsen H, Barnes DE, Lindahl T, et al. (2002) Immunoglobulin isotype switching is inhibited and somatic hypermutation perturbed in UNG-deficient mice. Curr Biol 12: 1748–1755.
41. Fitch ME, Nakajima S, Yasui A, Ford JM (2003) In vivo recruitment of XPC to UV-induced cyclobutane pyrimidine dimers by the DDB2 gene product. J Biol Chem 278: 46906–46910.
42. Tran PT, Erdeniz N, Symington LS, Liskay RM (2004) EXO1-A multi-tasking eukaryotic nuclease. DNA repair (Amst) 3: 1549–1559.
43. Schmal H, Shanley TP, Jones ML, Friedl HP, Ward PA (1996) Role for macrophage inflammatory protein-2 in lipopolysaccharide-induced lung injury in rats. J Immunol 156: 1963–1972.
44. Akira S, Takeda K (2004) Toll-like receptor signalling. Nat Rev Immunol 4: 499–511.
45. Barton GM, Medzhitov R (2003) Toll-like receptor signaling pathways. Science 300: 1524–1525.
46. Marin DE, Taranu I, Burlacu R, Tudor DS (2010) Effects of zearalenone and its derivatives on the innate immune response of swine. Toxicon 56: 956–963. 47. Ruh MF, Bi Y, Cox L, Berk D, Howlett AC, et al. (1998) Effect of environmental
estrogens on IL-1bpromoter activity in a macrophage cell line. Endocrine 9: 207–211.
48. Salah-Abbe`s JB, Abbe`s S, Houas Z, Abdel-Wahhab MA, Oueslati R (2008) Zearalenone induces immunotoxicity in mice: possible protective effects of radish extract (Raphanus sativus). J Pharm Pharmacol 60: 761–770.
49. Zhou L, Tan A, Iasvovskaia S, Li J, Lin A, et al. (2003) Ras and Mitogen-Activated Protein Kinase Kinase Kinase-1 Coregulate Activator Protein-1–and Nuclear Factor-kB–Mediated Gene Expression in Airway Epithelial Cells. Am J Respir Cell Mol Biol 28: 762–769.
50. Busk ØL, Ndossi D, Verhaegen S, Connolly L, Eriksen G, et al. (2011) Relative quantification of the proteomic changes associated with the mycotoxin zearalenone in the H295R steroidogenesis model. Toxicon 58: 533–542. 51. Hogg JC, Chu F, Utokaparch S, Woods R, Elliott WM, et al. (2004) The nature
of small-airway obstruction in chronic obstructive pulmonary disease. N Engl J Med 350: 2645–2653.
52. Ito K, Ito M, Elliott WM, Cosio B, Caramori G, et al. (2005) Decreased histone deacetylase activity in chronic obstructive pulmonary disease. N Engl J Med 352: 1967–1976.
53. Barnes PJ (2006) Reduced histone deacetylase in COPD: clinical implications. Chest 129: 151–155.
54. Turk PW, Laayoun A, Smith SS, Weitzman SA (1995) DNA adduct 8-hydroxyl-29-deoxyguanosine (8-hydroxyguanine) affects function of human DNA methyltransferase. Carcinogenesis 16: 1253–1255.
55. Weitzman SA, Turk PW, Milkowski DH, Kozlowski K (1994) Free radical adducts induce alterations in DNA cytosine methylation. Proc Natl Acad Sci USA 91: 1261–1264.
56. Hepburn PA, Margison GP, Tisdale MJ (1991) Enzymatic methylation of cytosine in DNA is prevented by adjacent O6-methylguanine residues. J Biol Chem 266: 7985–7987.
57. Tan NW, Li BFL (1990) Interaction of oligonucleotides containing 6-O-methylguanine with human DNA (cytosine-5-)-methyltransferase. Biochemistry 29: 9234–9240.
58. Xiao W, Samson L (1993) In vivo evidence for endogenous DNA alkylation damage as a source of spontaneous mutation in eukaryotic cells. Proc Natl Acad Sci USA 90: 2117–2121.
59. Ehrlich M (2009) DNA hypomethylation in cancer cells.Epigenomics 1: 239– 259.
60. Ehrlich M (2002) DNA methylation in cancer: too much, but also too little. Oncogene 21: 5400–5413.