Computational modeling for predicting corrosion
initiation in reinforced concrete structures
Modelagem computacional para predição do período de
iniciação da corrosão em estruturas de concreto armado
Abstract
Resumo
This article presents a model for penetration of chloride by diffusion in reinforced concrete structures based on the solution of the Fick's 2nd Law, using the inite element method (FEM) in two-dimensional domain. This model predicts the time, in a given situation, so that a certain limit of chlorides for depassivation of reinforcement is reached, characterizing the end of service life. Several approaches for the chloride surface concen -tration and for the diffusion coeficient are used, parameter which must be corrected due to the effects of temperature, solar radiation, exposure time, and relative humidity. Moreover, a parametric analysis is carried out in order to study the factors involved and their impact on the ingress of chlorides by diffusion, contributing to a better understanding of the phenomenon. In addition, the developed model is applied to the cities of Vitória (ES) and Florianópolis (SC) to analyze the service life for different concrete covers, making a comparison with the Brazilian standard.
Keywords: chlorides, corrosion, diffusion, inite element method, service life.
Este trabalho apresenta um modelo de penetração de cloretos por difusão em estruturas de concreto armado baseado na solução da 2ª Lei de Fick, utilizando o método dos elementos initos (MEF) no domínio bidimensional. Este modelo prevê o tempo necessário, em determinada situa -ção, para que um determinado limite de cloretos para a despassivação da armadura seja atingido, caracterizando o im da vida útil. Utilizam-se diversas abordagens para a concentração supericial de cloretos e para o coeiciente de difusão, parâmetro que deve ser corrigido devido aos efeitos da temperatura, da radiação solar, do tempo de exposição e da umidade relativa. Além do mais, é realizada análise paramétrica visando o estudo dos fatores intervenientes e seus impactos na penetração de cloretos por difusão, de modo a contribuir para uma maior compreensão do fenômeno. Ademais, o modelo desenvolvido é aplicado às cidades de Vitória (ES) e Florianópolis (SC) analisando-se a vida útil para diferentes cobrimentos de concreto, fazendo um paralelo com a norma brasileira.
Palavras-chave: cloretos, corrosão, difusão, método dos elementos initos, vida útil.
a Universidade Federal do Espírito Santo, Centro Tecnológico, Programa de Pós-Graduação em Engenharia Civil, Vitória, ES, Brasil.
Received: 29 Jun 2017 • Accepted: 13 Apr 2017 • Available Online: 11 Dec 2017
W. K. DOMINICINI a
J. L. CALMON a
1. Introduction
The current process of changing the paradigm of society in relation to the physical-ecological system gives strength to the theme of sustainable development and, consequently, the construction in -dustry is strongly affected, making the durability of constructions one of the most discussed subjects. Durable structures impact sustainability in two ways: through conservation of energy, raw materials and natural resources; and the reduction in the amount of waste generated. Not to mention the remarkable economic fac-tor, since it has great inluence on the cost of the life cycle. Several are the degradation factors of the reinforced concrete structures. However, special attention must be paid to the cor -rosion of the reinforcement, one of the most frequent problems and that generate higher costs of repair. Helene [1] provides an analysis of the economic importance of reinforcement corrosion in the world, with surveys in the United States and Spain on the incidence of pathological manifestations in concrete structures and their impacts. Skainy (1987) apud Helene [1] points out that in 1985 the volume of resources handled by civil construc -tion in the United States was $ 300 billion, with repair costs es -timated at $ 50 billion per year, about 16% of the total sector. In all the studies presented, corrosion was one of the pathologi-cal manifestations of higher incidence and higher repair costs. In Brazil, a similar situation is observed. Dal Molin [2], in a case study in the state of Rio Grande do Sul, points out that, even though the incidence of reinforced corrosion in the buildings stud-ied is about 11% of the total pathological manifestations found, when considering only the serious manifestations, with implica-tions for structural safety, this igure rises to 40%, with the highest incidence among them. Moreover, the author points out that the corrosion of reinforcement demands an immediate recovery and is usually expensive, since its permanence may represent a risk to the stability of the building.
Corrosion in reinforced concrete structures is an electrochemical process that requires the presence of an electrolyte, a potential
difference, and oxygen. However, the corrosion process will only begin once the reinforcement has been removed, that is, when the thin layer of oxides surrounding the reinforcement is broken [3]. The depassivation of the reinforcement occurs mainly due to two mechanisms: carbonation and chloride action. Although car-bonation corrosion occurs in a generalized way, the damage asso -ciated with it is usually manifested in the form of cracking and dis-placement of the cover before a signiicant reduction in the section of the bar has occurred. In the case of chloride action, an extreme loss of the sectional area of the reinforcement can be reached be-fore any other form of deterioration can be detected. This is the most studied mechanism of corrosion and the one that causes greater damages.
In the corrosion by chloride attack an accumulation of chloride ions occurs in the pore solution in the area of the reinforcement until, upon reaching a critical amount, there is a localized break of the passivating layer [3]. Among the most common sources of chloride contamination in the concrete are contaminated additives or ag -gregates and the penetration of de-icing salts or seawater solu-tions through the cover, which acts as a physical protection, mak -ing it dificult for external aggressive agents to enter [4].
The durability of the structures is intrinsically linked to the concept of service life. Among the various deinitions, stands out the one presented by Andrade [5], who considers service life as “the one during which the structure preserves all the minimal characteristics of functionality, resistance and external aspects required”.
A simpliied model for the service life associated with corrosion was proposed by Tuutti [6] and has since been used by practically all the studies. In this study, the corrosion process is divided into two stages (Figure 1). The initiation period, which includes the period of time until the depassivation of the reinforcement, is usually the lon -gest period and, in the case of chloride action, its duration depends on the rate of penetration of chloride ions in the concrete, the depth of the concrete cover and concentration of chlorides. The propaga -tion period is considered as the time between depassiva-tion of the steel rebar, when the corrosion process starts, and the moment when an unacceptable degree of corrosion is reached, marking the end of the service life. This period is considerably shorter and its prediction is rather complex due to the number of intervening fac -tors and the dificulty of obtaining precise input parameters. Thus, it is common to regard the end of the initiation period as the end of service life.
The Brazilian standard NBR 6118 [7] still addresses the durability in a qualitative way, specifying minimum concrete cover and mini -mum qualities of cover concrete to ensure service life. This stan -dard is based on previous results, not providing information on the service life of structures. However, greater knowledge about the transport mechanisms of liquids, gases and ions in the concrete, makes it possible to associate time with mathematical models that quantitatively express these mechanisms. Thus, deterministic methods allow the evaluation of the service life expressed in num -ber of years and no longer in only qualitative criteria of adequacy of the structure to a certain degree of exposure [8].
Consequently, there is an effort to mathematically model the phe -nomenon of reinforcement corrosion, allowing the estimation of service life of reinforced concrete structures in order to adequate -ly guide the maintenance activities and to design based on the
Figure 1
Simpliied model for service life associated
to corrosion
durability, not only on the mechanic strength and structural safety. Although it has been a much studied subject since the 70’s, there are many gaps in the knowledge of the processes of corrosion of reinforcements. A considerable amount of service life predic -tion models has already been developed. However, the existence of a large number of intervening factors, the lack of a precise understanding about the physical models that cover these fac -tors and the dificulty in obtaining exact input parameters, of real structures and over long periods, are enormous obstacles found in their modeling [9]. Thus, there is still no widely accepted ap-proach, and these models have not yet been able to effectively reach the market.
Therefore, this study presents a diffusion chloride penetration model in reinforced concrete structures using the inite element method (FEM) in the two-dimensional domain. This model fore -sees the time required, in a given situation, so that a certain limit of chlorides for the depassivation of the reinforcement is reached. This study will contribute to the understanding of the phenomenon of corrosion in concrete structures, as well as to serve as a basis for the development of increasingly accurate future models for the reproduction of reality. Moreover, a parametric analysis is carried out aiming at the study of the intervening factors and their impacts on the penetration of chlorides by diffusion, in order to contribute to a better understanding of the phenomena involved. Also, the de -veloped model is applied to the city of Vitória (ES) and Florianópo -lis (SC), using the local climatic parameters to analyze the service life for different concrete covers.
2. Chloride difusion model
This section provides an overview of the software developed and presents the model used. The program was developed us -ing Object-Pascal (Delphi® 7.0); an object-oriented language in the Windows® environment and it is based on the inite element method (FEM) in the two-dimensional domain. Free external soft -ware (GMSH1) is used for the generation of meshes. However, all
the rest of the procedures are performed by the software program itself, through a user-friendly interface (Figure 2) and data entry windows that allow the manipulation of all parameters considered. The program was developed based on Tavares [10], with the inser -tion of different models for surface concentra-tion and the imple-mentation of the inluence of solar radiation and skin effect. This study presents a model of penetration of chlorides in struc-tures of reinforced concrete by diffusion based on the solution of Fick’s 2nd Law (Equation 1).
(1)
Where C is the concentration of chlorides, t the time, x and y is the spatial coordinates and D is the apparent diffusion coeficient of chlorides.
This model foresees the evolution of the chloride concentration over time, as well as the time required, in a given situation, so that the chlo -ride limit for the depassivation of the reinforcement is reached. Several approaches are used for the supericial concentration of chlorides and
Figure 2
Interface of software developed
for the estimation of the diffusion coeficient, a parameter that must be corrected due to effects of temperature, time of exposure and relative humidity, in order to estimate the service life of the part studied.
2.1 Difusion coeicient
Several studies show that the assumption suggested by Crank [11], in which the diffusion coeficient is constant, is not correct [12, 13]. This variation in time leads to large implications for long-term predictions of chloride penetration and thus a constant value can lead to serious errors [12]. Thus, the software developed in this study allows, besides the choice of a constant diffusion coeficient, the consideration of the effect of temperature, solar radiation, rela-tive humidity, time of exposure and skin effect.
The diffusion coeficient is determined from a reference coeficient, measured in the laboratory and inluenced by several internal pa -rameters, such as concrete mix design, cure and composition of the concrete, multiplied by a series of functions, used to model the inluence of cement hydration and of the environment where the concrete is located (Equation 2).
(2)
Where Dc, ref is the reference diffusion coeficient, measured at the speciied temperature and time, f1 (T) considers the inluence of temperature and solar radiation, f2 (t) of the degree of hydration and f3 (h) of the relative humidity of pores.
2.1.1 Efect of temperature
The effect of temperature on the diffusion coeficient is estimated by the Arrhenius equation (Equation 3), which expresses the varia -tion of a chemical reac-tion with temperature.
(3)
Where U is the activation energy of the chlorides diffusion process (kJ/mol), R is the gas constant (kJ/K mol), Tref is the reference temperature at which the diffusion coeficient was measured (K), and T is the temperature in the concrete (K). The thermal sensitiv -ity of a reaction is indicated by the activation energy, which is the amount of energy required for a reaction to occur. Page et al. [14] suggests values for diffusion activation energy in cement pastes of (41.8 + - 4.0) kJ / mol, (44.6 + - 4.3) kJ / mol and (32.0 + - 2.4) kJ / mol for water/cement ratios of 0.4, 0.5 and 0.6, respectively. In order to mathematically model the temperature variation in the concrete, the developed software uses a sinusoidal function. Equation 4, deined from the annual maximum temperature (Tmax),
the annual minimum temperature (Tmin) and the day on which the highest temperature occurs (daymax), determines the temperature (T) for a given day of the year (t).
(4)
2.1.2 Efect of solar radiation
The radiation emitted by the sun and incident in the Earth’s atmo -sphere causes an increase in temperature in the structures. This variation has a direct inluence on the diffusion coeficient of chlo -rides. Despite this inluence, this is still a subject little addressed and its consideration is an innovation presented in this model. The solar radiation is considered in the multiplicative function f1 (T) (Equation 3) from an increase in the external temperature. In the absence of speciic measurements of solar radiation for a given location, the data present in the Solarimetric Atlas of Brazil can be used [15]. These data refer to the daily global solar ra-diation on a monthly average received by a horizontal surface for each month. According to the available data, the total daily solar radiation on a sloping surface is obtained from the global radia-tion on a horizontal surface. To do this, one must know the direct and diffuse components of the radiation on the horizontal surface. The direct radiation is the one received from the sun without being dispersed by the atmosphere and the diffuse radiation is the one received from the sun after its direction has been altered by the atmosphere [16].
The method proposed by Liu and Jordan (1963, 1967) apud Agullo [17], allows estimating the daily diffuse radiation, Hd, from the daily global radiation on monthly average, H0, according to Equation 5.
(5)
Where, KT is the average monthly cloudiness index, deined by the
ratio between daily global radiation, monthly average, H0 and solar
extraterrestrial radiation, monthly average, He (Equation 7). The
method for obtaining the daily solar radiation on a sloped surface presented below is used by Agullo [17] and is also described by Dufie and Beckman [16].
(6)
Extraterrestrial solar radiation can be found by the expression:
(7)
In which:
r²: correction factor of the solar constant for each day of the year (Equation 8);
ISC: solar constant ISC = 4870.8 KJ / hm²; φ: surface latitude;
δ: solar declination;
hS: module of the hour angle corresponding to the sunset (radians).
(8)
sun in relation to the plane of the equator, positive north (-23.45° ≤ δ ≤ 23.45 °); The time angle (h) is the angular displacement of the sun to the east or west of the local meridian due to the rotation of the Earth on its axis at 15° per hour (360° in 24 hours) - being zero when the sun passes through the meridian of the point (solar noon), positive in the afternoon and negative in the morning. The declination can be found by Equation 9:
(9)
Where B is given by:
(10)
Being n the nth day of the year.
The time angle corresponding to the sunset can be obtained by Equation 11:
(11)
Thus, the diffuse radiation component (Hd) is deined.
The direct component of the radiation, Hb, is obtained by the differ-ence between the daily global radiation and its diffuse component (Equation 12).
(12)
After calculating the diffuse and direct components of the daily global, monthly average radiation on a horizontal surface, one can obtain the hourly radiations in the interval between sunrise and sunset in the studied location. To do so, one must know the dura-tion of the solar day, deined in reladura-tion to the true solar time (TSV). TSV is the time based on the apparent angular movement of the sun, with solar noon when the sun crosses the meridian of the ob-server, which does not coincide with local time [16].
The start time and the end time of the solar day are deined by Equation 13 and Equation 14, respectively [17].
(13)
(14)
Thus, the global and diffuse hourly radiations for each hour of the solar day can be obtained, respectively, by Equations 15 and 16,
(15)
(16)
In which the factors rt and rd, deined as a function of the hour angle, are determined from Equations 17 and 18, respectively.
(17)
(18)
Where h is the hour angle, obtained by:
(19)
(20)
(21)
Direct hourly radiation is found by the difference between the glob-al hourly radiation and the diffuse hourly radiation.
(22)
Once the direct and diffuse hourly components of the solar radia-tion on a horizontal surface are obtained, the radiaradia-tion incident on a sloped surface can be determined. The direct component on a sloped surface can be expressed by Equation 23.
(23)
Where the factor Rb is given by the ratio between the cosine of the angle of incidence of the solar rays (θ) and the cosine of the zenith (ψ).
(24)
Where S is the angle between the plane of the surface in question and the horizontal:
(25)
(26)
According to Dufie and Beckman [16]: the angle of incidence of solar rays (θ) is the angle between the direct radiation on a surface and the normal one to that surface; The zenith (ψ) is the angle be-tween the vertical and a line to the sun; The surface azimuth (γ) is the deviation of the projection, on horizontal plane, from the normal
Figure 3
Latitude, hour angle, solar declination
to the surface, with zero in the south, negative east and positive west (Figure 4).
By using Equation 25, the angle θ can exceed 90°, which means that the sun is behind the surface. Also, it is necessary to ensure that the earth is not blocking the sun, that is, that the hour angle is between sunrise and sunset.
Using the diffused isotropic radiation model proposed by Liu and Jordan (1963) apud Dufie and Beckman [16], the radiation on the inclined surface is considered as three components: direct radia-tion, isotropic diffuse radiation and radiation relected by the ter -rain. An inclined surface of angle S with the horizontal has a sky vision factor of FC = (1 + cos S) / 2. Thus, the diffuse component on
the sloped surface is:
(27)
The sloped surface has a ield view factor of FT = (1 - cos S) / 2,
and if the surroundings have a relection coeficient ρ, the radiation from the terrain to the surface is:
(28)
Table 1 shows typical relection coeficient values.
The total hourly solar radiation incident on the inclined surface will be obtained by the sum of the direct, diffused and relected hour components (Equation 29).
(29)
Finally, the total daily solar radiation on the inclined surface, Id, is calculated as the sum of the hourly radiations in the interval of hours of sunshine, from sunrise to sunset. According to Stucky and Derron [18], concrete is not a blackbody and thus only part of the energy received by sunshine and other phenomena is absorbed, and it can be considered, for the wavelength zone in question, from 50 to 70% absorption. The authors also state that the effect of this energy received by radiation in the calculation of the temperature of the concrete can be considered as an increase of the external temperature, according to Equation 30.
(30)
Where Id is the total daily solar radiation and α is the transmission coeficient at the air-concrete contact, which may vary depending on the intensity of the convective currents and wind incident on the surface, from 15 to 40 Cal/m²hºC [18].
2.1.3 Efect of exposure time
The continued hydration of the cement leads to a reduction in the porosity of the concrete. Thus, the aging of concrete, depending on the type of cement, leads to a signiicant drop in the diffusion coef -icient over time and, therefore, disregarding this mechanism can lead to very conservative predictions of corrosion time [13]. The dependence over time is considered through Equation 31.
(31)
Where tref is the time at which the reference diffusion coeficient (s) was determined, t is the exposure time (s) and m is the ageing factor. Bamforth (1998) apud Martín-Pérez [19] proposes values of m of 0.264 for ordinary Portland cement (OPC), 0.699 for concrete with ly ash (FA), and 0.621 for concrete with ground granulated blast-furnace slag (GGBS). It is worth mentioning that, in order to increase the reliability of the predictions, there is a need of further studies, addressing the ageing factor “m” for several types and levels of admixtures.
2.1.4 Efect of humidity
The effect of humidity on the diffusion coeficient is of great impor -tance, since the diffusion process only occurs in the presence of water in the pores. Thus, Saetta et al. (1993) apud Martín-Pérez
[19] proposes that the reduction in diffusity with the loss of humidity can be expressed by Equation 32.
Figure 4
Incidence of sunlight on sloped surface
Source:adapted from Agullo [16]
Table 1
Coeficient of relection of the surroundings
Type of soil ρ
Recent snow 80-90%
No recent snow 60-70%
Cropping areas: –
Without vegetation 10-15%
Dry grass 28-32%
Prairie and forests 15-30%
Sandy area 15-25%
Cement, concrete 55%
Light sand 25-40%
Water: –
Summer 5%
Winter 18%
(32)
Where h is the relative humidity in the pores of the concrete and hc is the humidity in which the diffusion coeficient falls to the inter -mediate value between its maximum and minimum values, Bazant and Najjar apud Martín-Pérez [19] assume this value as 0.75 for
the drying concrete.
As in the case of temperature, in order to mathematically model the relative humidity variation in the concrete pores throughout the year, the developed software uses a sinusoidal function (Equation 33), deined from the maximum annual humidity, the annual mini -mum humidity and of the day when the highest humidity occurs.
(33)
2.1.5 Skin efect
The concrete “skin” is the area closest to the cover surface. It usually has a different composition from that of the innermost layers due to phenomena such as contact with forms, carbon-ation, brucite precipitation - the concrete exposed to seawater may have its resistivity increased by the formation of a thin surface layer of brucite (Mg (OH)2) [20] - , segregation of
ag-gregates and even when concrete presents some coating or painting [21]. The existence of a surface layer with a different diffusivity will cause a change in the chloride concentration pro -iles. Higher skin diffusivity values can occur when the skin is carbonated and when chlorides penetrate through capillary suc-tion. The opposite case, with lower diffusivity, occurs when there is some barrier effect on the surface, such as brucite precipita-tion or coating paint use [21, 22].
Andrade et al. [21] models the skin effect considering different values for the diffusivity of the supericial and inner layer, an ap -proach also used in this study. As the concentration of chlorides in the boundary between the skin and the inner part becomes the surface concentration (boundary condition) of the concrete inner part (Figure 5).
2.2 Boundary conditions
To solve Fick’s equation it is necessary to deine the boundary con -ditions of the problem. It is common to consider null value for the initial concentration of chlorides. However, if there is contamination of the ingredients of the mixture, this value can be speciied. The surface concentration of chlorides is commonly considered as a constant value. However, Costa and Appleton [12] point out that it is variable in time and this approximation can cause great errors for long term predictions. In fact, Andrade et al. [23] demonstrate the importance of surface concentration by comparing eight diffu-sion models. The results indicate that the surface concentration as-sumes a much more signiicant role than the diffusion coeficient, a theme that usually attracts a much larger number of studies, which is in line with parametric analyses performed by other authors [24,
25]. The authors conclude by stating that a crucial factor is to have a law of consistent surface concentration evolution. Thus, the de -veloped software allows ive different approaches, one of them be -ing the adoption of a constant value. It is also possible to select which surfaces are subject to chloride penetration.
The approach presented by Uji et al. [26] proposes an expres-sion for the boundary condition in which the surface concentration tends to increase with the service time of the structure, according to a linear function of the age root of the concrete (Equation 34).
(34)
Where S is a coeficient dependent on the structure type and ex -posure zone [1/√s] and t is the ex-posure time [s]. The intervals of values found by the authors for S were (5.31-16.6 x 10⁻⁶ 1/√s) for the splatter zone, (18.2-23.5 x 10⁻⁶ 1/√s) for the tidal zone and (1.56-5.57 x 10⁻⁶ 1/√s) for the atmospheric zone.
In another approach, proposed by Collins and Grace [27], after an initial increase, the surface concentration reaches a limit value, becoming constant (Equation 35). According to the authors, the magnitude of this limit is related to the cement system and to the porosity of the surface layer.
(35)
Where Cs,ult is the inal surface concentration, found by the authors
Figure 5
Skin effect
as 0.6% for a ordinary Portland cement concrete with a water ce -ment ratio of 0.4 and ce-ment content of 450 kg/m3, t is the
expo-sure time (days) and Tcs is a parameter that regulates the rate of accumulation of chlorides on the concrete surface (days).
As the surface chloride concentration used by the above studies is given in % by weight of concrete, its weight equivalent of cement can be obtained from the cement content in the concrete (kg/m³), according to Equation 36.
(36)
Ann et al. [28] and Song et al. [29] present models that consider an initial accumulation of chlorides on the surface, which then increas-es with the exposure time, from Equations 37 and 38, rincreas-espectively.
(37)
Where k is the constant under a linear accumulation condition, t is the ex-posure time and C0 is the initial accumulation of chlorides on the surface.
(38)
Where Cs0 is the surface concentration at a standard time (e.g., 28 days) and α constant parameter to be determined for the data used.
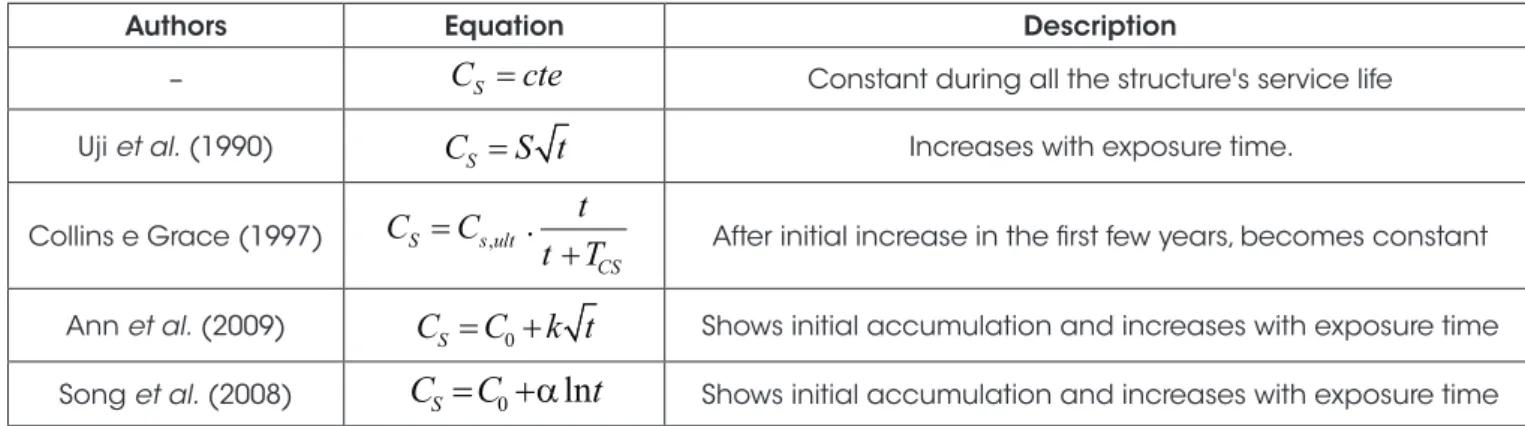
Table 2 presents a summary of the surface chlorite
concentra-tion models implemented in the developed software program.
3. Parametric analyses
The chlorides transport phenomenon, according to the proposed model, involves several parameters that characterize the geometry, the material and the environmental conditions. The aim of this study is to evaluate the inluence on chloride penetration of: climatic pa -rameters, exposure time, according to the addition used in concrete, and different approaches for the surface concentration of chlorides (boundary conditions). Table 3 shows the control variables related to geometry and time parameters, common to all studies performed. The other variables are presented in each analysis.
It is important to point out that this study does not aim to ind exact values for the concentration of chlorides. Instead, the results obtained should be considered in a relative context, demonstrating the level of inluence of each parameter in the initiation period of the structure.
3.1 Inluence of climatic parameters
on chloride penetration
i. Temperature and humidity
The cities of Florianópolis (SC, Brazil) and João Pessoa (PB,
Table 2
Summary of the chloride surface concentration models
Authors Equation Description
–
C
S=
cte
Constant during all the structure's service lifeUji et al. (1990)
C
S=
S t
Increases with exposure time.Collins e Grace (1997) S
=
s ult,.
+
CS
t
C
C
t T
After initial increase in the irst few years, becomes constantAnn et al. (2009)
C C k t
S=
0+
Shows initial accumulation and increases with exposure timeSong et al. (2008)
C C
S= +
0a
ln
t
Shows initial accumulation and increases with exposure timeTable 3
Parametric analysis: control variables (time and geometry)
Control variables Value
Geometry Dimensions 8 cm x 8 cm
Concrete cover 3 cm
Mesh
Type of elements Linear triangular
Size of elements 0.002
Number of nodes 2141
Number of elements 4088
Time parameters Final time (T) 50 years
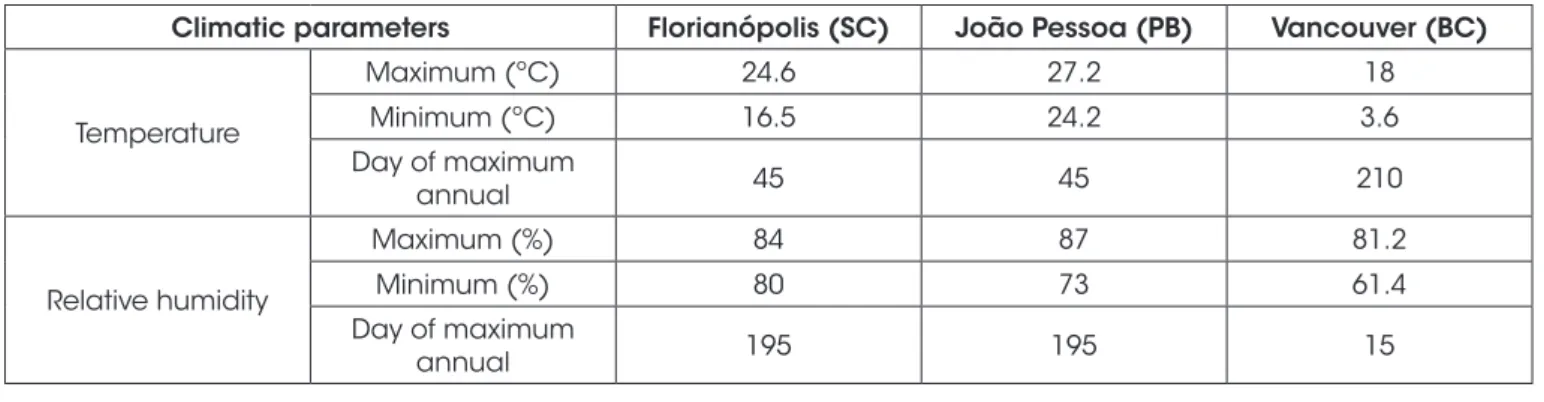
Brazil) were chosen for this analysis because they are two cities of the Brazilian coast and have very different ambient temperature and humidity values. In addition to these cities, Vancouver (BC, Canada) was selected as a coastal city with a considerably cooler and drier climate.
The effects of temperature and humidity are modeled from the functions f1(T) and f3(h), present in Equation 2. As a reference, a case with a constant diffusion coefficient in time was used, that is, disregarding the influence of the climatic parameters. For this analysis, the surface chloride concentration was kept constant over time and the effects of the degree of hydration and the skin effect were not considered in order to facilitate the interpretation of the results regarding the parameters to be studied. Table 4 shows the control variables that make up this study and their respective values. The surface chloride concentration (Cs) and the reference diffusion coefficient (Dc,ref) were chosen within the ranges found in the literature [10, 12, 26, 28, 29].
Due to the lack of more accurate data, the temperature and relative humidity of the concrete pores were considered in equilibrium with the atmosphere. As reported by Andrade et al. [30], the temperature inside the concrete is very similar
to the outside temperature. The climatic data of the cities of Florianópolis (SC, Brazil) and João Pessoa (PB, Brazil) were obtained from the National Institute of Meteorology (INMET2)
for the period 1961 to 1990. The data about the City of Van-couver, (BC, Canada) were provided by the Department of En -vironment and Climate Change Canada (ECCC3) from 1981 to
2010. The values used as input data in the software are shown in Table 5.
ii. Solar radiation
This study was carried out for the cities of João Pessoa (PB) and Florianópolis (SC) with the same parameters of the previ -ous item, adding those referring to solar radiation.
The solar radiation is considered in the function f1(T) (Equa -tion 3) from an increase in the external temperature (Equa-tion 30). Monthly average global solar radiation data on a horizon -tal surface for each month of the year were obtained from the Solarimetric Atlas of Brazil [15]. The other parameters were selected to represent a structure located in the urban area. Table 6 presents the input data in the program for the modeling of solar radiation for João Pessoa and Florianópolis.
3.1.1 Results and discussion
i. Temperature and humidity
Figure 6 shows the variation of the chloride concentration for the
Table 4
Parametric analysis: control variables
Control variables Value
Boundary conditions Initial concentration (C0) 0 %
Chloride surface concentration (Cs) 2 % cement weight
Diffusion coeficient
Reference diffusion coeficient (Dc,ref) 1x10 - 12 m²/s
Reference temperature (Tref) 23 ºC
Activation Energy (U) 41.8 kJ/mol
Humidity parameter hc 0.75
Table 5
Parametric analysis: annual climatic parameters
Climatic parameters Florianópolis (SC) João Pessoa (PB) Vancouver (BC)
Temperature
Maximum (ºC) 24.6 27.2 18
Minimum (ºC) 16.5 24.2 3.6
Day of maximum
annual 45 45 210
Relative humidity
Maximum (%) 84 87 81.2
Minimum (%) 80 73 61.4
Day of maximum
annual 195 195 15
2http://www.inmet.gov.br/portal/index.php?r=clima/normaisclimatologicas
case of constant diffusion coeficient and for the cities of Flori -anópolis, João Pessoa and Vancouver. Table 7 shows chloride concentration values for the ages of 5, 10, 20 and 50 years for the studied cases.
It can be observed that the rate of increase in the concentration of chlorides varies throughout the year seasonally, presenting reduc -tion in the inclina-tion of the curve in cooler and dry periods. For all ages, the case at which the diffusion coeficient was kept constant showed higher concentrations. Florianópolis shows, in relation to the case of constant coeficient, reductions of 53.90%, 36.70%, 22.60% and 14.00% for the ages of 5, 10, 20 and 50 years, respectively. On the other hand, João Pessoa shows reductions of 35.81%, 22.41%, 12.96% and 7.93% for these ages. In relation to the same case, Vancouver, due to its low values of f1(T) and f3(h), is the one that shows the greatest
reductions, namely 100%, 100%, 97.94% and 86.78%. In rela -tion to the city of João Pessoa, which resulted in the highest concentrations between the three cities, Vancouver has a con -centration reduction of 85.64% for the age of 50 years. Figure 7 shows the isoconcentration maps generated by the software for the cases analyzed.
ii. Solar radiation
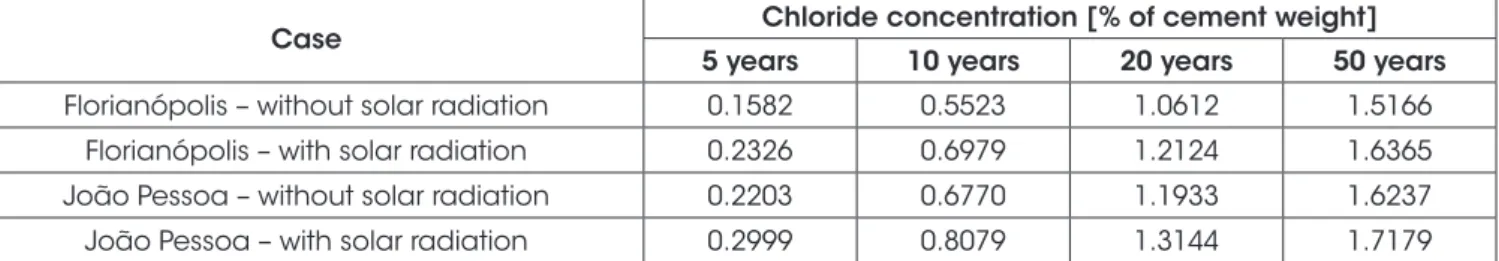
In this analysis, the parameters of temperature and humidity of the cities of Florianópolis and João Pessoa were considered, with the increase in the temperature generated by the solar radiation in these cities (Equation 30). Figure 8 shows the chloride concentra -tion varia-tion for the cities of Florianópolis and João Pessoa, dem -onstrating the effect of considering the inluence of solar radiation.
Table 6
Parametric analysis: parameters of solar radiation - João Pessoa (PB) and Florianópolis (SC)
JAN FEB MAR APR
João Pessoa Florianópolis João Pessoa Florianópolis João Pessoa Florianópolis João Pessoa Florianópolis
22 18 20 16 20 14 18 12
MAY JUN JUL AUG
João Pessoa Florianópolis João Pessoa Florianópolis João Pessoa Florianópolis João Pessoa Florianópolis
16 10 14 8 14 8 18 10
SEPT OCT NOV DEC
João Pessoa Florianópolis João Pessoa Florianópolis João Pessoa Florianópolis João Pessoa Florianópolis
20 12 22 16 20 18 20 18
Parameters for calculating increase in temperature
City João Pessoa Florianópolis
Latitude 27.5º 7.0º
Surface slope 90º 90º
Surface azimuth 30º 30º
Relection coeficient of surroundings 0.5 0.5
Absorption factor 60% 60%
heat transfer coeficient 25 Kcal/m²h ºC 25 Kcal/m²h ºC
Figure 6
Constant Dc 0.3432 0.8725 1.3710 1.7635
Florianópolis 0.1582 0.5523 1.0612 1.5166
João Pessoa 0.2203 0.6770 1.1933 1.6237
Vancouver 0.0000 0.0000 0.0283 0.2332
Figure 7
Isoconcentration maps – climatic parameters
Figure 8
Table 8 shows chloride concentration values for the ages of 5, 10, 20 and 50 years for the studied cases.
Through the presented results, it is observed the capacity of the solar radiation to increase the diffusivity of the concrete. With this consideration, the city of Florianópolis presented concentrations of 47.03%, 26.36%, 14.25% and 7.91% higher for the ages of 5, 10, 20 and 50 years, respectively. Accordingly, for the city of João Pessoa, concentrations were 36.13%, 19.34%, 10.15% and 5.8% higher for the same ages.
3.2 Inluence of exposure time
on chloride penetration
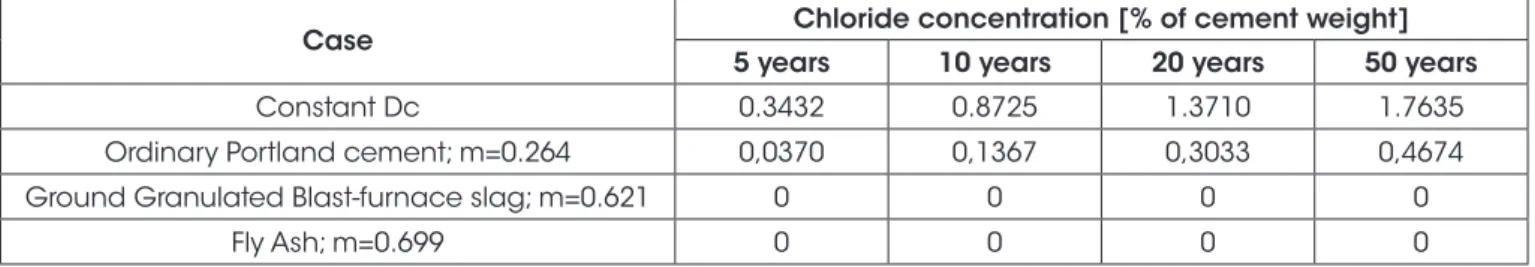
With increased exposure time, there is a continuous increase in the degree of hydration, which reduces the permeability of the con-crete, also reduces its diffusivity, a value depending on the type of cement and admixtures used.
For this analysis, only the degree of hydration was considered as an intervening factor in the diffusion coeficient, that is, the effects of temperature, relative humidity and solar radiation were not con -sidered so as to facilitate the interpretation of the results regarding the parameters it aims to study. The surface chlorides concentra-tion (Cs) used was 2% in relaconcentra-tion to the cement mix, kept constant over time. The values used for the ageing factor (m), which con -trols the evolution of cement hydration, were 0.264 (ordinary Port
-land cement - OPC), 0.621 (cement with ground granulated blast furnace slag - GGBS) and 0.699 (ly ash cement - FA).
3.2.1 Results and discussion
The variation of the function f2(t) (Equation 7) over two years for the cases studied is shown in Figure 9. Figure 10 shows the varia -tion of the chloride concentra-tion for the cases of: constant dif-fusion coeficient, OPC (m = 0.264), GGBS (m = 0.621), and FA concrete (m = 0.699). Table 9 shows chloride concentration values for the ages of 5, 10, 20 and 50 years.
The results show a great inluence of the type of cement, the ad -mixtures used and the degree of hydration in the diffusivity of the concrete. Consideration of the degree of hydration led to a reduc-tion in chloride concentrareduc-tion after 50 years of exposure of 73.50% for OPC and 100% for cement with GGBS and FA. It is veriied that the effect of the hydration occurs mainly in the early ages, affecting decisively the diffusion of chlorides (Figure 9).
When considering the value of 0.4% as the threshold concentra -tion for the depassiva-tion of the reinforcement, a common value in the technical ield, it is estimated that the reinforcement would be depassivated in a little more than 5 years when the effect of the hydration degree is disregarded. In the case of OPC, the
Table 8
Chloride concentration values for 5, 10, 20 and 50 years – solar radiation
Case Chloride concentration [% of cement weight]
5 years 10 years 20 years 50 years
Florianópolis – without solar radiation 0.1582 0.5523 1.0612 1.5166
Florianópolis – with solar radiation 0.2326 0.6979 1.2124 1.6365
João Pessoa – without solar radiation 0.2203 0.6770 1.1933 1.6237
João Pessoa – with solar radiation 0.2999 0.8079 1.3144 1.7179
Figure 9
Multiplicative function variation f2 (t) throughout
two years
Figure 10
depassivation would occur at 30 years. Considering the use of GGBS and FA, depassivation would occur at ages greater than 50 years.
3.3 Inluence of diferent surface concentration
models on chloride penetration
For this analysis, the chloride diffusion coeficient was kept con -stant over time, that is, the effects of temperature, relative humid -ity, degree of hydration and solar radiation on the diffusion coef-icient were not considered so as to facilitate the interpretation of the results regarding the parameters to be studied. Table 10 shows the control variables that make up this study and their respective values.
This study used the surface concentration data presented by Bentz et al. (1996) apud Song [29], employed by Song [29] in propos-ing his model. From the parameters presented by the author, non-linear regression was performed to adjust the curves of the other models. For the concentration values of chloride in % of concrete weight, for obtaining concentration in relation to % of cement
weight, a speciic weight of 2300 kg/m³ and cement content in the concrete of 350 Kg/m3 was considered. The parameters found
for each model are presented in Table 11. Figure 11 shows the curves obtained with these parameters. The values obtained are equivalent, according to the technical literature, to a zone of tidal variation [31].
3.3.1 Results and discussion
Figure 12 shows the chloride concentration variation for the ive surface concentration approaches used in this study. Table 12 shows chloride concentration values for the ages of 5, 10, 20 and 50 years for the studied cases.
The constant surface concentration approach produced the high-est chloride concentration values for the irst 30 years. This is be -cause, according to Figure 11, the surface concentration was the highest in the early ages. For higher ages, this approach tends to present lower values than the other models. The model of Uji et al. [26], presented the lowest concentrations of chlorides dur-ing almost the entire estimated time. However, at ages close to
Table 9
Chloride concentration values for 5, 10, 20 and 50 years – exposure time
Case Chloride concentration [% of cement weight]
5 years 10 years 20 years 50 years
Constant Dc 0.3432 0.8725 1.3710 1.7635
Ordinary Portland cement; m=0.264 0,0370 0,1367 0,3033 0,4674
Ground Granulated Blast-furnace slag; m=0.621 0 0 0 0
Fly Ash; m=0.699 0 0 0 0
Table 10
Parametric analysis: control variables
Control variables Value
Boundary conditions Initial concentration (C0) 0 %
Diffusion coeficient Reference diffusion coeficient (Dc,ref) 1x10-12 m²/s
Table 11
Parameters of surface concentration obtained through non-linear regression
Model Equation Parameters
-
C
S=
cte
Cs = 5.1541Uji et al. (1990)
C
S=
S t
S = 2.51e-05Collins and Grace (1997) S
=
s ult,.
+
CS
t
C
C
t T
Cs,ult = 0.8651 ; Tcs = 533.5267Ann et al. (2009)
C C k t
S=
0+
C0 = 3.3593 ; k = 0.3488Figure 12
Chloride concentration variation – surface
concentration
Table 12
Chloride concentration values for 5, 10, 20 and 50 years – surface concentration
Approach Chloride concentration [% of cement weight]
5 years 10 years 20 years 50 years
Constant Cs 0,8845 2,2484 3,5331 4,5446
Uji et al. (1990) 0,1761 0,7829 2,0521 4,8225
Collins and Grace (1997) 0,4270 1,6747 3,2969 4,7543
Ann et al. (2009) 0,6431 1,7610 3,0757 4,7780
Song et al. (2008) 0,5220 1,6745 3,1381 4,7933
Figure 11
Surface concentration variation curves used in parametric analysis
50 years, it already showed higher concentrations, with a tendency to increase distancing at future ages.
The other models [27-29] resulted in values of chloride concentra -tion very close throughout the study period. However, the curve referring to the Ann et al. [28] tends to distance itself from the other two because the surface concentration of this model tends to grow indeinitely with time. On the other hand, the models of Collins and Grace [27] and Song et al. [29] tend to continue to present close values, since their surface concentration curves have some as -pects in common, starting at intermediate values and approaching a constant value in recent years.
4. Analysis of diferent cover
thicknesses for the cities of Vitória (ES)
and Florianópolis (SC)
-for the cities of Vitória (ES) and Florianópolis (SC), demonstrating the effects on the service life. For this, a 20 cm wide and 40 cm high facade beam in naked concrete located in a marine atmo-sphere zone is considered.
Due to the lack of more precise data, speciic to each region, we employed the surface concentration model by the Uji et al. [26], with parameter “S” equal to 5.57 x e-6 1 / √s, indicated by the au -thor as typical of marine atmosphere zone. Only one of the faces of the beam was considered exposed (Figure 13). The evolution of the surface concentration used for the two cities is shown in Figure 14.
Due to the lack of real data, the reference diffusion coeficient was adopted as 1x10-12 m² / s, measured at 120 days at 23º C, a value
consistent with those found in the literature. Climatic data from the city of Vitória (ES) and Florianópolis (SC) were obtained from the National Institute of Meteorology (INMET). Due to the lack of more accurate data, the temperature and relative humidity of the con -crete pores were considered in equilibrium with the atmosphere. As reported by Andrade et al. [30], the temperature inside the con-crete is very similar to the external temperature. The activation en -ergy was adopted as 44.6 kJ/K.mol, referring to a concrete with water/cement ratio of 0.5.
In order to consider the degree of hydration, the type of cement used should be determined. The most used cement in Vitória is the CP – III. On the other hand, in Florianópolis, the CP - II and the CP - IV are predominant. However, due to the great sensitivity of the diffusion coeficient in relation to the ageing factor (m), the great variability of this parameter and the lack of accurate data for each type of cement, a less favorable situation was considered, with a Concrete of CP-I cement, of factor “m” equal to 0.264.
The monthly average global solar radiation data received by a horizontal surface for each month of the year in the cities of Vitória and Florianópolis were obtained from the Solarimetric Atlas of Brazil [15]. The other parameters for calculating the temperature
increase due to solar radiation were chosen to represent a struc-ture in the urban area. The parameters used as input data in the software program are shown in Tables 6, 13 and 14.
4.1 Results and discussion
Figure 15 and Figure 16 show the variation of chloride concentra -tion for the concrete covers studied for the cities of Vitória and Florianópolis, respectively. Table 15 shows chloride concentration values for the ages of 5, 10, 20 and 50 years for the study cases. Figure 17 shows the isoconcentration maps generated by the soft-ware for the cases analyzed.
It can be seen that the concentrations reached in the two cities
Figure 13
Geometry and exposed surface
Figure 14
Table 13
Application of the model: input parameters
Parameters Value
Geometry Dimensions 20 cm x 40 cm
Concrete cover 20 mm 30 mm 40 mm
Mesh
Type of elements Linear triangular
Size of elements 0.006
Number of nodes 3256 3253 3234
Number of elements 6211 6205 6167
Time parameters Final time (T) 50 years
Time step (Dt) 5 days
Boundary conditions
Initial concentration (C0) 0 %
Chloride surface
concentration (Cs)
Uji et al. (1990) S = 5.57 e-6 1/√s
Cement content 350 kg/m³
Diffusion coeficient
Reference Diffusion Coeficient
(Dc,ref) 1x10-12 m²/s
Reference Temperature (Tref) 23 ºC
Reference age (tref) 120 days
Activation Energy (U) 41.8 kJ/mol
ageing factor (m) 0,264
Humidity parameter hc 0,75
Diffusion coeficient
City: Vitória Florianópolis
Maximum (ºC) 26,9 24,6
Minimum (ºC) 21,7 16,5
Day of maximum annual 45 45
Relative humidity
Maximum (%) 80 84
Minimum (%) 77 80
Day of maximum annual 285 195
Table 14
Application of the model: solar radiation parameters – Vitória (ES)
Daily global solar radiation on a monthly average received by a horizontal surface for each month of the year [MJ/m².day]
JAN FEB MAR APR
18 18 18 14
MAY JUN JUL AUG
14 12 12 14
SEPT OCT NOV DEC
14 16 16 16
Parameters for calculating increase in temperature
Latitude 20,3 º
Surface slope 90 º
Surface azimuth 30 º
Relection coeficient of surroundings 0,5
Absorption factor 60 %
were not very distinct, and after 50 years, Vitória presented values 1.11%, 1.99% and 6.51% higher compared to Florianópolis, for thicknesses of cover of 20 mm, 30 mm and 40 mm, respectively. It is important to point out that, because it is a hypothetical case and because of the lack of data, in this study the same surface concentration was adopted in the two cities, characterizing a zone of marine atmosphere. However, this value tends to change with the location and distance of the sea, inluencing the chloride con -centration.
The results also demonstrate the great importance of the cover thickness. For the city of Vitória, the case with 30 mm cover has concentrations 85.06%, 74.01%, 59.71% and 42.08% lower than the case with 20 mm thickness for the ages of 5, 10, 20 and 50 years, respectively. The 40 mm cover beam obtained values of concentration 100%, 100%, 94.54% and 80.01% lower for the same ages when compared to the same case. Similar results are obtained for Florianópolis.
Considering the value of 0.4% as the concentration threshold for
the depassivation of the reinforcement, a common value in the technical ield, the service life obtained for the beam with 20 mm of cover is around 26 years for both cities. For the thickness of 30 mm, the depassivation occurs at 48 years, also in both cities. That is, the increase of 10 mm in cover thickness led to an increase of 84.62% in the service life of the part. The 40 mm cover, which provides the longest service life among the three, presents, after 50 years, a concentration of 0.1444% for the city of Vitoria and 0.1384% for Florianópolis, with a high residual service life.
5. Conclusions
Although the corrosion of reinforcements by chloride attack has been a very much studied topic since the 70’s, there are many gaps in the knowledge of its processes. A considerable number of service life models have already been developed; however, there is still no widely accepted approach that has managed to effec-tively reach the market.
Figure 15
Chloride concentration variation in Vitória, ES
Figure 16
Figure 17
Isoconcentration maps – concrete covers
of 20 mm, 30 mm and 40 mm
Table 15
Chloride concentration values for 5, 10, 20 and 50 years
Approach Chloride concentration [% of cement weight]
5 years 10 years 20 years 50 years
Vitória –20 mm concrete cover 0,0404 0,1291 0,3060 0,7373
Vitória – 30 mm concrete cover 0,0060 0,0336 0,1233 0,4270
Vitória – 40 mm concrete cover 0 0 0,0167 0,1474
Florianópolis – 20 mm concrete cover 0,0384 0,1252 0,3001 0,7292
Florianópolis – 30 mm concrete cover 0,0057 0,0319 0,1191 0,4187
Florianópolis – 40 mm concrete cover 0 0 0,0139 0,1384
This study presents a model of penetration of chlorides by dif-fusion in structures of reinforced concrete. This model fore-sees the evolution of the chloride concentration over time, as well as the time required, in a given situation, so that the chlo -ride limit for the depassivation of the reinforcement is reached. The software developed has a user-friendly interface (Figure 2) and data entry windows that allow the manipulation of all parameters considered, which facilitates analyses of the influ-ence of each variable.
5.1 Parametric analyses
In order to help understand the physical models that involve the various factors in chloride penetration, a parametric analysis was carried out, considering the inluence of climatic parameters (tem -perature, humidity and solar radiation), the inluence of the time of exposure (degree of hydration) and the inluence of different ap
-proaches of surface concentration of chlorides. From these ana-lyzes, we conclude:
n The lower the temperature and humidity, the lower the penetra-tion of chlorides. Thus, the increase in the concentrapenetra-tion of chlo-rides at a given point varies throughout the year, according to the climatic parameters.
n Cities with different climates presented very different values of
diffusion coeficient and concentration of chlorides, which sug -gests completely distinct times of repair. The greatest tendency for chloride penetration will occur in humid summers and the lowest in dry winters. Also, for temperatures close to zero this phenomenon is greatly reduced and, for humidities below 50%, it is practically non-existent.
n Solar radiation has the capacity to increase the diffusivity of the
concrete in a signiicant way, even for cities where the radiation is not so intense. Thus, non-consideration of solar radiation can lead to overestimated service life values.
n We can see a great inluence of the type of cement used and
the degree of hydration in the diffusivity of the concrete. This consideration led to a remarkable reduction of chloride concen-tration in the analyzed cases, increasing the initiation period from 5 years to 30 years in the case of OPC and well above 50 years for the cases of GGBS and FA, where, even after 50 years, the chloride front had not yet reached the reinforcement. n There is great sensitivity of the diffusion coeficient and chlo -ride concentration in relation to the ageing factor (m). However, there is no signiicant variety of studies addressing this factor for several types and levels of admixtures, an important condi -tion to increase the reliability of service life predic-tion.
n Consideration of a constant surface concentration produces higher chloride concentration values at lower ages, eventually being exceeded by other models. For higher ages, the curves referring to the approaches by Uji et al. [26] and Ann et al. [28] tend to present higher values. The models by Collins and Grace [27] and Song et al. [29], tend to present intermediate values, approaching a constant value.
n It is important to note that one of the factors that make it dificult to use models such as the one presented here is the lack of available data on the concentration of chlorides in the literature, for example, to deine the surface concentration of chlorides in certain areas or zones of aggressiveness.
phenomenon of diffusion can lead to major changes in the dei -nition of the initiation period, depending on the condition of the structure – location, climatic parameters, surface concentration, type of cement used, skin layer condition, etc. That is, the im-portance of each parameter is not constant, but will depend on the speciic case and the adoption of inappropriate models can lead to large errors in the indication of time for corrosion.
5.2 Analysis of diferent concrete cover
thicknesses for the cities of Vitória (ES)
and Florianópolis (SC)
n The use of the microclimates of each city did not generate major
changes in the estimated service life, since the surface concen -tration used was the same.
n The results obtained corroborate the cover thicknesses pre -sented in NBR 6118 [7]. For the cases studied, a 26-year life span was obtained for 20 mm concrete cover and 48 year for 30 mm concrete cover, minimum thickness for beams and columns located in areas of marine aggression class. The nominal cover speciied by the standard for this case of 40 mm resulted in low chloride concentration values after 50 years.
n NBR 6118 [7] still adopts as its main tool the deinition of mini -mum concrete cover thickness and mini-mum qualities of cover concrete. The use of deterministic models allows the quanti -tative evaluation of the service life for speciic real cases, ex -pressed in number of years. It is important to obtain data on surface concentration and diffusion coeficient for use in real constructions.
6. Acknowledgements
We are grateful to FAPES - Foundation for Research Support of Espírito Santo for the research incentive. We would also like to thank Dr. Carmen Andrade and Dr. Fabiano Tavares from the Edu -ardo Torroja Institute of Construction Sciences - Madrid - Spain.
7. References
[1] HELENE, P. Contribuição ao estudo da corrosão em armad -uras de concreto armado. Universidade de São Paulo - USP, Tese de Livre Docência, 248 p, 1993.
[2] DAL MOLIN, D. C. C. Fissuras em estruturas de concreto armado – análise das manifestações típicas e levantamento de casos ocorridos no estado do Rio Grande do Sul. Univer -sidade Federal do Rio Grande do Sul - UFRGS, Dissertação de Mestrado, 220 p, 1988.
[3] RIBEIRO, D. V. et al. Corrosão em estruturas de concreto armado - Teoria, Controle e Métodos de análise. Elsevier, 272 p, 2014.
[4] MEHTA, P. Kumar; MONTEIRO, Paulo J. M. CONCRETO – Microestrutura, Propriedades e Materiais. São Paulo: IBRACON, 2008.
[5] ANDRADE, C. Manual para diagnóstico de obras deterioradas por corrosão de armaduras. São Paulo: Ed. PINI, 104 p, 1992. [6] TUUTTI, K. Corrosion of steel in concrete. Stockholm: Swed -ish Cement and Concrete Research Institute, 469 p, 1982.
[7] ASSOCIAÇÃO BRASILEIRA DE NORMAS TÉCNICAS, Projeto de Estruturas de Concreto – Procedimento, NBR 6118, ABNT, Rio de janeiro, 238 p, 2014.
[8] HELENE, P. A Nova NBR 6118 e a Vida Útil das Estruturas de Concreto. In: II Seminário de Patologia das Construções, Porto Alegre, 2004. Novos Materiais e Tecnologias Emer -gentes. Porto Alegre: LEME/UFRGS, v.1. p.1-30, 2004. [9] ANDRADE, C. Reinforcement corrosion: Research needs.
Concrete Repair, Rehabilitation and Retroitting II – Alexan -der et al (eds). 8 p. 2009.
[10] TAVARES, F. Coupled model of initiation and propagation of corrosion in reinforced concrete. Universidad Politécnica de Madrid, Tesis, 166 p, 2013.
[11] CRANK, J. The Mathematics of Diffusion. London: Oxford University Press, p. 414, 1975.
[12] COSTA, A.; APPLETON, J. Chloride penetration into con -crete in marine environment - Part I: Main parameters affecting chloride penetration. Materials and Structures, 32, pp. 252-259, 1999.
[13] ANDRADE, C. et al. Measurement of ageing effect on chlo -ride diffusion coeficients in cementitious matrices. Journal of Nuclear Materials, 412, pp. 209-216, 2011.
[14] PAGE, C. L. et al. Diffusion of chloride ions in hardened ce-ment pastes. Cece-ment and Concret Research, 11, pp. 395-406, 1981.
[15] TIBA, C. et al. Atlas Solarimétrico do Brasil: banco de dados solarimétricos. Recife: Ed. Universitária da UFPE, 2000. [16] DUFFIE, J. A.; BECKMAN, W. A. Solar engineering of ther
-mal processes. Fourth edition. New Jersey: Wiley, 2013. [17] AGULLO, L. Estudio termico en presas de hormigon frente a
la accion termica ambiental. Universitat Politécnica de Cata -lunya, Tesis, 278 p, 1991.
[18] STUCKY, A; DERRON, M. Problèmes thermiques posés par la construction des barrages-réservoirs. École Polytech -nique de l’université de Lausanne, 1957.
[19] MARTÍN-PÉREZ, B. Service life modelling of r.c. highway structures exposed to chlorides. University of Toronto, The -sis, 168 p, 1999.
[20] BUENFELD, N. R.; NEWMAN, J. B; PAGE, C. L. The resis -tivity of mortars immersed in sea-water. Cement and Con -crete Research, 16, pp. 511-524, 1986.
[21] ANDRADE, C. et al. Mathematical Modeling of a Concrete Surface “Skin Effect” on Diffusion in Chloride Contaminated Media. Advanced Cement Based Materials, 6, pp. 39-44, 1997.
[22] MEDEIROS, M. H. F.; HELENE, P. Surface treatment of re -inforced concrete in marine environment: Inluence on chlo -ride diffusion coeficient and capillary water absorption. Con -struction and Building Materials, 23, pp. 1476-1484, 2009. [23] ANDRADE, C. et al. Comparison of chloride models: the
importance of surface concentration. 2nd International Sym-posium on Advances in Concrete through Science and Engi -neering, 16 p, 2006.
[25] STEWART, M.G.; MULLARD, J.A. Spatial time-dependent reliability analysis of corrosion damage and the timing of irst repair for RC structures. Engineering Structures, 29, pp. 1457-1464, 2007.
[26] UJI, K., MATSUOKA, Y., and MARUYA, T. Formulation of an equation for surface chloride content of concrete due to per -meation of chloride. In C. Page, K. Treadaway, and P. Bam -forth (Eds.), Corrosion of Reinforcement in Concrete, pp. 258–267. Essex, England: Elsevier Applied Science, 1990. [27] COLLINS, F.; GRACE, W. Speciications and testing for cor
-rosion durability of marine concrete: the Australian perspec-tive. In ACI International Conference on Durability of con -crete, pp. 757-776, 1997.
[28] ANN, K.Y. et al. The importance of chloride content at the concrete surface in assessing the time to corrosion of steel in concrete structures. Construction and Building Materials, 23, pp. 239-245, 2009.
[29] SONG, H. et al. Factors inluencing chloride transport in con -crete structures exposed to marine environments. Cement & Concrete Composites, 30, pp. 113-121, 2008.
[30] ANDRADE, C. et al. Relative humidity in the interior of con -crete exposed to natural and artiicial weathering. Cement and Concrete Research, 29, pp. 1249-1259, 1999.