*e-mail: [email protected]
Oxidation Behavior of FeCr and FeCrY Alloys
Coated with an Aluminium Based Paint
Marina Fuser Pillis*, Olandir Vercino Correa, Edval Gonçalves de Araújo, Lalgudi Venkataraman Ramanathan
Instituto de Pesquisas Energéticas e Nucleares – IPEN,
Av. Prof. Lineu Prestes, 2242, 05508-000 São Paulo - SP, Brazil
Received: April 16, 2007; Revised: September 5, 2008
A variety of metallic components rely on properties that are specific to the alloy and its surface. Coatings have been extensively used to protect metallic surfaces from the aggressive effects of the environment to which it is exposed. In this investigation, the high temperature oxidation behavior of a FeCr and a FeCrY alloy coated with an aluminium based paint has been studied. The objective was to form the more resistant alumina surface layer on an aluminium free alloy. Aluminium based paint coated and uncoated specimens of the two alloys were oxidized for up to 200 hours at 1000 °C in air. The oxidized specimens were examined in a scanning electron microscope coupled to an energy dispersive system and the surfaces were analyzed by X ray diffraction analysis. The aluminium based paint coating increased the oxidation resistance of the alloys, mainly over extended periods. The FeCrY alloy coated with the Al based paint exhibited the highest oxidation resistance.
Keywords: coatings, rare earths, chromium dioxide, alumina
1. Introduction
Metallic materials for use at high temperatures in oxidizing envi-ronments rely on the formation of a protective oxide layer separating the substrate from the environment to reduce further oxidation of the substrate. Chromium dioxide that forms on chromium containing al-loys becomes non-protective upon exposure to oxidizing atmospheres for extended periods at high temperatures. This is due mainly to crack formation in the oxide caused by growth and/or thermal stresses and also due to formation of volatile CrO3. Over 50 years ago it was shown that the addition of small amounts (<1 wt. (%)) of reactive elements, especially rare earths, to chromium dioxide forming alloys increased the oxidation resistance of these alloys by decreasing oxidation rates and by increasing oxide scale adhesion1,2. The rare earths have been:
a) added as alloying elements or as oxide dispersions; b) implanted in the surface of the alloy; and c) applied as a coating on the surface of the alloy3-7.
Chromium is an alloying element in commercial ferritic steels that can be used at temperatures up to 900 °C8. The chromium
diox-ide layer that forms on these steels confers protection up to 900 °C8.
The use of these steels or other chromium dioxide forming alloys at temperatures above 900 °C is limited due to formation of volatile CrO3 8. Consequently, for applications in oxygen rich environments at
temperatures in the range 900-1300 °C, aluminium containing alloys or alloys with coatings that form an external α-alumina rich layer have been used9,10. Alumina is thermodynamically more stable than
chromium dioxide and it also has a higher melting point. The trans-port of reactants through alumina is slower, compared to that through chromium dioxide10,11. In this context, to protect iron and chromium
based alloys for use at high temperatures with alumina surface layers, the use of aluminium based paints have been recommended12,13.
This paper presents the oxidation behavior of a FeCr and a FeCrY alloy coated with an aluminium paint containing a lower Al content than those mentioned in references 12 and 13. This paper also presents the oxidation behavior of the FeCr alloy coated with the same paint containing 1 wt. (%) Y2O3 and the role of rare earths on the oxidation behavior of Fe-Cr alloys.
2. Materials and Methods
The alloys Fe20Cr and Fe20Cr0.7Y were prepared in a vacuum induction furnace with commercially pure raw materials. The chemi-cal composition of the alloys in weight percent, as determined by X ray fluorescence spectroscopy is shown in Table 1. The alloy ingots were forged at 980 °C and specimens 10 x 10 x 2 mm were cut from these ingots, ground to 220 mesh and degreased in acetone.
Specimens of the two alloys were coated with an aluminium paint containing 9.5 ± 0.2 wt. (%) Al, as determined by neutron activation analysis and henceforth referred to as Al paint. A separate paint mixture, referred to as Al + Y2O3 was prepared by adding 1 wt. (%) Y2O3 to the Al paint. Specimens of FeCr alloy were coated with this mixture. The two types of paints were applied as a cold spray to cover the surfaces of the specimens. Uncoated and Al paint coated specimens were oxidized in a muffle furnace in air for 20, 50 and 200 hours at 1000 °C. All the specimens were weighed before and after oxidation. The mass gain of the specimens as a function of oxidation time was plotted.
The Al paint, the Al + Y2O3 paint and the oxidized specimens were examined in a scanning electron microscope (SEM) coupled to an energy dispersive spectrometer (EDS) to analyze micro regions. The specimens were also analyzed by X ray diffraction (XRD) analysis.
3. Results and Discussion
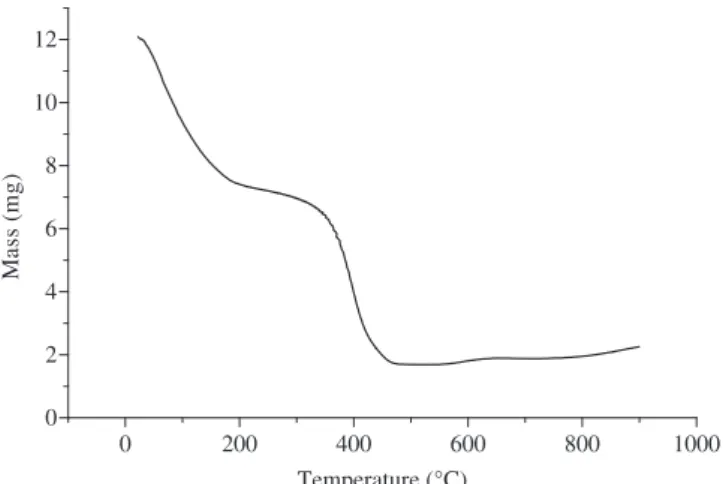
A small amount of Al paint was directly placed on a specimen holder and observed in the SEM. The paint with 9.5 wt. (%) Al con-sisted of lamellar particles dispersed in an organic vehicle, as shown in Figure 1a. Figure 1b shows an EDS spectrum of the paint and reveals the presence of carbon and oxygen besides aluminium.
could be attributed to oxidation of Al to Al2O3. This exercise was also carried out in a muffle furnace with a larger quantity of paint, and two temperature plateaus of 15 minutes each at 350 and 450 °C were used.
XRD analysis was used to determine the composition of the pow-der residue of the paint following the heating experiments. Figure 3 shows the XRD spectrum of the powder after the initial heating cycle. The phases, θ-Al2O3 and g-Al2O3 were identified besides small quan-tities of a more stable phase,α-Al2O3. A large quantity of metallic aluminium was also observed. In the early stages of oxidation of an Al particle, it forms a surface layer of Al2O3. Further growth of this layer depends on diffusion of the reactants, Al and oxygen, through the layer. The fact that aluminium was present in the powder residue of the paint confirmed that the mass gain seen in Figure 2 was due to formation of alumina. The powder residue was used in two further tests to determine the change in composition of the residue with in-crease in temperature and with time at temperature. In the first test, the powder was reheated in the muffle furnace to 900 °C and held for 65 hours. In the second test, the powder was reheated to 1000 °C and held for 65 hours. Figure 3 shows the XRD spectrums of the powders after these tests and reveals that the metallic aluminium transformed to alumina with increase in time of exposure. At the higher tempera-ture, α-Al2O3 tends to be the predominant phase. On the basis of these results, in subsequent oxidation tests that were carried out in the muffle furnace, the painted specimens were slowly heated up to 1000 °C and then held at that temperature for up to 200 hours.
Figure 4 shows the oxidation curves of FeCr and FeCrY alloy specimens with and without the paint coating. It can be seen that the Al2O3 layer that formed on the coated specimens decreased the overall mass gain of both alloys. Between the two alloys, the coated FeCrY alloy exhibited higher oxidation resistance. The difference in oxida-tion behavior between the two alloys is more evident after prolonged oxidation times. The uncoated FeCr and FeCrY alloys did not reveal oxide spalling. The Al paint coating detached from the surfaces of the two alloys whereas the Al+Y2O3 paint coating did not.
Figure 5a shows the surface of a specimen of FeCr alloy oxidized for 200 hours at 1000 °C. The EDS analysis of this specimen, shown in Figure 5b, revealed oxides of Cr and Mn on the surface. Figure 5c is the cross-section of the same specimen. The EDS analysis, shown in Figure 5d, indicated the presence of Fe, Cr and Mn. The latter (Mn) was detected on the surface of the oxide layer, as shown by the white arrows. The metal/oxide interface revealed voids and some voids were also seen near the top surface of the oxide layer. Void formation at the interface and in the oxide layer is not an artifact of sample preparation but is characteristic of oxidized iron-chromium alloys and similar findings have been reported14. EDS analysis carried
out in the oxide layer indicated that this layer was rich in Cr and the Fe content was less than 1%. XRD analysis identified the phases, Cr2O3 and MnCrO4, as shown in the XRD spectrum in Figure 6. The EDS and XRD data indicated that the oxide layer was preferentially Cr2O3. On top of this layer, MnCrO4 was noted. The presence of Mn rich phases on the surface of the oxidized specimens indicated that Mn diffused from the alloy to the surface of the oxide. This observa-tion is corroborated by Wild’s 15 findings that showed that Mn ions
diffused 100 times faster than Cr ions through the Cr2O3 lattice and formed MnCrO4 on a layer of mainly Cr2O3.
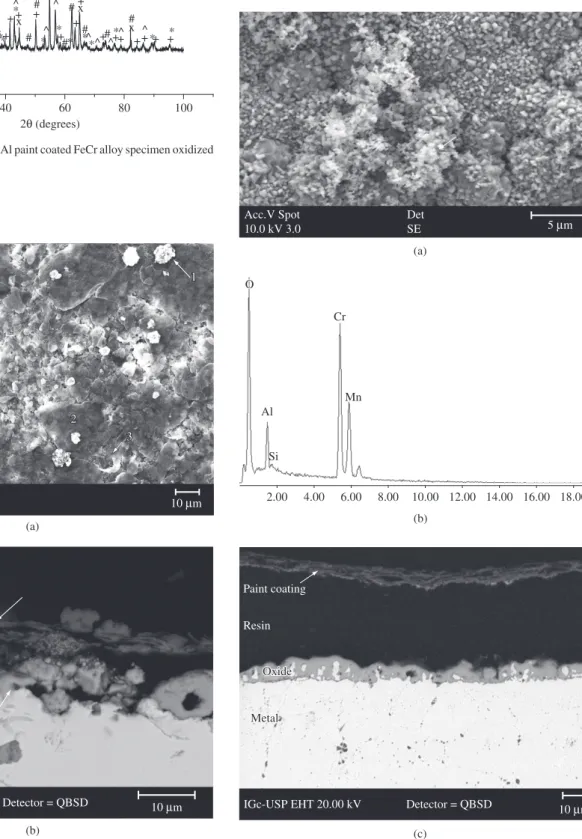
The surface of a specimen of the FeCrY alloy oxidized for 200 hours at 1000 °C is shown in Figure 7. The surface is grainier than that of FeCr. EDS analysis indicated the presence of the same ele-ments, Cr and Mn. XRD analysis revealed the presence of the phases Cr2O3 and MnCrO4 on the surface of this specimen, similar to that observed on the surface of the FeCr specimen oxidized under identical conditions and shown in Figure 6.
Table 1. Chemical composition of the alloys, as determined by X ray
fluo-rescence spectroscopy.
Alloys Elements (wt. (%))
Cr Mn Si Y Fe
FeCr 19.74 0.79 0.02 - balance
FeCrY 20.05 0.64 0.12 0.69 balance
Acc.V Spot 20.0 kV 4.0
Det
SE 20 m
0.90 1.80 2.70 3.60 4.50 5.40 6.30 7.20 8.10 9.00 O
C Al
(a)
(b)
Figure 1. The morphology: a) revealing lamellar particles and the EDS
spectrum; and b) of the aluminium based paint.
0 200 400 600 800 1000
0 2 4 6 8 10 12
Ma
ss
(
m
g
)
Temperature (°C)
0 20 40 60 80 100 0
100 200 300 400 500 600 700
1000 °C
900 °C
Inicial *
*
* ^
^
^ ^
" "
"
" "
" "
" " g-Al2O3
^
^ ^ ^ ^
^ ^
^ θ- Al2O3
+ + +
+
+ Al
* * * *
* *
*
*α- Al2O3
Counts (a.u.)
Angle (2θ) Angle (2θ)
0 50 100 150 200
0.0000 0.0005 0.0010 0.0015 0.0020 0.0025 0.0030
Weight gain/A (mg.cm
2)
Time (hours) FeCr
FeCr+coat.Al paint FeCr+coat.Al+Y2O3 paint
FeCrY+coat.Al paint FeCrY
Figure 3. X ray spectra of the residue of the Al paint heated to 900 and
1000 °C for 65 hours.
Figure 4. Oxidation mass change curves of the uncoated and the different
paint coated alloy specimens as a function of time.
(c) Acc.V
20.0 kV
Det
SE 10 m
(a) (b)
(d) Cr
Cr
O
Cr Mn
Mn
2.00 4.00 6.00 8.00 10.00 12.00 14.00 16.00 18.00
Resin
Oxide
Metal
10 mm Detector = QBSD
0 1 2 3 4 5 6 7 8 9 10 11 12
KeV O
Cr Cr Mn
Fe Mn
C
Fe
Cr
Mn
Mn Cr
Fe Fe
Figure 5. The surface and composition spectra of the FeCr specimen oxidized for 200 hours at 1000 °C. a) surface; b) EDS spectrum of the surface; c) cross
section; and d) EDS spectrum of the oxide layer.
The surface of a specimen of FeCr coated with the Al paint is shown in Figure 8a. The coating detached from the substrate at various regions. In Figure 8b, the cross section of this specimen can be seen and it reveals the detached coating at region 1. The EDS analysis results, shown in Figure 8c, indicated this layer to be rich in Al. The thickness of the coat-ing was approximately 2 µm. The chlorine peaks in the EDS spectrum
0
0 2020 4040 6060 8080 100100
0 0 100 100 200 200 300 300 400 400 500 500 600 600 700 700
^ ^ ^
^ ++ ++
^ ^ ^ ^ ^ ^ ^ ^ ^ ^
^ ^
^ ^ ^ ^
^ ^ ^ ^
^ ^
^ ^
+ + + + + + + + + + + + + + + +
+ + + +
+ + + +
+ + + + + +
+ +
* * * *
* * *
*
Intensity (a.u.)Intensity (a.u.)
Angle θ) Angle θ) * FeCr
* FeCr + Cr2O3 + Cr2O3
^ MnCrO4
^ MnCrO4
Figure 6. X ray spectrum of the FeCr alloy oxidized for 200 hours at
1000 °C.
10 m Acc.V
20.0 kV
Det SE
Figure 7. The surface of FeCrY alloy specimen oxidized for 200 hours at
1000 °C.
Acc.V 15.0 kV
Det
MIX 50 m
Resin
Oxide Oxide
Metal
Coating
EHT = 20.00 kV Detector = QBSD 20 m
1
2
(a)
(c)
(b)
(d)
cps cps
10
8
6
4
2
0
2 4 6
Energy (keV) O
Cr Al
Fe Si Cl
Cl
Cr
Mn
Mn Fe
Fe Cr
30
20
10
0
0 2 4 6
Fe Fe Cr Cr
Cr O
Fe
Energy (keV)
Figure 8. The surface and composition spectra of the Al coated FeCr specimen oxidized for 200 hours at 1000 °C. a) Surface; b) cross section; c) EDS spectrum
of region 1; and d) EDS spectrum of region 2.
inferred that the paint layer transformed to Al2O3, but did not inhibit the formation of a thick layer of Cr2O3 on the alloy surface.
Figure 10a shows the surface of the Al + Y2O3 paint coated FeCr specimen after oxidation for 200 hours at 1000 °C. EDS analysis at point 1 indicated that the nodules were rich in Al and probably Al2O3. Analysis at point 2 on the coating indicated the elements Al, Cr, Si, Mn and Fe. The cross section of the same specimen is shown in Figure 10b, and reveals that the paint layer transformed to aluminium oxide with particles of Y2O3 in the middle of the layer (top arrow) and formation
of a Cr rich oxide containing Mn (bottom arrow). The layer is hetero-geneous and its thickness non-uniform. Large voids at the metal/oxide interface and at the oxide/coating interface can be seen. Even though detachment of the paint coating was not observed, the addition of Y2O3 to the paint did not cause any significant reduction in mass gain. The improved adhesion could be attributed to higher surface roughness.
0 20 40 60 80 100 0
400 800
# # # #
# #
# # # #
# ^ ^
^ ^ *^ ^
^ ^
^ ^
^
^
* *
* * * * * *
* * *
+ + + + + + + +
+ + +
+ + + + + + +
x x
x
Intensity (a.u.)
2θ(degrees)
x Matrix + Cr2O3 * α-Al2O3
^ MnCrO4
# θAl2O3
Figure 9. X ray spectrum of the Al paint coated FeCr alloy specimen oxidized
for 200 hours at 1000 °C.
2 2
1 1
3 3
Detector = SE1 10 m
(a)
(b) Resin
Coating
Oxide Oxide
Metal
EHT = 20.00 kV Detector = QBSD 10 m
Figure 10. a) surface; and b) cross section of the Al paint + Y2O3 coated FeCr
specimen oxidized for 200 hours at 1000 °C.
other regions, the oxide was rich in Cr, probably in the form of Cr2O3. Figure11c is a cross section of the same specimen. The white arrow indicates the coating detached from the substrate. The oxide formed was rich in Cr, as indicated by the EDS spectrum. The thickness of the layer was uniform and revealed voids smaller than those observed in the oxide on the FeCr alloy specimen. The reduction in the oxide layer thickness and in the number of interfacial voids is due to Y in the alloy.
Acc.V Spot 10.0 kV 3.0
Det
SE 5 m
(a)
(b)
(c)
2.00 4.00 6.00 8.00 10.00 12.00 14.00 16.00 18.00 O
Al
Mn Cr
Si
Paint coating
Resin
Oxide Oxide
Metal Metal
IGc-USP EHT 20.00 kV Detector = QBSD 10 m
Figure 11. a) surface; and b) EDS spectrum of the white region (arrow); and
2. Chevalier S, Larpin JP. Formation of perovskite type phases during the high temperature oxidation of stainless steels coated with reactive element
oxides. Acta Materialia 2002; 50(12):3105-3114.
3. Ecer GM, Singh RB, Meier GH. The influence of superficially applied oxide powders on the high-temperature oxidation behavior of Cr2O3-forming alloys. Oxidation of Metals 1982; 18(1-2):55-81.
4. Stringer J. The reactive element effect in high temperature corrosion. Materials Science and Engineering 1989; 120 A:129-137.
5. Pillis MF, Ramanathan LV. Effect of processing technique on microstructure and oxidation behavior of rare earth oxide dispersion containing steels. Key Engineering Materials 2001; 189-191:322-327.
6. Pillis MF, Araújo EG, Ramanathan LV. Effect of addition of rare earth oxide concentrates on oxidation resistance of SISI 304L. Materials Science Forum 2006; 530-531:99-104.
7. Pillis MF, Ramanathan LV. Effect of alloying additions and preoxidation on high temperature sulphidation resistance of iron-chromium alloys. Surface Engineering. 2006; 22(2):129-137.
8. Birks N, Meier GH. Introduction to high temperature oxidation of metals.
London: Edward Arnold; 1983.
9. Hou PY, Stringer J. The effect of surface-applied reactive metal oxides on the high temperature oxidation of alloys. Materials Science and Engineering 1987; 87(part-1):295-302.
10. Grabke HJ. The role of the interface oxide/metal in the high temperature corrosion resistance of alloys. Materials Science Forum 1999; 294-296:135-138. 11. Pilling NB, Bedworth RE. The oxidation of metals at high temperatures.
Journal of the Institute of Metals 1923; 29:529-591.
12. Yagi T, Yamamoto J, Kohara H. Method of forming aluminum coating layer
on ferrous base alloy work piece. US Patent No. 4228203. 1980. 13. Rairden III, JR. Process of applying aluminum coatings for
non-super-strength nickel-chromium alloys. US Patent No. 4084025. 1978.
14. Guttmann V, Hukelmann F, Griffin D, Daadbin A, Datta S. Studies of the influence of surface pre-treatment on the integrity of alumina scales on MA
956. Surface and Coatings Technology 2003; 166(1):72-83.
15. Wild RK. High temperature oxidation of austenitic stainless steel in low
oxygen pressure. Corrosion Science 1977; 17(2):87-104.
16. Menzler NH, Sebold D, Zahid M, Gross SM, Koppitz T. Interaction of metallic SOFC interconnect materials with glass-ceramic sealant in various
atmospheres. Journal of Power Sources 2005; 152:156-167.
17. Quadakkers WJ, Piron-Abellan J, Flesh U, Shemet V, Singherser L. Metallic Interconnectors for solid oxide fuel cells-a review. Materials at High Temperature 2003; 20(2):115-127.
18. Ramanathan LV, Pillis MF, Fernandes SMC. Role of rare earth oxide coatings on oxidation resistance of chromia-forming alloys. Journal of Materials Science 2008; 43(2):530-535.
19. Pint BA. Experimental observations in support of the dynamic-segregation theory to explain the reactive element effect. Oxidation of metals 1996; 45(1-2):1-37.
20. Cotell CM, Yurek GJ, Hussey RJ, Mitchell DF, Graham MJ. The Influence of Grain Boundary Segregation of Yttrium in Chromium
Dioxide on the Oxidation of Chromium Metal. Oxidation of Metals 1990;
34(3-4):173-200.
21. Versaci RA, Clemens D, Quadakkers WJ, Hussey R. Distribution and transport of yttrium in alumina scales on iron-base ODS alloys. Solid State Ionics 1993; 59(3):235-242.
22. Pint B, Martin JR, Hobbs LW. 18O/ SIMS Characterization of the Growth
Mechanism of Doped and Undoped α- Al2O3. Oxidation of Metals 1993; 39(3-4):167-195.
23. Pint B, Hobbs LW. The Formation of α-Al2O3 Scales at 1500º C. Oxidation
of Metals. 1994; 41(3-4):203-233.
24. Pint B, Hobbs LW. Limitations on the use of Ion Implantation for the Study of the Reactive Element Effect in β-NiAl. Journal of the Electrochemical Society 1994; 141(9):2443-2453.
25. Pint B, Garratt-Reed AJ, Hobbs LW. The Reactive Element Effect in ODS
FeCrAl Alloys. Materials at High temperatures 1995; 13(1):3-16.
26. Kingery WD, Bowen HK, Uhlmann DR. Introduction to Ceramics. New
York: Wiley; 1976. 457 p.
27. Ramanarayanan TA, Raghavan M, Petkovic-Luton R. The Characteristics
of Alumina Scales Formed on Fe-based Yttria-Dispersed Alloys. Journal
of the Electrochemical Society 1984; 131(4):923-931.
4. General Discussion
Even though ferritic steels, similar to the FeCr based alloys stud-ied here, are considered to be “chromia formers” the other alloying elements in the steel also oxidize upon exposure to high temperatures. In dry or moist air, the oxides of alloying elements such as Mn, Al and Si and the base metal Fe form because the oxygen partial pressure in the environment (approximately 0.02 atm) is higher than the dissocia-tion pressures of the oxides of these elements 16. The oxidation of Fe
in the ferritic steels studied here is not considered to be important, due to formation of more protective oxides. Mn oxidizes in the atmosphere used here forming a Cr-Mn spinel on top of the chromium dioxide layer17. The oxide layer formed on the surfaces of FeCr and FeCrY
alloy specimens consisted of Cr2O3 and MnCrO4.
Among the different uncoated and Al paint coated specimens the Y containing alloy was most resistant to oxidation. The mechanism more widely accepted in recent years to explain the role of Y in improving the oxidation resistance of the Fe-Cr alloy is based on segregation-diffusion of the Y ion, both in the alloy and in the surface oxide layer18,19.
Ac-cording to this mechanism, the Y ion diffuses into the scale due to the oxygen potential gradient which extends from the gas interface into the substrate. En-route to the gas interface, Y ions first segregate to the metal-scale interface and then into the scale. The Y ion follows the fastest path to the gas interface, which are the scale grain boundaries20-25.
The presence of the Y ion at the oxide scale boundaries results in two effects. The first effect is inhibition of normal outward short circuit transport of alloy cations along scale boundaries due to slow diffusion of the Y ions. That is, the Y ion with a larger ionic radius, compared to the ionic radii of the alloy cations, diffuse at a slower rate along the scale grain boundaries and block the transport of the alloy cations. This effectively decreases chromium dioxide scale growth, as observed here on the FeCrY alloy. The second effect is reduction in oxide scale grain growth and this is due to a solute-drag effect of the Y ions that are at the scale grain boundaries17,26.This causes small grained oxides compared
to that formed on the surface of Y free FeCr alloy specimens. This has also been observed in this investigation. This reduced scale grain size also results in increased scale plasticity18,27.
On the FeCr and FeCrY alloy surfaces, the Al paint transformed to Al2O3 but did not inhibit the formation of a thick layer of Cr2O3. The addition of Y2O3 to the Al paint did not result in any significant reduction in mass gain either. This could be attributed to the more dominant role of Al than the rare earth oxide dispersion. The Al paint coated FeCrY alloy however exhibited higher oxidation resistance. The oxide layer on this Al paint coated FeCrY alloy was uniform and with smaller interfacial voids, due mainly to the conjoint effect of Al in the paint and Y in the alloy.
5. Conclusions
1. The surface oxide layer formed upon oxidation of the alloys FeCr and FeCrY consisted of mainly Cr2O3 and it also con-tained MnCrO4;
2. More protective α-Al2O3 formed in the surface oxide layer of an oxidized FeCr alloy coated with an Al based paint contain-ing 9.5 wt. (%) Al; and
3. The FeCrY alloy specimen coated with the Al based paint revealed increased oxidation resistance.
Acknowledgements
The authors thank CNPq for the financial support given to the project no: 476019/2003-6