Article
J. Braz. Chem. Soc., Vol. 22, No. 6, 1015-1023, 2011. Printed in Brazil - ©2011 Sociedade Brasileira de Química
0103 - 5053 $6.00+0.00
A
*e-mail: [email protected]
Puriication, Characterization and Structural Determination of UDP-N-Acetylglucosamine
Pyrophosphorylase Produced by Moniliophthora perniciosa
Manoelito C. Santos Junior,a Priscila A. Gonçalves,a Alex G. Taranto,b Maria G. B. Koblitz,c Aristóteles Góes-Neto,d Carlos P. Pirovani,e Júlio C. M. Cascardo,e Sandra H. da Cruz,f Russolina B. Zingali,g Gonçalo A. G. Pereira,h Cristiano V. Diasd and Sandra A. de Assis*,a
aDepartamento de Saúde, cDepartamento de Tecnologia and dDepartamento de Ciências Biológicas, Universidade Estadual de Feira de Santana, 44031-460 Feira de Santana-BA, Brazil
bLaboratório de Bioinformática, CCO, Universidade Federal de São João Del-Rei, 35501-296 Divinópolis-MG, Brazil
eLaboratório de Genômica e Expressão Gênica, DCB, Universidade Estadual de Santa Cruz, 45650-000 Ilhéus-BA, Brazil
fDepartamento de Agroindústria, Alimentos e Nutrição, Escola Superior de Agricultura Luiz de Queiroz, ESALQ, Universidade de São Paulo,13418-900 Piracicaba-SP, Brazil
gCentro de Ciências da Saúde,Universidade Federal do Rio de Janeiro, Ilha do Fundão, 21941-590 Rio de Janeiro-RJ, Brazil
hInstituto de Biologia, Universidade Estadual de Campinas, CP 6109, 13083-970 Campinas-SP, Brazil
A enzima UDP-N-acetilglicosamina pirofosforilase de Moniliophthora perniciosa
(CCMB 0257), o fungo patogênico causador da doença vassoura-de-bruxa do Theobroma cacao,
foi parcialmente puriicada por precipitação com sulfato de amônio e cromatograia de gel iltração em Sephacryl S-200. O tampão de extração da enzima foi o fosfato de sódio, 0,050 mol L-1, pH 7,0, contendo 1,0 mol L-1 de NaCl. A metodologia de superfície de resposta (MSR) foi usada para a obtenção do pH e temperatura ótima. Os resultados mostraram quatro diferentes isoenzimas (PyroMp I, PyroMp II, PyroMp III e PyroMp IV) que apresentaram pH ótimo na faixa de 6,9-8,4 e temperatura ótima variando entre 28 a 68 °C. A estrutura 3D de pirofosforilase de M. perniciosa
foi obtida por modelagem comparativa. O modelo obtido mostrou uma boa qualidade, possuindo 78,6% de aminoácidos nas regiões energeticamente favoráveis. O modelo foi então submetido a simulações de dinâmica molecular (DM). O modelo apresentou uma boa qualidade geométrica após as simulações de DM (91,1% - gráico de Ramachandran). A procura pelo sítio ativo da enzima mostrou que este é mantido extremamente conservado. Este modelo pode ser útil para desenvolvimento de inibidores contra a doença vassoura de bruxa.
The enzyme UDP-N-acetylglucosamine pyrophosphorylase (PyroMp) from Moniliophthora perniciosa (CCMB 0257), a pathogenic fungal strain and the causative agent of the witches’
broom disease in Theobroma cacao, was partially puriied by precipitation with ammonium sulfate
and gel iltration on Sephacryl S-200. The buffer for enzyme extraction was sodium phosphate, 0.050 mol L-1, pH 7.0, containing 1.0 mol L-1 NaCl. Response surface methodology (RSM) was used to determine the optimum pH and temperature conditions. Four different isoenzymes (PyroMp I, PyroMp II, PyroMp III and PyroMp IV) were obtained with optimal pH ranging from 6.9-8.4 and optimum temperature ranging from 28 to 68 °C. The 3Dstructure of pyrophosphorylase of
M. perniciosa was determined by comparative modeling. The model obtained showed a good
quality, possessing 78.6% of amino acids in energetically allowed regions. The model was then submitted for DM simulation and showed a good geometric quality (91.1% Ramachandran plot). The active site of the enzyme was found to be extremely well conserved. This model will be useful for developing new inhibitors against witches’ broom disease.
Keywords: pyrophosphorylase, Moniliophthora perniciosa, kinetic characterization, heat
Introduction
Moniliophthoraperniciosa, the causative agent of the
witches broom disease in Theobroma cacao, is responsible
for major crop losses in South American and Caribbean cocoa plantations.1,2 In 1989, witches broom disease of
cocoa was identiied in Bahia, the leading cocoa-growing region in Brazil.2 In less than 10 years, production shrank
from 383,000 tons (1987-88) to an estimated 150,000 tons (2002-03).1 Consequently, Brazil slipped from third to
ifth largest cocoa-producing country in the world.1 The
M.perniciosa pathogen is a hemibiotrophic basidiomycete
with two distinguishable phases in its life cycle: a primary, monokaryotic and biotrophic phase, followed by a secondary, dikaryotic but saprophytic stage.1,3
UDP-N-acetylglucosamine (UDP-GlcNAc), the
nucleotide-activated form of N-acetylglucosamine,
plays an important role in the biochemistry of all living organisms. In bacteria, it is required for the biosynthesis of essential cell envelope components, namely peptidoglycan, lipopolysaccharides, and teichoic acids, and for the formation of the enterobacterial common antigen.1 UDP-N
-acetylglucosamine pyrophosphorylase (UAP, EC 2.7.7.23) is a key enzyme in prokaryotes and eukaryotes that condenses
N-acetylglucosamine-1-phosphate (GlcNAc-1-P) and
uridine-50-triphosphate (UTP) to form (UDP-N-GlcNAc) by the
following reaction: UTP + N-acetylglucosamine-1-phosphate
(GlcNAc-1-P) → UDP-GlcNAc + pyrophosphate (PPi).4,5
In this study, we describe the isolation, partial puriication and biochemical characterization of pyrophosphorylase from M. perniciosa. Furthermore, we have elucidated the
3D structure of the protein by comparative modeling. This study was designed to evaluate an enzymatic model that can be useful for the development of new, more selective and eficient anti-fungal compounds.
Experimental
Reagents
UTP, GlcNAc-1-P, dithiothreitol and pyrophosphatase were purchased from Sigma (St Louis, MO). All the other chemicals used were of high quality analytical grade.
Microorganism and enzyme production
The microorganism used in this study was M. perniciosa
(CCMB0257) and was obtained from the Collection of Cultures of Microorganisms of Bahia (CCMB).
M. perniciosa was maintained on potato dextrose agar
plates at 25 °C. For the production of pyrophosphorylase,
M. perniciosa was grown in vegetative brooms, cultivated in
a special system, with adequate conditions of humidity and temperature, to promote fungal development (basidiocarps) (Figure S1, Supplementary Information).
Extraction of pyrophosphorylase and ammonium sulfate fractionation
The pyrophosphorylase enzyme was extracted from
M. perniciosa and homogenate at 40 ºC using a sodium
phosphate buffer (50 mmol L−1, pH 8.3) containing
0.6 mol L-1 NaCl solution. The ratio of M. perniciosa to
extracting buffer was 1:3 (g mL-1). The homogenate was
squeezed through two layers of gauze and the extract was centrifuged at 10,000 × g per 10 min at 4 ºC to remove
the solid particles.6 The supernatant was brought to 70%
saturation by addition of solid ammonium sulfate, then centrifuged at 10,000 × g for 10 min after standing for 1 h. The precipitate, with high pyrophosphorylase activity, was resuspended in phosphate buffer in the ratio of 1:3 (m/v) and stored at −5 °C.
Enzyme assay
Enzyme activity was determined in 90 µL of a reaction
mixture containing 50 mmol L-1 Tris-HCl (pH 8.3),
5 mmol L-1 MgCl
2, 25 mmol L-1 UTP, 20 mmol L-1
GlcNAc-1-P, 10% (v/v) glycerol, 1 mmol L-1 dithiothreitol,
0.4 units mL-1 pyrophosphatase (Sigma), and approximately
0.1 µg of the enzyme. After incubation at 30 °C for 10 min, 100 µL of the color reagent containing 0.03% (m/v)
malachite green, 0.2% (m/v) ammonium molybdate, and 0.05% (v/v) Triton X-100 in 0.7 mmol L-1 HCl was added
to the reaction mixture, followed by incubation at room temperature for 5 min. Inorganic phosphate derived from pyrophosphate, as a readout of the enzyme activity, was quantiied by measuring optical density at 655 nm.7
Protein determination
Protein concentration was determined by the Bradford method8 using bovine serum albumin (BSA) as a standard.
Chromatographic separation by gel iltration on Sephacryl S-200
elute the column (0.5 mL min-1). Fractions of 1.5 mL were
collected and assayed for pyrophosphorylase activity.
Experimental design
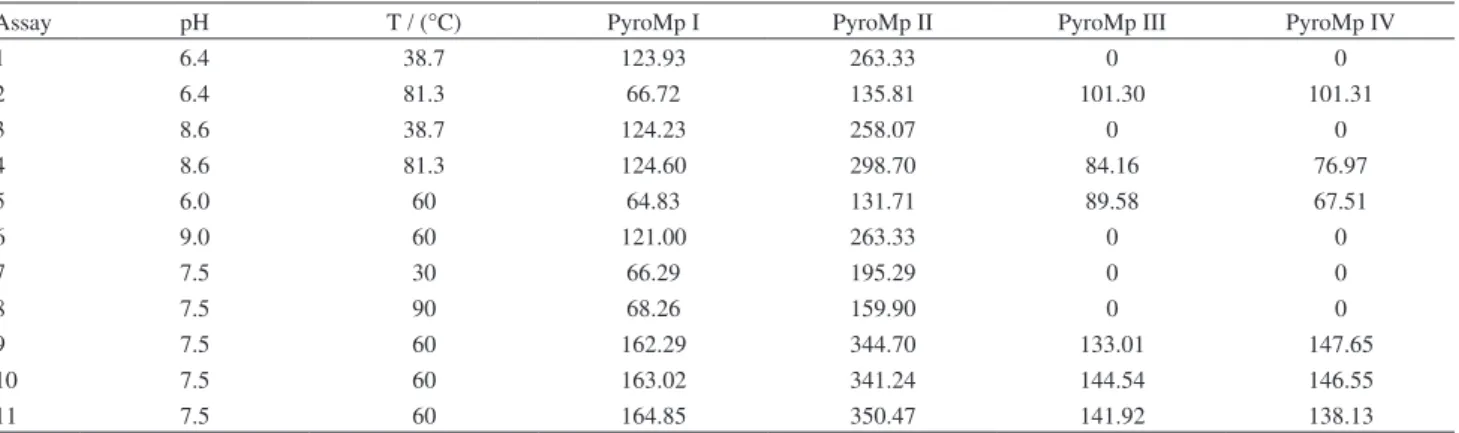
A double-variable, three-level central composite design (CCD) leading to 11 sets of experiments, performed in triplicate, was used to determine the optimal pH and temperature for enzyme activity. STATISTICA 6.0 software (StatSoft, Tulsa, OK) was used to generate the design matrix and to analyze the results. Table 1 shows the design matrix and results obtained for pyrophosphorylase activity.
Kinetic parameters of the enzyme
The effect of substrate concentration was studied by determination of initial rates (V0) of enzyme activity in the presence of various concentrations of acetylglucosamine-1-phosphate (10, 15, 20, 25, 25 and 30 µmol L-1). The K
m
values and the maximum rates (Vmax) were determined using
a Lineweaver-Burk double-reciprocal plot.
Replications and statistical analysis
The extractions and chromatographic isolations were repeated at least three times. Significant differences between sample means were tested.
Primary structure determination
The primary structure of pyrophosphorylase was obtained from Laboratório de Pesquisa Microbiológica (LAPEM) of Universidade Estadual de Feira de Santana (UEFS). The sequences identiied in the genome of M. perniciosa (http://bioinfo01.ibi.unicamp.br/vassoura/)9
were analyzed using specific software available on free sites.9 BLAST was used for analysis of sequence
similarity.10 The translation of the amino acid sequences,
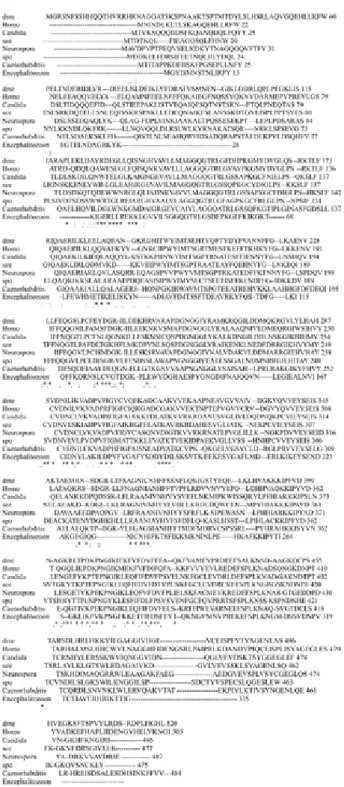
analysis of domains and conserved regions beyond the alignmentof sequences (Figures S2, S3, S4 and S5) were determined using tools from ExPASy. 11
Theoretical determination of molar mass and pI determination
The pyrophosphorylase sequence was submitted to ExPASy’s Compute pI/Mw programfordetermination of molecular mass and pI.12
Structural determination
The sequence was submitted to BLAST against proteins present in the Protein Data Bank (PDB) to select known proteins as templates for structure prediction.10 The
prediction of the 3D structure of pyrophosphorylase was performed by comparative modeling, and the 3D model of the protein was constructed according to the BioMedCache protocol as described below.13-15 In order to detect the most
energetically favored 3D structure, a modiied strategy for searching the conformational space more thoroughly was needed. The resultant protein structure was reined through a set of cycles of optimization using the steepest descent and conjugated gradient (SD/CG) and molecular dynamic (MD) simulation. The convergence criteria used were 300 cycles and/or 0.001 kcal mol-1, and 14 Å was
used as the cutoff value for non-bonded interactions. Later, the main chain and the alpha-helix were ixed during a simulation of 1,000 K, following another cycle of optimization (SDCG). Then, several MD simulations of 600 K were carried out and the atomic coordinates of the alpha-helix were unlocked one by one in a systematic fashion, always intercalated with the optimization process. After all the alpha helixes were ‘relaxed’, the inal MD was performed. MD simulations were executed during
Table 1. Experimental design used in optimal pH and temperature determination and results
Assay pH T / (°C) PyroMp I PyroMp II PyroMp III PyroMp IV
1 6.4 38.7 123.93 263.33 0 0
2 6.4 81.3 66.72 135.81 101.30 101.31
3 8.6 38.7 124.23 258.07 0 0
4 8.6 81.3 124.60 298.70 84.16 76.97
5 6.0 60 64.83 131.71 89.58 67.51
6 9.0 60 121.00 263.33 0 0
7 7.5 30 66.29 195.29 0 0
8 7.5 90 68.26 159.90 0 0
9 7.5 60 162.29 344.70 133.01 147.65
10 7.5 60 163.02 341.24 144.54 146.55
50 ps, except for the last one, for which a MD simulation of 100 ps was performed.15,16 The equilibrium model
was validated by Ramachandran plot.17 All calculations
were carried out using a MM3force ield in the vacuum implemented in BioMedCache 6.1 through the NVT ensemble.15, 17,18
Results and Discussion
Puriication of pyrophosphorylase
Pyrophosphorylasewas extracted from M. perniciosa
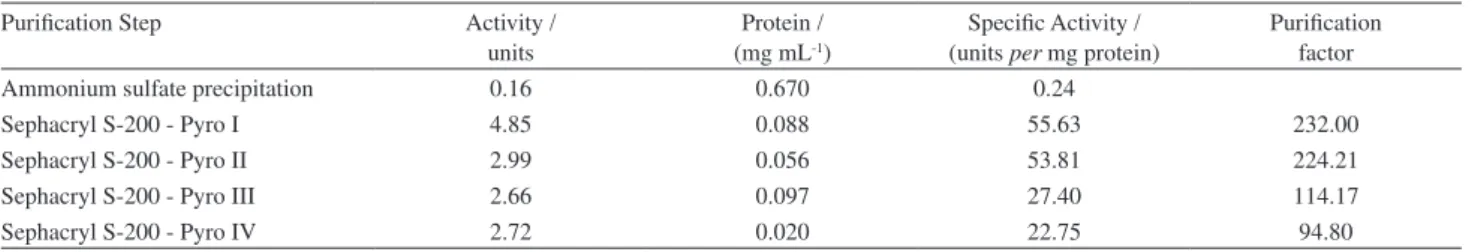
as described in Experimental.The puriication consisted of only two steps: ammonium sulfate precipitation and gel filtration. After ammonium sulfate precipitation, pyrophosphorylase was eluted on a Sephacryl S-200 column equilibrated with sodium phosphate buffer. The samples were then re-eluted on Sephacryl S-200 and showed four different, numbered I-IV. The result of this step was a puriication fold of 232 for isoform PyroMp I, a puriication fold of 224.1 for PyroMp II, a puriication fold of 114.17 for PyroMp III, and a puriication fold of 94.80 for PyroMp IV (Figure 1 and Table 2). Only a few studies have previously reported puriication of pyrophosphorylase. De Luca et al.19 puriied the cloned enzyme and obtained
one puriication factor of 46.8. Bulik et al.20 obtained one
puriication factor of 170 for the pyrophosphorylase from
Giardia intestinalis.
Optimal pH and temperature determination
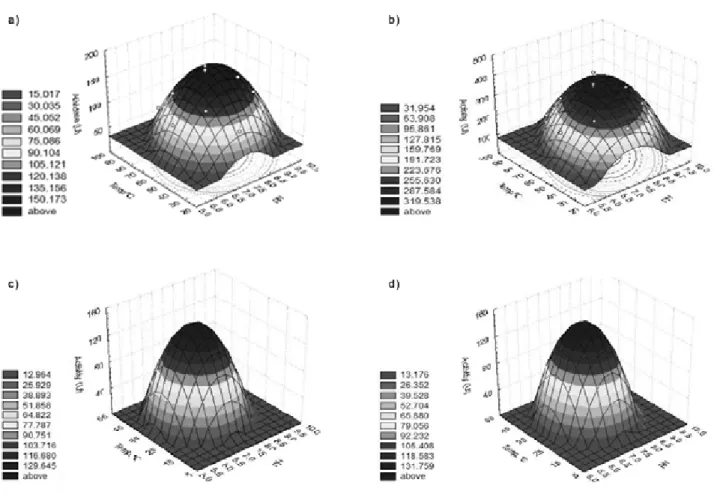
Table 2 and Figure S6 show pyrophosphorylase activities over a range of pH and temperature. PyroMp I had an optimal pH in the range of 7.3-8.3 and optimal temperature of 52-66 °C. The optimal pH and temperature for PyroMp II were 7.4-8.4 and 51-68 °C, respectively. PyroMp III activity showed optimal pH and from 7.0-7.5 and optimum temperature in the range of 30-36 °C. Finally, the optimal pH for PyroMp IV activity was in the range of 6.9-7.7 and optimal temperature was between 28 °C to 37 °C. These results are similar to those of Pattabiraman and Bachhawat,21 who reported activity over
a great range of pH, with the optimum around 8.0, for the enzyme extracted from the sheep brain. Szumilo et al.22
found an optimal pH of around 8.5 for pyrophosphorylase extracted from pig liver, De Luca et al.19 showed a
maximum of activity between pH 8-9, and Strominger and Smith23 reported a pH optimum of 7.2 for the enzyme
derived from Staphylococcus aureus.
Kinetic parameters of pyrophosphorylase
The Km (Michaelis constant) values of the
pyrophosphorylase were determined after gel iltration on Sephacryl S-200. These values were calculated from Lineweaver-Burk double-reciprocal (1/V versus 1/[S])
plots (Table 3, Figure 2). The Km values were 3.54 µmol
for PyroMp I, 13.97 µmol for PyroMp II, 4.22 µmol L-1
for PyroMp III, and 13.30 µmol for PyroMp IV. These Km
values are consistent with previously reported values7. The
Vmax showed values ranging from 27.03 to 30.30 µmol min-1.
Theoretical determination of molar mass and pI determination
The PyroMp pyrophosphorylase (C2475N747O754P4S17) had a mass of 52.9 kDa (52922.824 Da) and pI value of 9.0. In comparison, the mass of native pyrophosphorylase from encysting Giardia intestinalis was reported to be 66 kDa.20
Table 2. Extraction and puriication of pyrophosphorylase
Puriication Step Activity /
units
Protein / (mg mL-1)
Speciic Activity / (units per mg protein)
Puriication factor
Ammonium sulfate precipitation 0.16 0.670 0.24
Sephacryl S-200 - Pyro I 4.85 0.088 55.63 232.00
Sephacryl S-200 - Pyro II 2.99 0.056 53.81 224.21
Sephacryl S-200 - Pyro III 2.66 0.097 27.40 114.17
Sephacryl S-200 - Pyro IV 2.72 0.020 22.75 94.80
Figure 1. Puriication of pyrophosphorylase from M. perniciosa on
Primary sequence determination
Amino acid sequence obtained is shown in Figure S7.
Structural determination of pyrophosphorylase
Two proteins with similar sequences to PyroMp with known three-dimensional structures were identiied as a result of the BLASTp search against the Protein Data Bank (PDB), 1VM8 and 1JV1. 1VM8 showed 47% identity, 2.50 Å of resolution, and an R-Free value of 0.266, while 1JV1 had 46% of identity, 1.90 Å resolution, and an R-Free value of 0.220. Both structures were selected to use in the construction of the 3D model of M. perniciosa pyrophosphorylase.
Two regions of 1JV1 do not have known tertiary structure, probably due to the presence of a lexible loop.24 The irst
region, comprising residues 56 and 68 (Phe57, Asn58, Gln59, Ser60, Ser61, His62, Gln63, Lys, Asn65, Val66, Asp67 and Ala68) was denoted as GAP1, and the second region, composed of the Lys502, Asn503, Gly504 and Ile505 residues, was called GAP2 (Figure S7). In order to produce a working full 3D structure of 1JV1 to use as a template, molecular mechanics (MM) and molecular dynamics (MD) simulations were carried out to elucidate the correct atomic coordinates for the potential surface energy. An initial set of atomic coordinates for both regions were constructed using the BioMedCache program.15 Then, an optimization using an
MM3 force ield was performed for each region using 300 cycles and a gradient of 0.001 kcal mol-1 as the criterion of
convergence. The optimized determined structures of GAP1 and GAP2 are indicated in Figure 3.
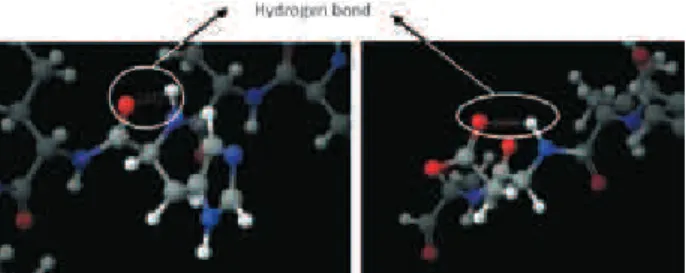
The structural quality of the GAP regions was veriied by Ramachandran plot. GAP1 and GAP2 show 60% and 100% of amino acids in energetically favorable regions, respectively (Figure S8). The lower value obtained for GAP1 can be explained by formation of two hydrogen bonds. His6 of GAP1 is not in a favorable region probably due to the formation of a hydrogen bond between the carbonyl oxygen (O32) and the hydrogen amine (H155). The same may be true for Asp11, in which a hydrogen bond is formed between carbonyl oxygen (O87) and amine group (H88) (Figure 4).
The optimized GAPs were subjected to MD simulation using the following parameters: time step of 1 fs, period of simulation of 100 ps, and constant dielectric of 1.5. The simulations were initiated 100 K and the system was successively ‘warmed’ to 200 K and 300 K. Table 4 shows the energy values relative to the end of each dynamic simulation. As shown, the bonds were relaxed and a most energetically favored 3D structure of GAP1 was obtained at the end of simulation. Each simulation of MD generated about 1,000 different structures, and the structures with Table 3. Kinetic parameters of puriied pyrophosphorylase
Fraction Km / (µmol L-1) Vmax / (µmol L-1per min)
PyroMP I 3.54 27.03
PyroMP II 13.97 30.30
PyroMP III 4.22 28.01
PyroMP IV 13.30 29.41
Figure 2. Lineweaver-Burk plots of activity as a function of substrate concentration
Figure 3. 3D structures of GAP 1 and 2 after optimization for MM3.
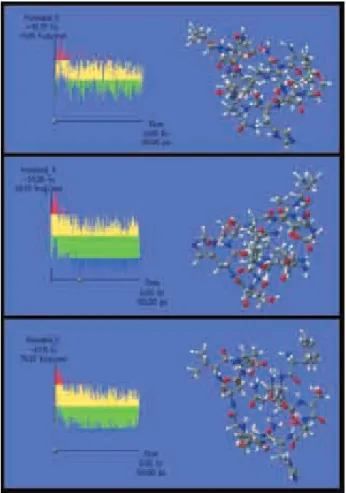
lowest energy was used in the following simulation. These were selected based on plots of the energy generated at the end of each calculation. The structure for GAP1, using an initial temperature of 100 K, showed that the molecule has a spatial distribution (Figure 5) compared with the initial linear structure (Figure 3). When the generated structure was subjected to the following simulation at 200 K, an increase in the number of molecules in more energetically stable conformations was seen, as shown in the bolded and zones in the graph (Figure 5). Similar results were obtained from MDs with temperatures of 300 K (Figure 5). This indicates that at the end of the procedure, the conformer obtained had an energetically favorable geometry.
The conformers obtained in the three simulations were evaluated with regard to the stereochemical quality of the main chain using Ramachandran plots. At 300 K, the greatest number of amino acids (60%) were in the energetically favorable region (Figure S9A), compared to 200 K (40%) (Figure S9B). In all three simulations, His6 remained in an energetically favorable region, which can be explained by the formation of a hydrogen bond linking between O32 and H155 of this amino acid (Figure 4). This occurred over the period of time it took for the generated conformers at 300 K to jump rotational energy barriers and adopt a lower energy conformation. The same procedures described for GAP1 were used to analyze GAP2. The results of the molecular dynamics for GAP2 are shown in Figure S10.
Based on the MD calculations, it was possible to determine the spatial conformation of each of the regions whose structure had not been elucidated by X-ray crystallography.24 The lowest energy conformers of
GAP-1 and 2 obtained in the DM (300 K) were inserted into the chain of 1JV1. This insertion took into account the addition of amino acids and, later adjustment of the angles phi and psi, and results were obtained from the calculations of DM. After the insertions, the molecule was neutralized by tLeap, which added Na+ ions to the structure.
Following neutralization, the molecule was optimized and implemented by the MM3 method in the BioMedCache program. Optimization was veriied by the structural quality of Ramachandran plot. Figure S11 shows a sample where 100% of amino acids are in energetically favorable regions, indicating a good structural quality.
Construction
BioMedCache was used to optimize the construction of the pyrophosphorylase structure models. Model construction began with the comparison of 1VM8 and 1JV1 sequences using the program CLUSTAL W. This alignment showed 11 gaps and two insertions. 1JV1 contains 506 amino acids, whereas pyrophosphorylase has 456 amino acids. The difference in the size was taken into consideration in constructing the model, and it was necessary to incorporate insertions or deletions during the construction stage. Sequence alignment between the template and target showed conserved regions, semi-conserved and non-semi-conserved regions (Figure S12).
The inal model, MCJ4, included additional amino acids in the GAP regions and deletion of three amino acids in the sequence (Ser156, Ala157 and Gly158). In this way, we were able to obtain two sequences of comparable size and to conserve the angles phi and psi, generating a model Table 4. Found values of relative energy for GAP 1 and 2, after the
calculations of molecular dynamics
Temperature / K Energy / (kcal mol-1)
GAP 1 GAP 2
100 18.59 40.79
200 22.17 40.79
300 0.0 0.0
without apparent space problems. The new alignment with substitutions is shown in Figure S13.
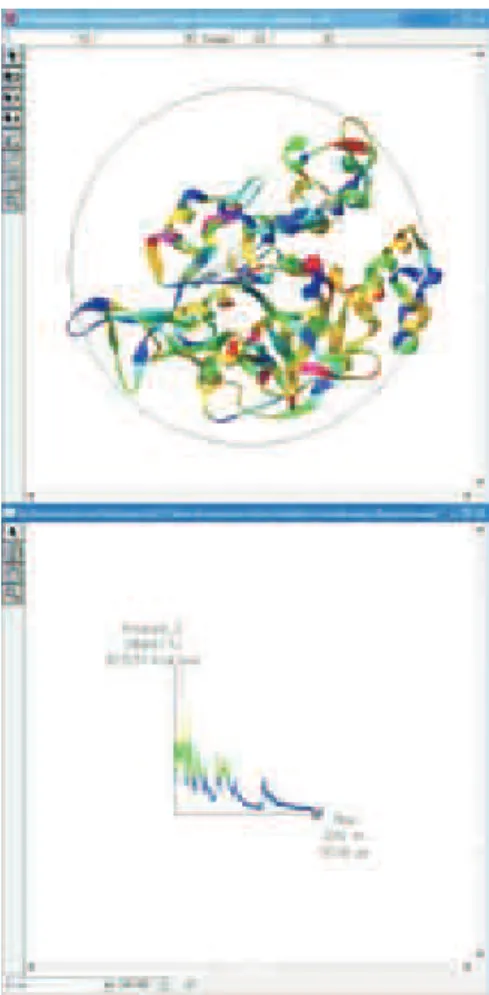
The resulting model was analyzed, and was not found to have structural abnormalities in the protein. The MCJ4 model contains 13 alpha helices, four of these of the helix 310 subtype (Figure 6). It was possible to verify 24 beta sheets in the structure of MCJ4, 15 of the parallel type (segments oriented in the same direction) and nine of the antiparallel type (adjacent segments oriented in opposing directions). Additionally, some beta sheets were very short comprising, in some cases, only two amino acids (Figure 6). Notably, this protein belongs to α+ βfamily, in which alpha helices and beta sheets do not have a speciic order in the protein structure.
Optimization of the model
This model was optimized by molecular mechanics (MM steepest descent) followed for conjugate gradient resulting in a inal energy of –2.25 10-3 kcal mol-1. The
geometric quality was analyzed by Ramachandran plots generated by the program PROCHECK (Figure S14). The generated model possessed 78.6% of amino acids in energetically allowed regions, 16.3% in favorable regions, 3.5% in generously allowed regions and 1.6% in non-allowed regions. The value of RMS of 1.17 was obtained between 1JV1 and MCJ4 for the overlap of C .
The model was then subjected to DM simulation, to verify its stability, thermodynamics, and to search for one conformer of lower potential energy on the surface. It is possible to observe the movement of individual particles and the measure the simulation over time. The results of the dynamic simulations are indicated in Figure 7. In this way we were able to verify a reduction in energy values, which can be measured as the simulation develops. The region bolded (Figure 7) represents conformers that possess high energy of formation, whereas the regions in blue indicate structures of lower energy. The majority of the structures observed in Figure 7 met inside this region.
The lower energy conformer was analyzed with regard to its geometric quality. The Ramachandran plot shows that 91.1% of amino acids met in energetically favorable regions (core region); only 2.8% were located in favorable regions (Figure S14). This indicates that the model achieved a good geometric quality after the DM simulations. Additionally, the model did not lose its tertiary structure after the completion of calculations, showing thermodynamic stability.
Localization of the active site in the constructed models
The active site was determined by insertion of the atomic coordinates of the ligand, UDP-N-acetylglycosamine, into
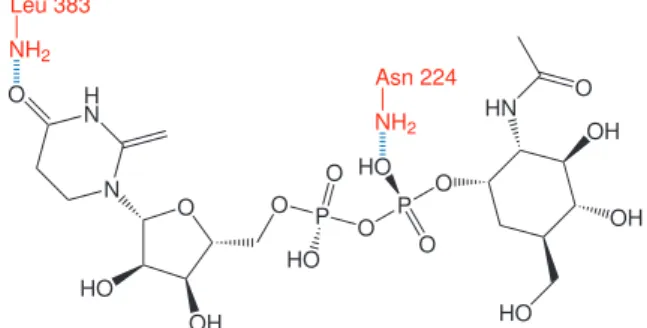
the model, guided by active site of the template protein. All amino acids within 5 Å of the ligand are shown in Figure S15. This methodology was implemented by BioMedCache 6.1. Based on these analyses, we propose that the following residues are crucial for the pyrophosphorylase reaction: Leu108, Gly111, Gly112, Gln197, Gly223, Asn224, Asp254, Gly291, Glu304, Tyr305, Asn328, His331, Phe381, Phe383 and Lys408.25,26 The osidic portion
of the UDP-N-acetylglycosamine establishes numerous
hydrogen bonds with Glu304, His331 and Asn224, and Figure 6. MCJ4 model.
has hydrophobic interactions with Phe381 and Phe383. Grouping UDP is transferred to the acetylglycosamine via a half-conserved region composed for the following residues: Leu-X2-Gly-X-Gly-Thr-X-Met-X4-Pro-Lys.25
The active site of the enzyme model is extremely well conserved. However, the regions between residues 379-384 and 403-409 showed no similarity. In addition, the constructed models do not show the phenylalanine residues necessary for the hydrophobic interactions. As shown in the Ramachandran plot (Figure S14), the amino acids that are outside of the energetically favorable region (core region) are part of the active site model constructed here. Thus, we can conclude that the amino acids of the active site of the enzyme have an energetically favorable conformation.
The anchorage of the ligand in the model was ascertained using the approach between the ligand and the amino acids that make up the active site of the enzyme (Figure S15). This process was carried out by means of the comment of the coordinates of the ligand complexes with the protein template (1JV1), and considering the amino acid keys as described previously (Figure S16).
The optimization of the enzyme-ligand complex model was performed with the objective of reducing proximal interactions and to observe the possible hydrophobic and hydrophilic associations, if any were formed. In this way, we showed the formation of hydrogen bonds between the amino groups of residues Asn224 and Leu383 with oxygens 22 and 29 of the ligand (Figure 8). These two amino acids have been shown to be important for substrate binding to the active site of pyrophosphorylases. We therefore surmise that the Asn224 and Phe383 residues are critical for coupling the ligand to the active site of the enzyme, via hydrogen bond and hydrophobic interactions.24,26 Interactions of this type were also observed
in the constructed model. The hydrophobic interactions that occur in the active site of pyrophosphorylase derive mainly from a hydrophobic pocket formed by two phenyl rings of phenylalanine in positions 381 and 383; however, the constructed model does not show this hydrophobic pocket.37
In MCJ4, positions 381 and 383 were glycine and leucine, respectively. It is worth noting that position 383 in the MCJ4 model corresponds to a leucine rather than a phenylalanine, as described by Peneff et al.24 However, these residues retain
chemical proximity, and both are hydrophobic and commonly occur in alpha helices and beta sheets.
In order to identify the main interactions that contribute to protein-ligand association, the highest occupied molecular orbital (HOMO) and lowest unoccupied molecular orbital (LUMO) of the border atoms were determined by calculation of a single point (without optimization of geometry) by the MOZYME-PM5 method.
As shown in Figure S17A, the HOMO orbital was situated essentially in the oxygen of Glu304 (–7.25 ev), while the LUMO orbital was situated in the corresponding atoms (–3.20 ev) of the ligand. The position of these orbital species was not modiied when the active site and the ligand were calculated separately (Figure S17). These results suggest that the mechanism of action for the pyrophosphorylase enzyme: the pair of electrons of the glutamine oxygen can carry out a nucleophilic attack on that of the ligand, causing its hydrolysis.
This structural information can be taken into consideration for the development of new, specific inhibitors of fungal pyrophosphorylase.
Supplementary Information
Supplementary data are available free of charge at http://jbcs.sbq.org.br as a PDF ile.
Acknowledgments
This work was supported by FINEP, CAPES, CNPq and FAPESB. We also thank the Programa de Pós-Graduação em Biotecnologia UEFS/FIOCRUZ.
References
1. Kilaru, A., Hasenstein, K. H.; Phytopathology2005, 95, 101.
2. Macedo, V. U. M.; Santos Jr, M. C.; Taranto, A. G.; Assis, S. A.; Sitientibus, ser. Ci. Biol.2009, 9, 57. (http://www2.uefs.br/
revistabiologia/pg9_n1.html)
3. Purdy, L. H; and Shmidt, R. A.; Annu. Rev. Phytopathol.1996,
34, 573.
4. Mok, T. S; Edwards, M. R.; Anal. Biochem. 2005, 343, 341. 5. Maruyama, D.; Nishitani,Y.; Nonaka, T.; Kita, A.; Fukami, T.A.;
Mio, T.; Yamada-Okabe, H.; Yamada-Okabe, T.; Miki, K.; Acta Crystallogr.2006, 62, 1206.
6. Assis, S. A.; Martins, A. B. G.; Guaglianoni, D. G.; Oliveira,
O. M. M. F.; J. Agric. Food Chem.2002, 50,4103.
Figure 8. Hydrogen bonds (blue) between amino acids (red) identifying the optimization of the MCJ4-ligand complex.
7. Mio, T.; Yabe, T.; Arisawa, M.; Yamada-Okabe, H; J.Biol. Chem.1998, 273,14392.
8. Bradford, M. M.;Anal. Biochem.1976, 72, 248.
9. http://bioinfo01.ibi.unicamp.br/vassoura/ accessed in August 2008.
10. http://ncbi.nlm.nih.gov/BLAST/ accessed in April 2009. 11. http://au.expasy.org/tools/dna.html accessed in August 2009. 12. Bjellqvist, B.; Hughes, G. J.; Pasquali, Ch.; Paquet, N.;
Ravier, F.; Sanchez, J.-Ch.; Frutiger, S.; Hochstrasser, D. F.;
Electrophoresis 1993, 14, 1023.
13. Altschul, S. F., Gish, W., Miller, W., Myers, E. W., Lipman, D. J.; J. Mol. Biol.1990, 215, 403.
14. Goldsmith-Fischman, S.; Honig, B.; Protein Sci.2003, 12, 1813.
15. Fujitsu; BioMedCaChe Protein-Drug Discovery Modeling Software on Windows, Fujitsu: Sunnivale, 2003.
16. Šali,A.; Blundell T. L.; J. Mol. Biol.1993, 234, 779.
17. Ramachandran, G. N., Sasisekharan, V.; Adv. Protein Chem.
1968, 23, 283.
18. Allinger, N.; Lii, J. H.; J. Comp. Chem.2004, 12, 186.
19. De Luca, C.; Lansing, M.; Crescenzi, F.; Martini, I.; Shen, G. J.; O’Regan, M.; Wong, C. H; Bioorg. Med. Chem.1996, 4, 131.
20. Bulik, D. A.; Lindmark, D. G.; Jarroll, E. L.; Mol. Biochem. Parasitol.1998, 95, 135.
21. Pattabiraman, T. N.; Bachhawat, B. K.; Biochim. Biophys. Acta
1961, 54, 273.
22. Szumilo, T.; Zeng, Y.; Pastusza, I.; Drake, R.; Szumilo, H.;
Elbein, A. D.; J. Biol. Chem. 1996, 271, 1347.
23. Strominger, J. L.; Smith, M. S.; J. Biol. Chem.1959, 234, 1822.
24. Peneff, C.; Ferrari, P.; Charrier, V.; Taburet, Y.; Monnier, C.; Zamboni, V.; Winter, J.; Harnois, M.; Fassy, F.; Bourne, Y;
EMBO J.2001,20, 6191.
25. Olsen, L. R.; Roderick, S. L.; Biochemistry 2001, 40, 1913.
26. Pompeo, F. Bourne, Y.; van Heijenoort, J.; Fassy, F.; Mengin-Lecreulx, D; J. Biol. Chem. 2001, 276, 3833.
27. Santos Jr., M. C.; Taranto, A. G.; Assis, S. A.; Góes-Neto, A.;
Int. J. Bioinform. Res. Appl.2009, 5, 133.
Submitted: June 11, 2010 Published online: February 10, 2011
Supplementary Information
S
I
J. Braz. Chem. Soc., Vol. 22, No. 6, S1-S10, 2011.
Printed in Brazil - ©2011 Sociedade Brasileira de Química 0103 - 5053 $6.00+0.00
*e-mail: [email protected]
Puriication, Characterization and Structural Determination of UDP-
N-
Acetylglucosamine
Pyrophosphorylase Produced by
Moniliophthora perniciosa
Manoelito C. Santos Junior,a Priscila A. Gonçalves,a Alex G. Taranto,b Maria G. B. Koblitz,c
Aristóteles Góes-Neto,d Carlos P. Pirovani,e Júlio C. M. Cascardo,e Sandra H. da Cruz,f
Russolina B. Zingali,g Gonçalo A. G. Pereira,h Cristiano V. Diasd and Sandra A. de Assis*,a
aDepartamento de Saúde, cDepartamento de Tecnologia and dDepartamento de Ciências Biológicas,
Universidade Estadual de Feira de Santana, 44031-460 Feira de Santana-BA, Brazil
bLaboratório de Bioinformática, CCO, Universidade Federal de São João Del-Rei,
35501-296 Divinópolis-MG, Brazil
eLaboratório de Genômica e Expressão Gênica, DCB, Universidade Estadual de Santa Cruz,
45650-000 Ilhéus-BA, Brazil
fDepartamento de Agroindústria, Alimentos e Nutrição, Escola Superior de Agricultura Luiz de Queiroz,
ESALQ, Universidade de São Paulo,13418-900 Piracicaba-SP, Brazil
gCentro de Ciências da Saúde,Universidade Federal do Rio de Janeiro, Ilha do Fundão,
21941-590 Rio de Janeiro-RJ, Brazil
hInstituto de Biologia, Universidade Estadual de Campinas, CP 6109, 13083-970 Campinas-SP, Brazil
Primary Structure Determination
Sequence data genomic of M. perniciosa
The strategy adopted by the Genome Project for sequencing the fungus M. perniciosa genome was to assemble a library of shotgun genomic DNA (gDNA) and sequence fragments (reads) selected at random (Figure S2), then to compare each read with genes deposited in GenBank using the tBLASTx1 program from the National Center
for Biotechnology Information (NCBI)2 to ind signiicant
similarity between sequenced reads and known genes. This favors the identiication and characterization of genes, which can be done during sequencing, without the need to complete assembly of the genome, thus saving time and money.
With the development of the genome project of
M. perniciosa, a bioinformatics system was constructed at UNICAMP that automated the entire process of acquiring and comparing sequences, creating a friendly interface through which researchers from various ields can explore the database with the aid of simple tools (such as search by keyword). This allowed the location of reads that had some similarity to sequences already characterized, as well as genes that code for the UDP-N-Acetylglucosamine pyrophosphorylase.
Search for sequences homologous to UDP-GlcNAc pyrophosphorylase in eukaryotic organisms
Through a search for keywords in the NCBI website (http:// www.ncbi.nlm.nih.gov/) the following cDNA sequences were identiied: UAP1 Homo sapiens (AC: NM_003115), (AC: NM_003115), Drosophila melanogaster (AC: NM_164690),
Caenorhabditis elegans (AC: NM_065376), Neurospora
crassa (AC: EAA34867), Schizosaccharomyces pombe (AC: NP_596832), Saccharomyces cerevisiae (AC: NP_010180),
Candida albicans (AC: AB011003) and Encephalitozoon cuniculi (AC: AL590450). These sequences were used to infer the organizational structure of the gene encoding the enzyme UDP-GlcNAc pyrophosphorylase (EC: 2.7.7.23) of M. perniciosa. These were also used to identify the locus for each enzyme in the genomes by BLAST search (Altschul et al.1).
Sequence analyses
In the search for conserved regions, a comparison of the amino acid sequences was achieved using the alignment program CLUSTAL W 1.82 (http://www. ch.embnet.org/software/ClustalW.html)3 from the European
Bioinformatics Institute (EBI). Possible conserved domains were inferred using the programs from the PROSITE database (http://us.expasy.Org/PROSITE/)4 and Prodomo (http://
protein.toulouse.inra.fr/prodom/2002.1/htm/home.php).5
Pfam (http://pfa m.wustl.edu / hmmsearch.shtml)6 was used to
conirm the protein family to which the contig had been linked.
Results
Searching sequences
The search for sequences similar to UDP-GlcNAc pyrophosphorylase led to identiication of six sequences (reads), which allowed the formation of a contig (Table S1).
Alignment
Taking into account the consensus region proposed by Mio et al.7 for all UDP-sugar pyrophosphorylases ([L (X)
2GXGTXM (X) 4PK], where X represents any amino acid), and their probable involvement in the catalytic activity of the enzyme, an alignment with UDP-GlcNAc pyrophosphorylase eukaryotic was already identiied ( Figure S2), which allowed the region to propose a likely consensus sequence [(A / S) GGQXTRLG (X) 3PKG] for eukaryotic UDP-GlcNAc pyrophosphorylases (Figure S3).
Analysis of contig
The contig generated from the reads, located in the database of the M. perniciosa Genome Project, has a length of 1739 base pairs. A tBLASTx against the world bank of genes, the NCBI GenBank, was performed to search for similar sequences. The tBLASTx translates the contig in its six possible amino acid sequences (frames and -1-2-3 +1 +2 +3) and these are then compared with the database to look for similarityies. The tBLASTx search revealed two regions of the contig similar to UDP-GlcNAc pyrophosphorylase
N. crassa. The two regions were located in different frames, possibly due to the existence of an intron, which probably changed the reading frame of the polypeptide translated from the DNA sequence.
The deduced amino acids of the exons of the contig and the deduced amino acid gene N. crassa were aligned (CLUSTAL W 1.82) in an attempt to map the coverage of the likely gene contig (Figure S4). We observed coverage of over 50%, comprising virtually the entire C-terminal region of protein
N. crassa (Figure S5).
References
1. Altschul, S. F.; Madden, T. L.; Schäffer, A. A.; Zhang, J.; Zhang, Z.; Miller, W.; Lipman, D. J.; Nucleic Acids Res.1997, 25, 3389. 2. http://www.ncbi.nlm.nih.gov/IEB/Research/Ostell/Spidey/
index.html. Acessed in April 2007.
3. http://www.ch.embnet.org/software/ClustalW.html. Acessed in September 2008.
4. http://us.expasy.Org/PROSITE. Acessed in October 2009. 5. http://protein.toulouse.inra.fr/prodom/2002.1/htm/home.php.
Acessed in April 2007.
6. http://pfa m.wustl.edu / hmmsearch.shtml. Acessed in August 2009.
7. Mio, T.; Yabe, T.; Arisawa, M.; Yamada-Okabe, H.; J. Biol. Chem.1998, 273, 14392.
Table S1. Number of reads identiied with possible similarity with the enzyme UDP-GlcNAc pyrophosphorylase. The search for sequences performed through the database of the Genome Project M. perniciosa
Reads Selected Similarity (BLAST)
CP02-PF-000-002-E09-UE.R Similar to gene Qri1p of
Saccharomyces cerevisiae
CP02-S2-000-085-C01-UC.F Similar to gene BcDNA.LD24639 of
Drosophila melanogaster
CP02-S2-028-248-F09-UE.R Similar to gene Qri1p of
Saccharomyces cerevisiae
CP02-S2-033-367-F08-UE.F Similar to gene Ugp1p of
Saccharomyces cerevisiae
CP02-S2-000-024-F07-EM.R Similar to gene AgX1 of Homo sapiens
Figure S2. Clustering process. The sequences of reads similar to UDP-GlcNAc pyrophosphorylase were aligned by the algorithm pHeader Pharpar, which seeks areas of consensus (or overlap). This enables a group to form a larger sequence, increasing the coverage area of the gene.
Figure S4. Comparison of the likely domain of UDP-GlcNAc pyrophosphorylase. The amino acid sequences from H. sapiens, D. melanogaster, C. elegans, N. crassa, S. pombe, S. cerevisiae, C. albicans and E. cuniculi were aligned using the program CLUSTAL W 1.82. Amino acids identical among all proteins are highlighted in red. The likely binding site for N-Acetylglucosamine-1-phosphate is indicated by the arrow, and the consensus sequence [(A / S) GGQXTRLG (X) 3PKG] was deined for all UDP-GlcNAc pyrophosphorylases.
Figure S6. Surface plots of activity of M. perniciosa as a function of temperature (°C) and pH: A) PyroMp I; B) PyroMp II; C) PyroMp III; D PyroMp IV.
Figure S8. Ramachandran plot of GAP1 (A) and GAP2 (B).
Figure S12. Alignment by Clustal W between the protein 1JV1 and the sequence problem. “*” denotes conserved residues. “:” denotes conserved substitutions. “.” denotes half-conserved region,.
Figure S13. Alignment between the 1JV1 template and the sequence of pyrophosphorylase. The rectangles indicate the regions where amino acids have been inserted into the sequence of pyrophosphorylase.
Figure S15. Active site of MCJ4 model.
GAP 1 GAP 1
Figure S16. (A) Localization of the ligand in the active site of the MCJ4 model. (B) Detail of the ligand and the amino acids that are part of the active site of the enzyme.