Corresponding author: Maria Inez G. Miranda, Instituto de Química, Universidade Federal do Rio Grande do Sul – UFRGS, Av. Bento Gonçalves, 9500, Bairro Agronomia, CP 15003, CEP 91501-970, Porto Alegre, RS, Brasil, e-mail: [email protected]
Introduction
In recent years there has been an increasing interest in the development of new applications of materials obtained from renewable sources. It was showed for example that thermosets can be obtained by curing epoxy resins produced by the epoxidation of vegetable oils[1,2]. Another example is cellulosic materials, since cellulose is the most abundant organic polymer in the planet and recently has been used in nano and microcellulose fibers-filled epoxy systems[3]. In a previous publication[4], we studied the role of hydroxypropyl cellulose (HPC), a cellulose ether, inside an epoxy matrix during the formation process of the epoxy network by differential scanning calorimetry (DSC). On the beginning of the reaction we concluded that HPC in the epoxy matrix acts as an accelerator-catalyst resulting in an acceleration factor of about 30%. Beyond the minimum temperature Tmin – which is defined as the temperature corresponding to the minimum point showed by the exothermic peaks during the curing reaction of an epoxy system measured by DSC – the behaviors of the rate constant (k) and the frequency factor (A) indicate that the crosslinking process becomes slower with HPC acting as an inhibitor of the reaction.
The aim of this study is to investigate the dynamic mechanical properties of epoxy-amine systems crosslinked in the presence of hydroxypropyl cellulose (HPC) in order to achieve information about the evolution of relaxations already existing and detect new characteristic transitions. The transitions originating from the epoxy matrix and HPC as well as the possible modifications caused in these transitions by the presence of the other compound in the mixture can be detected by DSC and DMTA. Bearing in mind that DSC was previously employed in the investigation of the curing kinetics of this epoxy-amine/HPC system[4], the remarkable sensitivity of DMTA towards primary and secondary molecular relaxations will be highlighted here. The relaxations were investigated in systems with HPC contents from 0 to 10 wt. (%) since phase separation took place at higher HPC contents as observed in our earlier DSC experiments.
Considering that DMTA curves are affected by the frequency of the applied deformation, the shift in the position of the maxima of the peaks can be related to the activation energy of the relaxation[5]. These curves can be analyzed using an Arrhenius-type expression,
taking the temperature T at which the tan δ or E” reach their maxima over a range of frequencies. The Arrhenius plot can thus yield the activation energy (Ea) for what is termed the relaxation process. In the last years the Arrhenius equation has been applied to various polymer systems aiming the determination of the activation energy of some relaxations, as for example the glass transition, due to the application of Arrhenius equation in the prediction of long-term material performance[6-14]. It was also reported that monitoring the activation energy of the glass transition can be useful for detecting changes due to material aging[10].
In this work it was studied in glassy region the primary (α) and secondary (β, γ) relaxations originating from both the epoxy and HPC components and their mutual interactions.
Experimental
The diglycidylether of bisphenol-A, DGEBA (CY-205, Ciba-Geigy) was cured with a stoichiometric amount of a tetrafunctional aromatic diamine, 4,4’-diaminodiphenylmethane, DDM (HT-972, Ciba-Geigy). The epoxy monomer is a viscous resin with an epoxide equivalent weight (EEW) of 182-196 g/eq. and n’= 0.14 (data furnished by manufacturer), where n’ represents the degree of polymerization. The amine curing agent is a crystalline solid (melting point of 90 °C) with an amine equivalent weight of 99g/eq. A molar ratio 2:1 (DGEBA/DDM) was used which corresponds to the stoichiometric formulation. Hydroxypropyl cellulose (HPC) was manufactured by Aldrich with a nominal molecular weight of 100,000 g.mol–1. In Figures 1a-c the molecular structures of DGEBA, DDM and an idealized structure of HPC are presented. The molar substitution value (MS) of the HPC sample used in this study was determined by H1-NMR as described by Ho[17] and it was found to be 4.5 (MS represents the average number of hydroxypropyl groups (CH2CH(CH3)O) per anhydroglucose unit). The samples were prepared by casting of DGEBA/DDM and HPC solutions in order to obtain suitable films for the DMTA measurements. Amounts of DGEBA/DDM (molar ratio 2:1) were dissolved in chloroform at a concentration of 250 g.L–1. HPC was also dissolved in chloroform at a concentration of 25 g.L–1. Both solutions were mixed in different proportions in order to
Relaxations of Epoxy-amine Networks
Maria Inez G. Miranda, Dimitrios Samios, Liane de L. Freitas, Clara I. D. Bica
Instituto de Química, UFRGS
Abstract: A dynamic mechanical analysis (DMTA) study was conducted on epoxy-amine networks crosslinked in the presence of low contents of hydroxypropyl cellulose (HPC). The epoxy resin chosen was diglycidylether of bisphenol-A (DGEBA) and the crosslinker was 4,4’-diaminodiphenylmethane (DDM). In the glassy region, primary (α) and secondary (β, γ) relaxations originating from the epoxy and HPC components were well detected. Two primary relaxations of neat epoxy and epoxy/HPC systems, referred to as αepoxy and α’epoxy, could be detected, showing a particular glassy behavior for the systems studied in comparison with systems cured in bulk. The main relaxation temperature Tα (at the peak of αepoxy relaxation) of the epoxy systems increased slightly with the addition of HPC. The activation energy for this transition (Tα) of the epoxy-amine networks was determined both from tan δ and the peak temperatures for the loss modulus measured at various frequencies. The activation energy of the αepoxy relaxation determined from the loss modulus was more reliable than that based on tan δ. The addition of HPC lowered the activation energy of this αepoxy relaxation.
Keywords:Epoxy, relaxations, hydroxypropylcellulose, activation energy.
A
R
T
I
G
O
T
É
C
N
I
C
O
C
I
E
N
T
Í
F
I
C
Results and Discussion
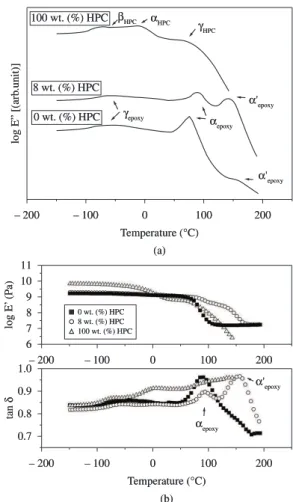
The dynamic mechanical properties of epoxy systems containing different amounts of HPC are shown in Figures 3a, b. Figure 3a shows a schematic representation of the temperature dependence of log E” at 10 Hz for the pure epoxy system, the HPC and a mixture obtain systemswhose composition varied from 0 to 10 wt. (%) and
pure HPC and epoxy control samples were analyzed. The mixture was maintained under constant stirring during four hours at room temperature. The solutions were put into aluminum plates in order to evaporate the excess of solvent and stayed at room temperature during seven days. The samples were then submitted to reduced pressure for ten hours and finally they were oven-cured for 1 hour at 120 °C to guarantee that complete cure took place as reported in our previous papers[4,15,16]. In order to verify that the samples were fully cured, DSC scans were made for cured samples originated from casting preparation and the thermograms are showed in Figure 2. The analysis was made using DSC technique (DSC-4 Perkin-Elmer equipment, samples weighting 10 mg, under inert atmosphere and at 5 °C.min–1) to the samples obtained under casting in the 0 wt. (%) HPC, 8 wt. (%) HPC and 100 wt. (%) HPC concentrations. From the thermograms showed in Figure 2 it is possible to see (at 0 wt. (%) HPC) that there was a single transition around 135 °C related to main glass transition event (Tg). At 100 wt. (%) HPC, it is possible to assign around 200 °C the liquid-crystalline transition of HPC. It can be seen also (in the 0 wt. (%) HPC, 8 wt. (%) HPC samples) that there is not any residual heat which confirms that the samples were fully cured. IR analysis (cured samples in KBr) did not detect the presence of solvent. The cured samples did not show turbidity at concentrations smaller than 10 wt% HPC but above 10 wt. (%) they were opaque. Afterwards the cured samples were cut in a rectangular shape with 2 × 0.5 cm and had around 0.6 mm thickness. The dynamic mechanical experiments wereperformed in a Mk-II PL-DMTA Polymer Laboratories using the combined head in tensile mode. The temperature was scanned at 2 °C.min–1 from –150 to 200 °C. The DMTA measurements were carried out at different frequencies (0.3, 1, 3 and 10 Hz).
Figure 1. a) Molecular structure of DGEBA, b) Molecular structure of DDM, c) Molecular structure of HPC.
Figure 2. Schematic representation of heat flux (arb. unit) versus temperature curves for the pure epoxy system, the pure HPC and a mixture containing
8 wt. (%) of HPC at 5 °C.min–1.
Temperature (°C)
Temperature (°C)
– 200 – 100 0 100 200
log E” [(arb
.unit)]
100 wt. (%) HPC
8 wt. (%) HPC 0 wt. (%) HPC
βHPC αHPC
α'epoxy
α'epoxy
αepoxy γepoxy
γHPC
(a)
α'epoxy
αepoxy 0 wt. (%) HPC
8 wt. (%) HPC 100 wt. (%) HPC
log E’
(P
a)
11 10 9 8 7 6
– 200 – 100 0 100 200 1.0
0.9 0.8 0.7
– 200 – 100 0 100 200
tan
δ
(b)
Figure 3. a) Schematic representation of log E” versus temperature curves for the pure epoxy system, the pure HPC and a mixture containing 8 wt. (%)
of HPC at 10 Hz, b) Temperature dependence of log E’ and tan δ for the pure
phase induced by the solvent during the casting process, as assigned by Glasser[21]. The αrelaxations of the pure materials are appointed on this Figure 3a to 0 wt. (%) of HPC (αepoxy) and 100 wt. (%) of HPC (αHPC ). Figure 3b shows the temperature dependence of log E’ and tan δ at 10 Hz for the pure epoxy system, the HPC and a mixture containing 8 wt. (%) of HPC.
It is well known that HPC is not a flexible polymer but a semi-rigid one. As cellulose ether, its main chain is the rigid one of cellulose. The lateral propyl groups give some flexibility to HPC but not to the extent of a totally flexible polymer. In fact, under casting and in temperatures below 0 °C showed in Figure 3b (log E’ versus Temperature), the pure HPC presents higher log E’ values than epoxy systems. Besides that, the addition of 8 wt. (%) HPC on epoxy matrix does not affect significantly the log E’ comparing to the pure epoxy matrix. This behavior was observed only below αepoxy.
In the log E” (Figure 3a) and tan δ (Figure 3b) curves for the epoxy system containing 8 wt. (%) of HPC a relaxation around 150 °C and called the α’epoxy relaxation can be observed. At the same temperature range the α’epoxy relaxation also appears as a small peak in the curve for the pure epoxy system. It is clear in Figure 3a, that there are two glass transitions of the pure system, α’epoxy detected around 150 °C and αepoxy around 80 °C.
Considering that DMTA experiments were run at a lower heating rate than DSC experiments, it is acceptable that the transition αepoxy detected around 80 °C (2 °C.min–1) corresponds to the transition around 135 °C detected by DSC (5 °C.min–1). Besides that, in Figure 4 it was observed that αepoxy (at 0 wt. (%) HPC and 8 wt. (%) HPC) occurs at the same temperature, as suggested by the DSC experiment shown in Figure 2. This assumption corroborates the statement that αepoxy transition is the main primary transition and in addition it can be taken to evaluate kinetic data. Moreover in Figure 5a, αepoxy did not change with increasing HPC content whereas α’epoxy did. This is an additional evidence that αepoxy is the true main epoxy matrix primary transition.
containing 8 wt. (%) of HPC. From the three relaxations reported for the DGEBA/DDM epoxy system[18], the following ones were observed in this study: the α relaxations (so-called αepoxy and α’epoxy) which are in the typical glassy to rubber-like transition region and a secondary relaxation (γ), called here γepoxy. The latter one corresponds to the broad transition at temperatures around –60 °C and it is reported to be due to the movement of the portion glycidyl-amine related to the portion of copolymerized DGEBA with DDM[19,20]. The β relaxation was not observed in our systems since there is no signal around 30 °C; in the literature[18] it is attributed to partially reacted segments and/or to the heterogeneities of sample. In the log E” curve for the pure HPC three relaxations can be observed. The αHPC relaxation is attributed to the glass transition region of HPC, the βHPC relaxation to side groups and main chain movements of HPC while the γHPC relaxation is due to the presence of a supramolecular order related to the formation of a liquid crystalline
log E” (P
a)
8.0
7.5
7.0
6.5
6.0
5.5
wt. (%) HPC 0 2 4 6 8 10
(b)
T
emperature (°C)
200
150
100
50
wt. (%) HPC 0 2 4 6 8 10
(a)
α'epoxy
αepoxy
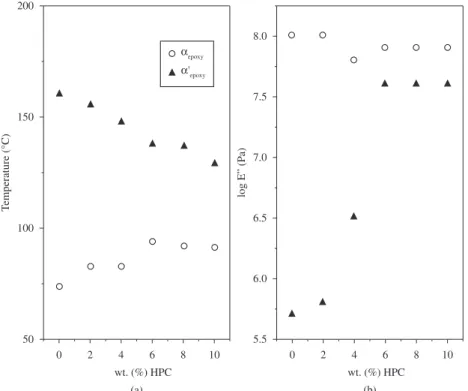
Figure 5. a) Temperature maxima values for different relaxations as a function of HPC content for the measurements carried out at 10 Hz, b) Log E” maxima values for different relaxations as a function of HPC content for the measurements carried out at 10 Hz.
Epoxy systems cured under casting could present different glassy regions from that of the bulk systems. This was evident in those epoxy systems where the appearance of two glass transitions is the remarkable difference between systems obtained by casting and by bulk. The main transition αepoxy was chosen to be analyzed in this paper because it can be more quantitatively and accurately evaluated, considering further parameters such as peak temperatures of relaxation for use in kinetic methods.
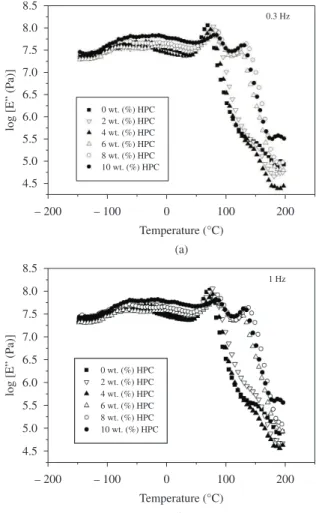
Figure 4 shows the curves of log E” versus temperature for the pure systems and mixtures with different amounts of HPC which were shifted along the y-axis to show the appearance of α’epoxy
and αepoxy relaxations. It was evidenced in this figure that α’epoxy
relaxation intensity got nearby αepoxy relaxation intensity with the increasing of HPC content (6 to 10 wt. (%)). The influence of HPC on the α’epoxy relaxation can be figured out by the fact that the α’epoxy relaxation turns to be more clearly defined in presence of HPC. The
γHPCrelaxation influences onepoxy matrixproducing a region with characteristics of a glassy region (α’epoxy relaxation) assigned at higher peak temperatures than those determined to αepoxy relaxation. Under casting procedure this α’epoxyrelaxation could indicate the
presence of a second microphase within the epoxy matrix and the increase of HPC content could emphasize the existence of this microphase.
Figure 5 shows log E” peak temperature (Tpeak) and its corresponding value at Tpeak of the different relaxations as a function of the HPC content for the measurements carried out at 10 Hz. In Figure 5a it can be observed a slight increase on temperature maxima values of αepoxy (so-called T
α)relaxations with the increasing HPC
concentration in the epoxy matrix. This was also observed in the DSC measurements[4] and shows that the molecular mobility and chain flexibility of the epoxy matrix decrease. The α’epoxy relaxation suffers a remarkable decrease. The values of log E” maxima (Figure 5b) remain practically constant for the αepoxy, while they show
an important increase for the α’epoxyrelaxation(from logE” = 5.75 to log E” = 7.50) when the HPC content increases until 6 wt. (%). At higher concentrations the log E” values remain constant. The same behavior was observed at the frequencies of 0.3, 1 and 3 Hz. The increase of log E” (Figure 5b) and the decrease of log E” peak temperature (Tpeak) (Figure 5a) of α’epoxyrelaxation could indicate that in this region HPC acts as a plasticizing. In HPC-epoxy systems the presence of αepoxy and α’epoxy relaxations distinguishes the glassy
region from that typical of those systems cured in bulk where a single glass transition was reported[4]. It is known that the T
g values observed for epoxy systems obtained from casting could be usually 30 degrees (°C) lower than those observed for systems obtained in bulk[18]. This difference can be explained taking into account the influence of solvent during the curing process. The presence of solvent decreases the chemical reaction probability of DDM with DGEBA and increases the probability of association between DGEBA molecules[18] leading to lower crosslinking densities. Also the association of DGEBA molecules with solvent molecules may lead to the same effect during casting. Taking this into account, the effect of residual quantities of solvent during the curing process could be also contributing to the appearance of a second relaxation on the epoxy glass transition range. Figure 6 shows the loss modulus (log E”) at the frequencies of 0.3 (Figure 6a) and 1 Hz (Figure 6b) as a function of temperature. The relaxations (E” maxima) are shifted to higher temperatures with increasing frequency. Considering the small peak which appears at high temperatures we have no sufficient evidences to confirm the presence of a liquid crystalline transition of HPC by DMTA measurements, as assigned by DSC[4].
The behavior of the storage modulus (E’) was also examined. For HPC contents higher than 6 wt. (%), it was verified that the E’ modulus presents two slightly detectable changes in the slope of
the curve on the glass transition region (data not shown) indicating the presence of a second relaxation α’epoxy on higher temperature in glassy state characteristic of regions with different extent of chain mobility, due to the constraints arising from the higher interaction of epoxy matrix and HPC. At temperatures below the region where
α’epoxyand αepoxy relaxations are present, the curves of the loss modulus (E”) show peaks that can be attributed to secondary molecular relaxations. In fact, in glassy region showed in Figures 6a and b, the addition of HPC (6 to 10 wt. (%)) affects slightly the log E” of epoxy matrix. It is not possible to infer about mechanical properties as stiffness of the samples considering this tendency on loss modulus and storage modulus behaviors. These well-defined maxima take place at the same temperature regions where the storage modulus (E’) curves show slightly detectable changes in the slope of the curve. The peaks of main T
αon E” and tan δ curves will therefore
be used to the kinetic analysis.
The determination of the activation energy for the αepoxy relaxation at Tα, as the main temperature on glassy state, obtained by dynamic mechanical analysis was carried out, considering the temperature shift of the E” and tan δ maxima when different frequencies were used in the measurements.
Considering epoxy systems, there are only a few studies in the literature concerning the use of DMTA for determining the activation energies based on the shift of the tan δ or E” peaks of Tg[7, 9] with frequency. Here we use both to calculate the activation
energies (Ea) and compare the results as well as the reliability of the results according to the correlation coefficients (R2). It is known that a relaxation will be seen as a peak on the loss modulus (E”) versus temperature curves when the frequency of the segmental movement coincides with the experimentally applied frequency. At higher frequencies the process of dissipation will occur at higher temperatures where the molecular motion is faster. This shift on the position of the maxima, with the frequency is related to the activation energy of each transition. In reactional processes the rate constant k(T) can be usually described by the Arrhenius equation,
k(T) = Ao exp(–Ea/RT) (1)
By analogy, this equation can be written as a function of frequency as
ln(f) = lnAo – Ea/RT (2)
where f is the frequency in Hz, Ea the activation energy of the transition in energy/mol and T is the maximum absolute transition temperature (T
αat αepoxy). The slope of the straight line in the plot ln(f) versus 1/T is Ea/R. The DMTA experiments were carried out at 2 °C.min–1 because according to kinetic studies[4,7,22] at higher heating rates thermal and material diffusion become dominant factors and higher activation energies were calculated. So the Arrhenius relationship is valid only when the maximum heating rate in DMTA tests does not exceed 2 °C.min–1 and consistent activation energy values can be obtained[7]. Table 1 presents the results of activation energies at different concentrations of HPC, calculated from tan δ and E” peaks of the αepoxy relaxation (EaE” and Eatanδ, respectively), and their correlation coefficients (R2). The activation energy values decrease with increasing content of HPC in the epoxy matrix, the trend is clear for EaE” but not for Eatanδ values whose decrease is not systematic. On the other hand, it is known that Tg is related with the extent of the cure reaction[15]. Therefore the slight increase of T
α with increasing HPC concentration, observed in Figure 5a (represented by circles), indicates that HPC is acting as an accelerator-catalyst. Concerning the correlation coefficients (R2), the activation energies for the αepoxy relaxation calculated from loss modulus (E”) peaks are more reliable than those using the loss tangent (tan δ) maxima. Whereas this αepoxy relaxation was more quantitatively and accurately evaluated it is worth to compare its activation energy with reported values of activation energy of the glass transition. Samios and Riegel[23] obtained for the same epoxy system in bulk, the activation energy of 630 kJ.mol–1 leading to the conclusion that in kinetic terms, or Ea terms, the epoxy system without HPC obtained by casting does not differ significantly (624 kJ.mol–1) from that obtained in bulk. Moreover Li et al.[7] also observed for a similar epoxy system that the activation energy values of the glass transition were around 500 kJ.mol–1 while Goertzen et al.[9] observed Ea values around 300 kJ.mol–1 for a carbon/DGEBA epoxy cured with an aliphatic amine. Considering the activation energy downward with
the increasing of HPC content on αepoxy relaxation and the presence of α’
epoxy relaxation, two relevant aspects should be contributing to this singular behavior: the presence of the residual solvent quantities and the possible catalyst role of HPC. The hydroxyl groups of HPC and its semi-rigid polymer chain induce a microphase appearance during the curing process. The most significant differences seem to be in the values of αepoxy and α’epoxy temperatures(as shown in Figures 4, 5a, b).
Conclusions
The dynamic mechanical relaxations of the epoxy system (DGEBA-DDM) crosslinked in the presence of the cellulose ether hydroxypropyl cellulose (HPC) were well identified by applying the DMTA technique for a long range of frequencies. It was observed that even low contents of HPC affect the behavior of the epoxy-amine network.
In HPC-epoxy systems obtained by casting, the presence of two α relaxations (αepoxy and α’epoxy) was observed and distinguishes the glassy region from that typical of those systems cured in bulk where a single α relaxation is characteristic. Despite this, the activation energy value calculated for the αepoxy relaxation (in Tα) for neat epoxy system cured using casting does not differ significantly from that obtained at α relaxation (in Tg) in bulk.
The activation energy of the αepoxy relaxation determined by loss modulus was more reliable than that based on tan delta. This was explained as a function of the fact that tan delta contains an elastic component. The addition of HPC lowered the activation energy of this αepoxy relaxation because HPC possesses a semi-rigid polymer chain with hydroxyl groups performing interactions. Finally, it was observed the sui generis role of HPC that has acted in the epoxy matrix as a catalyst, a promoter of a second phase and a plasticizer.
Acknowledgements
CAPES-REUNI and CNPq for financial support and fellowships.
References
1. Martini, D. S.; Braga, B. A. & Samios, D. - Polymer, 50, p.2919 (2009).
http://dx.doi.org/10.1016/j.polymer.2009.03.058
2. Jin, F. L. & Park, S. J. - J. Ind. Eng. Chem., 13, p.808 (2007).
3. Stefani, P. M.; Perez, C. J.; Alvarez, V. A. & Vazquez, A. - J. Appl.
Polym. Sci., 109, p.1009 (2008). http://dx.doi.org/10.1002/app.28162
4. Miranda, M. I. G.; Jacobs, C. A. B.; Bica, C. I. D. & Samios, D. - J.
Appl. Polym. Sci., 87, p.676 (2003). http://dx.doi.org/10.1002/
app.11456
5. Ward, I. M. - “Mechanical Properties of Solid Polymers”, 2nd ed., Wiley, New York (1990).
6. Haines, P. J. - “Thermal Methods of Analysis, Principles, Applications and Problems”, Chapman and Hall, New York (1995).
7. Li, G.; Lee-Sullivan, P. & Thring, R. W. - J. Therm. Anal. Calorim., 60,
p.377 (2000). http://dx.doi.org/10.1023/A:1010120921582
8. Chen, D. Z.; Tang, C. Y.; Chan, K. C.; Tsui, C. P.; Yu, P. H. F.; Leung,
M. C. P. & Uskokovic, P. S. - Compos. Sci. Tech., 67, p.1617 (2007).
http://dx.doi.org/10.1016/j.compscitech.2006.07.034
9. Goertzen, W. K. & Kessler, M. R. - Compos. Part B, 38, p.1 (2007).
http://dx.doi.org/10.1016/j.compositesb.2006.06.002
10. Karbhari, V. & Wang, Q. - Compos. Part B-Eng., 35, p.299 (2004).
http://dx.doi.org/10.1016/j.compositesb.2004.01.003
11. Peng, Z.; Kong, L. X. & Li, S. D. - Synth. Metals, 152, p.25 (2005).
http://dx.doi.org/10.1016/j.synthmet.2005.07.098
Table 1. Activation energies (Ea) and correlation coefficient (R2) of the α epoxy
relaxation calculated from the shift of the tan δ and E” peaks with frequency
for samples with different contents of HPC.
wt. (%) of HPC
EaE”
(kJ.mol–1) R
2 Eatanδ
(kJ.mol–1) R
2
12. Jung, N. & Jeon, S. - Macromolecules, 41, p.9819 (2008). http://dx.doi. org/10.1021/ma8020695
13. Ghilarducci, A.; Salva, H. & Marzocca, A. J. - J. Appl. Polym. Sci.,
113, p.2361 (2009). http://dx.doi.org/10.1002/app.30332
14. Tang, Z.; Qi, L. & Gao, G. - Solid State Ion., 179, p.1880 (2008). http://
dx.doi.org/10.1016/j.ssi.2008.05.011
15. Miranda, M. I. G. & Samios, D. - Eur. Polym. J., 33, p.325 (1997).
16. Miranda, M. I. G.; Tomedi, C.; Bica C. I. D. & Samios, D. - Polymer,
38, p.1017 (1997).
17. Ho, F. L.; Kohler, R. R. & Ward, G. A. - Anal. Chem., 44, p.178 (1972).
http://dx.doi.org/10.1021/ac60309a039
18. Murayama, T. - “Dynamic Mechanical Analysis of Polymer Materials”, Elsevier, Amsterdam (1978).
19. Johari, G. P.; Mikolajczak, G. & Cavaille, J. Y. - Polymer, 28, p.2023
(1987).
20. Mangion, M. B. M.; Wang, M. & Johari, G. P. - J. Polym. Sci. Part
B-Polym. Phys., 30, p.445 (1992).
21. Rials, T. & Glasser, W. - J. Appl. Polym. Sci., 36, p.749 (1988). http://
dx.doi.org/10.1002/app.1988.070360402
22. Flynn, J. H. - J. Therm. Anal., 36, p.1579 (1990). http://dx.doi.
org/10.1007/BF01914077
23. Riegel, I. C.; Freitas, L. L. & Samios, D. - Polímeros, 3, p.58 (1999).