Role of Cured Epoxy and Block Copolymer Addition in Mechanical and Thermal Properties
of Polyethylene
Bruna Louise Silvaa, Bruno Guilherme Christofa, Carlos Mauricio Lepienskib, Eduardo Lenz Cardosoa,
Luiz Antônio Coelhoa, Daniela Beckera*
Received: August 10, 2016; Revised: March 01, 2017; Accepted: June 19, 2017
This work aims to investigate the role of epoxy addition in high density polyethylene (HDPE) matrix. The block copolymer polyethylene-b-poly (ethylene glycol) (PEG-co-PE) was used as a compatibilizer. The samples were obtained by melt mixing using a torque rheometer. Instrumental nanoindentation was used to determine Young’s modulus and nanohardness, thermal properties were analyzed by diferential scanning calorimetry (DSC) and phase morphology was investigated through transmission and scanning electronic microscopy. The epoxy addition increased HDPE crystallinity by 13% and Young’s modulus by 8%. The addition of PEG-co-PE decreased the size of dispersed phase by approximately 50% and improved phase adhesion and homogeneity compared to the blends without block copolymer. The experimental results were compared to numerical results obtained from the use of the homogenization by asymptotic expansion approach. The numerical results presented a fair agreement to the experimental values.
Keywords: Epoxy, block copolymer, high density polyethylene, blend
* e-mail: [email protected]
1. Introduction
Blends are a possible economic alternative for developing new materials. It is possible to combine speciic properties of their components in a single material, achieving new mechanical, electromagnetic, optical or thermal properties, without the need of a new synthetic route. The development of new materials is restricted not only to their production, it is important to understand their physical and chemical characteristics to determine their application.
The blend development enables the modiication of polyolein properties, such as its stifness, which is low in this type of polymer. Epoxy resins (ER) often present high operating temperatures, are extremely resistant, both mechanically and chemically, and have high stifness in comparison to thermoplastic materials1-2. The thermoset
addition as a second phase in a polyolein provides an opportunity for modifying the thermal and mechanical properties of the matrix, such as stifness and crystallinity3.
There are few works, to the best of our knowledge, about thermoset blends involving epoxy resins and thermoplastics. In general, they studied the compatibilizing efect and the crystallization of thermoplastic matrix, usually polypropylene4-9,10, after epoxy addition3-12. Overall, after
epoxy addition, an increase in crystallinity is observed. Since these blends are incompatible, they also observed that the use of a compatibilizer decreased the size of the dispersed phase. Jiang et al6-9, for instance, studied the epoxy addition in
polypropylene with maleic anhydride grafted polypropylene as compatibilizer. In this work, the compatibilizer addition decreased the size of dispersed phase and improved phase adhesion. A decrease in crystallinity rate was observed when epoxy quantities were higher than 20% w/w.
Block copolymers have been studied as compatibilizers or toughening agents, because they can lead to a dispersed phase at microscale or nanoscale size formation. It is well known that smaller sizes in dispersed phase give more interfacial area and thus favor interactions and synergy in the blend1. Zhang and Zheng13 studied crystallization behavior
of HDPE in epoxy matrix, with poly(ε-caprolactone)-block-polyethylene-block-poly(ε-caprolactone) (PCL-b-PE-b-PCL) triblock copolymer as compatibilizer. The results showed HDPE was dispersed as a spherical phase with nanosize in the range of 20-30 nm.
Polyethylene-block-poly(ethylene glycol) copolymer (PE-b-PEG), which to the best of our knowledge has not been used as compatibilizer in HDPE/epoxy blend, was chosen to be used in this research. Literature points out that PEG block can react with epoxy phase14-16 and PE block presents
ainity with HDPE phase17. Zacharuk et al14 studied epoxy nanocomposites with carbon nanotubes functionalized with poly(ethylene glycol). Authors observed the occurrence of a reaction between epoxy groups of DGEBA (diglycidyl ether bisphenol A) and the PEG hydroxyl groups, at elevated temperatures or in the presence of a catalyst. Zhang et al17 observed that PE block of PE-co-PEG anchored in the HDPE phase of membrane surface.
In this context, the main goal of this paper is to investigate the efect of epoxy addition on the mechanical and thermal properties of HDPE. Furthermore, the role of PE-co-PEG in the morphological properties of HDPE/epoxy blend was investigated. Finally, the Homogenization by Asymptotic Expansion, a mathematical technique used to evaluate the efective properties of composite materials, was employed and comparisons between experimental and theoretical results are presented.
2. Experimental
2.1 Materials
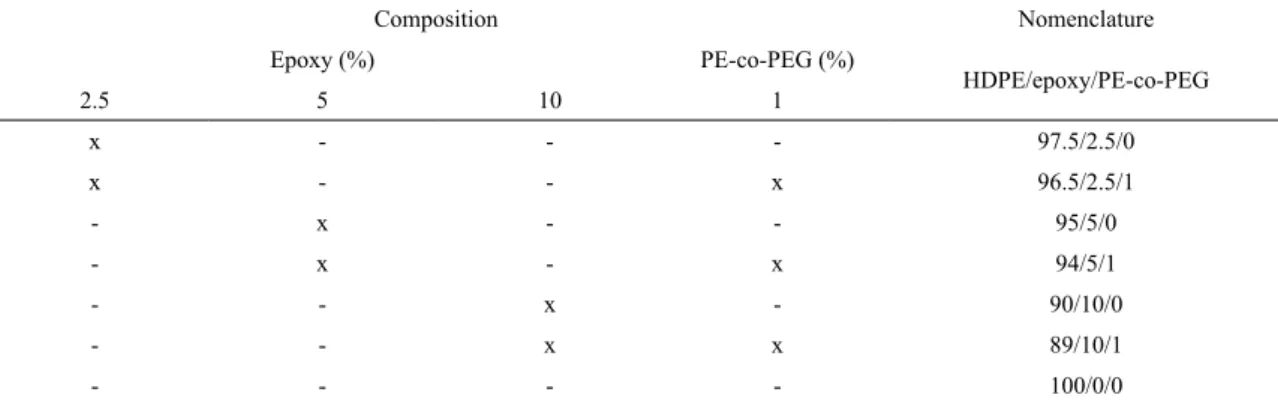
The resin used in this work was HDPE (HC760LS-L, Braskem, MFI=7,2 g/10min at 190 ºC and 2,16 kg). The dispersed phase used was solid epoxy resin based on bisphenol diglycidyl ether (DGEBA) (NPES 903H, NANYA) and the hardener agent used was o-toluilbiguanidine (OTG) (ARADUR 2844, Hunstman). The block copolymer Polyethylene-b-poly (ethylene glycol) (PE-co-PEG, Aldrich) was used as compatibilizer. Properties of the materials used are presented in Table 1. All experiments were performed using 2.5, 5.0, 10.0% w/w of epoxy relative to the mass of HDPE, except the neat system. Compatibilizer systems used 1% w/w of PE-co-PEG. The adopted nomenclature for this study is presented in Table 2.
The miscibility between the blend components (HDPE and DGEBA) and the compatibilizer (PE-co-PEG) was evaluated separately. The blends of each component (HDPE and uncured DGEBA) and 10% w/w of PE-co-PEG were
prepared, then named as HDPE/PE-co-PEG and DGBA/ PE-co-PEG, respectively. It’s important to notice that in DGEBA/PE-co-PEG the hardener agent was not used to evaluate signs of interaction between uncured epoxy and PE-co-PEG blends.
2.2 Sample preparation
The melt mixing process was performed in a Thermo Scientiic Haake Rheomix 600 internal mixer with a 50 cm3 mixing chamber and standard rotors, operated at 160
°C and 50 rpm. Initially, HDPE was added in the internal mixer and, after 2 min of mixing, epoxy was added, and compatibilizer agent was added when needed. Hardener agent was added after 8 min of mixture. The total mixture time was 10 min. No signiicant alteration in torque was observed during the mixture.
Blends were compressed and molded using a hydraulic press at 160 °C for 5 minutes by applying a pressure of 16 MPa and cooling with water to room temperature.
2.3 Characterization techniques
FTIR spectra of polymer blends for miscibility study were carried out on a Perkin-Elmer Spectrum One B spectrophotometer, performing 16 scans at a resolution of 4 cm-1 and using attenuated total relectance mode.
The melting and the crystallization temperatures and crystallinity degree were obtained by diferential scanning calorimetry (DSC), in a NETZSCH DSC 200 F3 device, with a heating rate of 10 °C/min, from 0 °C to 200 ºC (under nitrogen atmosphere). Cooling rate was 10 °C/min, down to
Table 1. Properties of materials used in this work
Property DGEBA OTBG HDPE PE-co-PEG
Supplier Naya Huntsman Brasken Aldrich
Molecular Weight (g/mol) Mn=2300 Mn=191 Mn=23000 Mn~2250 Mw=68500
Speciic weight (g/cm³) 1.17 - 0.959 1.059
Epoxy equivalent (g/eq) 740-780 - -
-Table 2. Nomenclature and composition of the samples.
Composition Nomenclature
Epoxy (%) PE-co-PEG (%)
HDPE/epoxy/PE-co-PEG
2.5 5 10 1
x - - - 97.5/2.5/0
x - - x 96.5/2.5/1
- x - - 95/5/0
- x - x 94/5/1
- - x - 90/10/0
- - x x 89/10/1
30 °C. The percentage of crystallinity (Xc) was determined from HDPE crystallization enthalpy, Equation 1, using a value of ∆H°m = 293 J/g for hypothetically 100% crystalline HDPE 18 and the melting enthalpy values were corrected for HDPE weight present in the blend.
This method is suitable for the present work, since the main objective of the numerical method is to assess the Young’s modulus obtained by means of nanoidentantion, a method that does not impose large global strain ields to the sample.
The development of the method follows three basic considerations20. The irst demands that the displacement ield of the media can be written in an asymptotic expansion as
% ( )
X
H
H
100
1
c m sample o 0#
D
D
=
T
Y
Nanoindentation was performed on a Nanoindenter XP device using a Berkovich indenter. By applying the method of Oliver and Pharr19, measurements of elastic modulus and nanohardness were done through sixteen indentations arranged in a 4x4 indentation matrix. Each indentation was spaced 200 μm from the previous one. A maximum load of 50 mN was used, with 8 cycles of loading and unloading in each indentation. Ultrathin sections of 30 nm were cut from the compression molded disks with a diamond knife at -85 °C, using an RCM Power Tome X Ultramicrotome. Sections were collected on the surface of a water-dimethylsulfoxide (60/40 v/v) bath, cooled to -60 °C. A JEOL JEM-2100 transmission electron microscope was used for the images. The morphology was also analyzed by ield emission electron microscopy (FEG). The images were obtained by a Jeol JSM 6701F FEG and samples were fractured under liquid nitrogen. The phase dispersed size was determined using Image J software and at least 30 samples were measured.
3. Numerical Procedure
The efective properties of heterogeneous materials are dependent on the properties of each constituent, their relative volume fractions, the shape of the inclusions, and the orientation and the quality of the adhesion between each phase. If the material is assumed as periodic or quasi-periodic, one can, under the assumption of linearity, use the well-established concept of representative volume element (RVE) analysis. In the RVE analysis, representative sections of the material distribution are analyzed under assumed boundary conditions to obtain the average of efective properties of that mixture20. Among the several methods available to obtain the efective properties of heterogeneous materials, the standard rule of mixtures is the simplest 21, although it can only be used with simple mixtures. Other well-established methods found in the literature22-28 must be constrained within some
speciic hypothesis concerning the material distribution, the material properties of the constituents and their relative volume fraction.
One of the RVE methods that can be used in order to work with more general problems, like the mixture of anisotropic materials with complex inclusions, is the homogenization by asymptotic expansion29-31. The basic idea of such method is to obtain the macroscopic behavior of a medium formed by a periodic microstructure, as a function of the microscale.
,
,
..., ( )
u
x
u x
0u x y
1 2u x y
22
!
!
=
+
+
+
!
Q
V
Q
V
R W R Wwhere x and y are the coordinates into the macroscopic and microscopic levels, respectively, uϵ is the total displacement ield and u0, u1 and u2 are the contributions for
the displacement of the macroscopic scale, microscopic scale, and eventually smaller scales, respectively. In the context of this work, one can see the macroscopic scale as the high density polyethylene (HDPE) matrix and the microscopic scale as the epoxy inclusions.
The second consideration is that the coordinates at each level should be related by a small parameter, ϵ, in the form
. ( )
y
x
+
y
x
3
!
=
=
!
As the coordinates on the microscopic scale are smaller than their macroscopic relatives, the parameter ϵ should tend to zero. The last main consideration is that the displacements on the boundaries of the RVE should be periodic. In other words, the displacement value is the same in opposite sides of the representative volume.
The mathematical procedure for the determination of the efective properties of the medium is well established in the literature32-34. It consists in solving six equilibrium problems
to obtain the associated characteristic displacement ields φkl,
for kl=11, 22, 33, 12, 23 and 13 on the microscopic level. Those equations can be stated as
where Cijkl is the fourth-order tensor of mechanical properties in each point of the RVE, Y is the volume of the RVE and v is a virtual displacement ield, respecting the boundary conditions of the problem. In this work, these equations were solved by the Finite Element Method35,36.
The ields φkl are then used to evaluate the efective
homogenized elasticity tensor of an equivalent homogeneous material with the same properties, so that
, ( )
C
ijklY
1
C
C
y
dY
5
H ijkl ijpq q p kl Y
2
2
{
=
#
T
-
Y
Hollister and Kikuchi35 showed that the efective properties
of mixtures with a periodic structure, such as stifness and
, ( )
C
ijkly
y
v
dY
C
y
v
dY
4
q p kl yj i Y ijkl j i Y
2
2
2
2
2
2
{
=
local strain, are better approximated using the homogenization theory instead of the previously mentioned approaches.
Once the homogenized tensor is obtained, it is possible to evaluate both the Young’s modulus and the Poisson’s coeicient, since, for an isotropic or a cubic material (Equation 6 and 7),
’
( )
C
v
v
E
v
1
1
2
1
6
H
1111
=
+
-Q
Q
V
Q
V
V
and
. ( )
C
v
v
vE
1
1
2
7
H
1122
=
Q
+
V
Q
-
V
The entire computational framework used in this work was developed by the authors.
4. Results and Discussion
4.1 Miscibility study
The efect of PE-co-PEG addition was evaluated in the matrix and in the dispersed phase separately. Figure 1 (a) presents DSC results from uncured DGEBA/PE-co-PEG (90/10) and neat uncured DGEBA. It is possible to observe a decrease in DGEBA glass transition temperature for DGEBA/ PE-co-PEG blend (55 °C and 34 °C respectively). This result indicates that the DGEBA/PE-co-PEG blends were partially miscible in the amorphous state 37-39. In FTIR results, Figure
2, a signiicant shift at 955 cm-1 (ν aromatic C-O) and a slight shift at 914 cm-1 (ν
asym epoxy group) bands from epoxy are observed. These behaviors can be attributed to the interaction between hydroxyl groups from PEG and epoxy group. Similar results were observed by other authors.14,40,41 These results indicate that PEG block of PE-co-PEG copolymer can interact with epoxy and this copolymer can improve the compatibilization of blends with epoxy.
DSC curves for HDPE and HDPE/ PE-co-PEG (90/10) blend are shown in Figure 1(b) and two melting peaks are observed for the blend. The irst one is at 55 °C, associated with PE-co-PEG melting point, and the second one is the melting temperature for HDPE at 132 °C, being in accordance to melting temperatures of the neat materials (neat HDPE – 135 °C and neat PE-co-PEG – 63 °C). Such behavior is characteristic in blends with two semicrystalline polymers and co-crystallization was not observed.42 The PE-co-PEG addition reduced the HDPE crystallinity degree by 30% (neat HDPE-62%; HDPE/PE-co-PEG-43%). At this concentration, PEG chains from PE-co-PEG can alter the molecular organization of the matrix. These results indicate PE-co-PEG has potential to be a compatibilizer in blends of HDPE/epoxy.
Figure 1. DSC results of (a) epoxy and DGEBA/PE-co-PEG (90/10);
(b) HDPE and HDPE/PE-co-PEG (90/10).
Figure 2. FTIR spectra for epoxy and epoxy/PE-co-PEG blend broadening of the spectrum in the range between 750 cm-1 and
4.2 Blends characterization
In Figure 3, phase separation between HDPE and epoxy can be observed. No adhesion between the domains in the matrix can be observed (Figure 3(a)), due to the weak interfacial bonding between HDPE and epoxy. However, the addition of compatibilizer promotes such adhesion, Figure 3(b).
Figure 3. FEG-SEM micrographs of (a) 90/10/0 e (b) 89/10/1
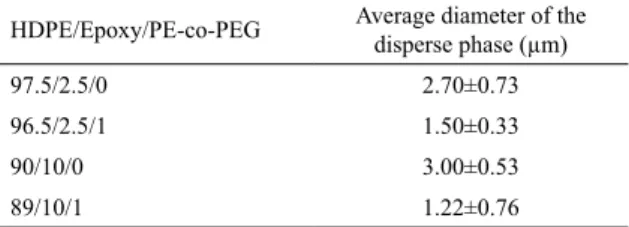
Figure 4 presents TEM micrographs of blends at both the lowest and highest epoxy concentrations used in this study and Table 3 presents average diameter of the disperse phase of those blends. The addition of 1% w/w of PE-co-PEG decreased the diameter of the epoxy dispersed phase by 53%. As observed in miscibility study of PE-co-PEG with each polymer of the blend, hydroxyl groups of PEG block interact with epoxy, and ether group of epoxy and PE block are miscible with HDPE phase. The block copolymer can be at the blend interface as shown in the scheme of Figure 5 promoting a steric stabilization of the disperse phase against the coalescence phenomena. Similar results were observed in PP/epoxy blends with diferent compatibilizers.6,8 It is also observed in Figure 4(b) and 4(d) that compatibilizer addition
Figure 4. TEM micrographs of: (a) 90/10/0 (b) 89/10/1 (c) 87.5/2.5/0 (d) 86.5/2.5/1.
Table 3. Average diameter of the dispersed phase HDPE/Epoxy/ PE-co-PEG
HDPE/Epoxy/PE-co-PEG Average diameter of the disperse phase (µm)
97.5/2.5/0 2.70±0.73
96.5/2.5/1 1.50±0.33
90/10/0 3.00±0.53
89/10/1 1.22±0.76
Figure 5. Schematic illustration of role of PE-co-PEG in HDPE/
epoxy blend.
improved the homogeneity of epoxy phase distribution when compared with uncomptabilized blends (Figure 4 (a) and Figure 4(b)).
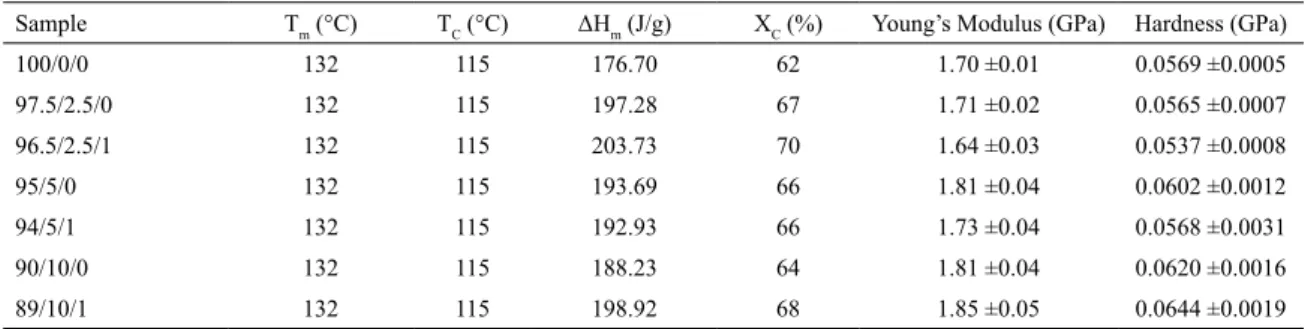
Table 4. Summary of thermal and mechanical properties for compatibilized and uncompatibilized blends.
Sample Tm (°C) TC (°C) ΔHm (J/g) XC (%) Young’s Modulus (GPa) Hardness (GPa)
100/0/0 132 115 176.70 62 1.70 ±0.01 0.0569 ±0.0005
97.5/2.5/0 132 115 197.28 67 1.71 ±0.02 0.0565 ±0.0007
96.5/2.5/1 132 115 203.73 70 1.64 ±0.03 0.0537 ±0.0008
95/5/0 132 115 193.69 66 1.81 ±0.04 0.0602 ±0.0012
94/5/1 132 115 192.93 66 1.73 ±0.04 0.0568 ±0.0031
90/10/0 132 115 188.23 64 1.81 ±0.04 0.0620 ±0.0016
89/10/1 132 115 198.92 68 1.85 ±0.05 0.0644 ±0.0019
Melt enthalpy (ΔHm) can be related with crystal arrangement in crystalline phase.41 It is noticeable that epoxy
addition increases HDPE melt enthalpy and this efect is more pronounced in compatibilized blends. A compatibilized blend with 10 % w/w of epoxy (89/10/1) presents a melt enthalpy 5% higher than the uncompatibilized blend (90/10/0). This behavior suggests that epoxy phase interferes in crystal arrangement, and phase size is an important factor in this behavior. Jiang et al5 observed in PP/epoxy blends a smaller epoxy dispersed phase domain in the polypropylene matrix, resulting in an increase in the crystallization matrix in the blends. Similar indings were observed here in HDPE/ epoxy. Compatibilized blends, in general, present higher crystallinity than uncompatibilized blends. It is also observed that the epoxy concentration has no role in these results, indicating that domain size is a more important factor in HDPE crystallinity behavior than the epoxy concentration.
Increasing the epoxy concentration increased the Young´s modulus and the highest Young´s modulus value was observed in the compatibilized blend with 10% w/w of epoxy (89-10-1), which presented an increase of 8% compared to neat HDPE (Table 4). These results suggest that both an improvement of adhesion phase and an increase in crystalline fraction caused by a decrease in epoxy phase size interfere in tension transfer, or in restriction of mobility between HDPE and epoxy phase. Similar behavior was observed in hardness results. The increase in the epoxy concentration increased the hardness and the highest hardness value was observed in the compatibilized blend with 10% w/w of epoxy (89-10-1), which presented an increase of 13% compared to neat HDPE. The increase of epoxy weight fraction tends to limit the mobility of the polymer chains, thereby increasing the resistance to plastic deformation at nanoscale and elastic deformation of HDPE.
4.3 Numerical Results
The inite element method is used to solve the equations associated to the homogenization approach. A inite element mesh comprised of 50x50x50, 8-node hexahedral trilinear isoparametric elements with enhanced displacement ield was used. This element is used in order to alleviate the parasitic shear associated to the standard trilinear element
and the mesh density was obtained with a proper convergence analysis. Figure 6 (a) shows one of the Finite Element Models used in the simulations. The geometric distribution of the Epoxy reinforcements has little to no impact (max 2%) in the efective value of the Young’s modulus, for the range of volume fractions studied in this work. The only (small) inluence is in the symmetry of the constitutive tensor, since for a random distribution one obtains an isotropic tensor, whereas a regular distribution results in a cubic tensor. Since the experimental value used for comparison is the Young’s modulus, it is not possible to assess the anisotropy of the experimental results.
Figure 6. (a) Example of a Finite Element Model of the RVE used in the homogenization approach. Base material (white) and inclusions (black) on the left and a detailed view of the inclusions (right); (b) RVE used to simulate the efect of the interface (gray rims) between the matrix (white) and the reinforcement (black) on the homogenized Young's modulus.
Both the matrix and the inclusions where assumed as homogeneous and isotropic. Due to the fact that the properties of the base material might have a slight change due to alteration in HDPE crystallinity degree, a variation of 5% on the properties of each material is considered. Also, to mimic the experimental procedure, the simulations were performed for mass fractions in the range of 0% to 12%.
expected from the use of compatibilized blends. Thus, using the simulations, it is possible to infer that, for this range of mass fraction, the efect of the variation of Poisson’s Modulus of both matrix and reinforcement, and of the Young’s Modulus of the reinforcement are not very signiicant on the efective Young’s Modulus of the composite material. On the other hand, the variation of the Young’s Modulus of the matrix has a signiicant efect on the efective Young’s Modulus.
By using the least square method, it is possible to obtain an equation relating the mass fraction of the reinforcement and the efective Young’s Modulus. Thus, the base properties for a variation of more and less 5% in the Young’s modulus of the matrix are given by
.
.
,
( )
E
baseQ V
t
=
1 3263
t
+
1 6969
!
GPa
$
8
.
.
,
( )
E
+5%Q V
t
=
1 2889
t
+
1 7822
!
GPa
$
9
and
.
.
,
( )
E
-5%Q V
t
=
1 3591
t
+
1 6116
!
GPa
$
10
respectively, where E is the efective Young’s modulus of the compatibilized blend and ρ is the mass fraction of the reinforcements. It can be seen that the above relations are linear with respect to the mass fraction (R=0.999), although they become nonlinear for higher mass fractions.
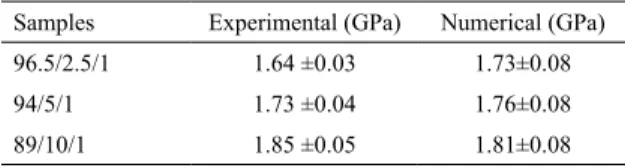
The comparison between the experimental and numerical results is shown in Table 5, where a good agreement between the experimental results and the results obtained by the Homogenization by Asymptotic Expansion approach can be observed.
Table 5. Comparison of experimental and numerical Young´s
modulus results
Samples Experimental (GPa) Numerical (GPa) 96.5/2.5/1 1.64 ±0.03 1.73±0.08 94/5/1 1.73 ±0.04 1.76±0.08 89/10/1 1.85 ±0.05 1.81±0.08
Thus, it can be concluded that the adhesion obtained with the PE-co-PEG addition is consistent with the perfect adhesion considered in the numerical approach. As the numerical method assumes a periodic RVE, it can also be concluded that the PE-co-PEG addition provides a good dispersion of the inclusions within the matrix.
If an imperfect adhesion between the matrix and the reinforcements is considered, by setting a layer of inite elements with intermediate material properties around the reinforcements, Figure 6(b), it is possible to investigate the range of Young’s modulus as a function of the adhesion. This investigation is performed for the 89-10-1 case, by multiplying the constitutive tensor of the layer by a factor in the range (0,1]. Thus, for r = 1 there will be a perfect
adhesion and, for a small value of r, an imperfect (almost void) interface between the matrix and the reinforcement. Table 6 shows the efective Young’s modulus as a function of the adhesion for some values of r.
Table 6. Efective Young’s modulus as a function of the parameterized
adhesion variable r, for the 89/10/1 blend.
r Young’s modulus (GPa)
1.0 1.84
0.8 1.83
0.6 1.82
0.4 1.81
0.2 1.79
As presented by this result, there is a good agreement between the numerical model and the experimental results. Also, by comparing this parameterized adhesion, it’s possible to conclude that the level of adhesion observed in the experimental values corresponds to r=1 for the 89-10-1 blend and r=0.4 for the 90-10-0 blend. These results support the results observed in the morphology (Figure 3), as the addition of block copolymer promotes the interfacial adhesion between the domains and the matrix.
5. Conclusions
It’s possible to conclude that the incorporation of a thermoset as second phase in a polyolein blend promoted the increase in crystallinity, stifness and hardness. This study also demonstrated the feasibility of using the PE-co-PEG copolymer as compatibilizer in HDPE and epoxy blend. Its addition reduced the interfacial tension between the blend components, improving the phase adhesion between them. Besides, this copolymer could promote a steric stabilization of the disperse particles against the coalescence phenomena, reducing the epoxy dispersed phase size. The addition of 1% w/w of this copolymer led to a decrease of 53% in diameter of the epoxy dispersed phase. DSC results indicated that the domain size was a more important factor in HDPE crystallinity behavior than the epoxy concentration. The compatibilized blend with the highest epoxy concentration, 10% w/w, presented the highest Young´s modulus and hardness. The experimental results were consistent with the efective properties obtained with the use of the Homogenization by Asymptotic Expansion approach, conirming the good adhesion and dispersion obtained with the compatibilized blend.
6. Acknowledgements
7. References
1. Ruiz-Pérez L, Royston GJ, Fairclough JPA, Ryan AJ. Toughening by nanostructure. Polymer. 2008;49(21):4475-4488. 2. Leibler L. Nanostructured plastics: Joys of self-assembling.
Progress in Polymer Science. 2005;30(8-9):898-914. 3. Jahani Y, Ehsani M. The efects of epoxy resin nano particles
on shrinkage behavior and thermal stability of talc-illed polypropylene. Polymer Bulletin. 2009;63:743.
4. Jiang X, Huang H, Zhang Y. Dynamically cured polypropylene/epoxy blends. Journal of Applied Polymer Science. 2004;92(3):1437-1448. 5. Jiang X, Zhang Y, Zhang Y. Crystallization behavior of dynamically
cured polypropylene/epoxy blends. Journal of Polymer Science Part B: Polymer Physics. 2004;42(7):1181-1191.
6. Jiang XL, Fan YH. Dynamically cured PP/MAH-g-SEBS/epoxy blends. Plastics, Rubber and Composites. 2012;41(3):107-113. 7. Jiang XL, Sun K, Zhang YX. Efects of dynamical cure and
compatibilization on the morphology and properties of the PP/ epoxy blends. eXPRESS Polymer Letters. 2007;1(5):283-291.
8. Jiang LX, Fan Y. Efect of the compatibilizer on the morphology and properties of dynamically cured PP/POE/epoxy blends.
Journal of Applied Polymer Science.2012;124(3):2423-2429.
9. Jiang X, Hu K, Zhou A. Preparation and properties of dynamically cured PP/MAH-g-EVA/epoxy blends. Journal of Applied Polymer Science. 2009;113(3):1986-1993.
10. Li Y, Wang S, Zhang Y, Zhang Y. Crystallization behavior of carbon black-illed polypropylene and polypropylene/epoxy composites.
Journal of Applied Polymer Science. 2006;102(1):104-118.
11. Zhang H, Ren M, Chen Q, Sun S, Sun X, Zhang H, et al. Miscibility and Crystallization Behavior of PBT/Epoxy Blends. Journal of Polymer Science Part B: Polymer Physics.
2006;44(9):1320-1330.
12. Magomedov GM, Kozlov GV, Zaikov G. Structure and Properties of Crosslinked Polymers. Shawbury: iSmithers; 2011.
13. Zheng C, Li L, Zheng S. Formation and Conined Crystallization of Polyethylene Nanophases in Epoxy Thermosets. Macromolecules.
2013;46(7):2740-2753.
14. Zacharuk M, Becker D, Coelho LAF, Pezzin SH. Estudo da reação entre polietileno glicol e resina epoxídica na presença de N,N-dimetilbenzilamina. Polímeros. 2011;21(1):73-77.
15. Chitwood HC, Freure BT. The Reaction of Propylene Oxide with Alcohols. Journal of the American Chemical Society. 1946;68(4):680-683.
16. Shechter L, Wynstra J, Kurkjy RP. Glycidyl Ether Reactions with Alcohols, Phenols, Carboxylic Acids, and Acid Anhydrides.
Industrial & Engineering Chemistry. 1956;48(1):86-93.
17. Zhang C, Bai Y, Sun Y, Gu J, Xu Y. Preparation of hydrophilic HDPE porous membranes via thermally induced phase separation by blending of amphiphilic PE-b-PEG copolymer. Journal of Membrane Science. 2010;365(1-2):216-224.
18. Sahebian S, Zebarjad SM, Vahdati Khaki J, Sajjadi SA. The efect of nano-sized calcium carbonate on thermodynamic parameters of HDPE. Journal of Materials Processing Technology. 2009;209(3):1310-1317.
19. Yan W, Pun CL, Simon GP. Conditions of applying Oliver–Pharr method to the nanoindentation of particles in composites.
Composites Science and Technology. 2012;72(10):1147-1152.
20. Hollister SJ, Kikuchi N. Homogenization theory and digital imaging: A basis for studying the mechanics and design principles of bone tissue. Biotechnology and Bioengineering. 1994;43(7):586-596.
21. Jones RM. Mechanics of Composite Materials. Oxford: Taylor and Francis; 1999.
22. Paul B. Prediction of elastic constants of multiphase materials.
Transactions of the Metallurgical Society of AIME. 1960;218:36-41.
23. Hashin Z. The Elastic Moduli of Heterogeneous Materials.
Journal of Applied Mechanics. 1962;29(1):143-150.
24. Hashin Z. A variational approach to the theory of the elastic behaviour of multiphase materials. Journal of the Mechanics and Physics of Solids. 1963;11(2):127-140.
25. Muskhelishvili NI. Some Basic Problems of the Mathematical Theory of Elasticity. Dordrecht: Springer; 2010.
26. Hill R. Continuum micro-mechanics of elastoplastic polycrystals.
Journal of Mechanics and Physics of Solids. 1965;13(2):89-101. 27. Whitney JM. Elastic Moduli of Unidirectional Composites
with Anisotropic Filaments. Journal of Composite Materials. 1967;1(2):188-193.
28. Halpin JC. Efects of Environmental Factors on Composite
Materials. Wright-Patterson Air Force Base: Air Force Materials Laboratory, Air Force Systems Command; 1969.
29. Sanchez-Hubert J, Sanchez Palencia E. Introduction aux methods asymptotiques et à l’homogénéisation. Paris: Elsevier Masson; 1992.
30. Keller JB. Efective Behavior of Heterogeneous Media. In: Landman U, ed. Statistical Mechanics and Statistical Methods in Theory and Application. New York: Plenum Press; 1977. p. 631-644.
31. Sanchez-Palencia E. Non-homogeneous Media and Vibration Theory. Berlin Heidelberg: Springer-Verlag; 1980.
32. Sanchez-Palencia E. Homogenization in Mechanics – a survey of solved and open problems. Rendiconti del Seminario Matematico Università e Politecnico di Torino. 1986;44(1):1-45.
33. Guedes JM, Kikuchi N. Preprocessing and postprocessing for materials based on the homogenization method with adaptive inite element methods. Computer Methods in Applied Mechanics and Engineering.1990;83(2):143-198.
34. Hassani B, Hinton E. A review of homogenization and topology optimization I—homogenization theory for media with periodic structure. Computers & Structures. 1998;69(6):707-717.
35. Hollister SJ, Kikuchi N. A comparison of homogenization and standard mechanics analyses for periodic porous composites.
Computational Mechanics. 1992;10(2):73-95.
36. Hassani B, Hinton E. A review of homogenization and topology opimization II—analytical and numerical solution of homogenization equations. Computers & Structures. 1998;69(6):719-738.
38. Lü H, Zheng S. Miscibility and intermolecular speciic interactions in thermosetting blends of bisphenol S epoxy resin with poly(ethylene oxide). Journal of Polymer Science Part B: Polymer Physics. 2005;43(4):359-367.
39- Hu L, Lü H, Zheng S. Efect of crosslinking on intermolecular interactions in thermosetting blends of epoxy resin with poly (ethylene oxide). Journal of Polymer Science Part B: Polymer Physics. 2004;42(13):2567-2575.
40. Sato T, Wu J, Lin J, Huang M, Yin S, Sato T. Inluence of molecular weight of PEG on the property of polymer gel electrolyte and performance of quasi-solid-state dye-sensitized solar cells.
Electrochimica Acta. 2007;52(24):6673-6678.