ABSTRACT: The distribution of conjugated linoleic acid (CLA) in dairy products commercially avail-able in Chile is poorly understood. This study aimed to assess the content of CLA in dairy cow products from Chile and the effect of processing fresh milk into dairy products. Samples of raw milk were categorized into two groups based on the animal feeding system utilized by the dairy farm: 1) grazing based systems (Los Lagos region); and 2) housing systems using total mixed ration (TMR) diets (Los Angeles region). Simultaneously, commercial samples of condensed milk, powdered milk, butter and Gouda cheese were analyzed. Furthermore, samples of raw milk and processed products (powdered and sweetened condensed milk) were also analyzed. Dairy farms based on grazing systems had higher levels of CLA in raw milk than TMR farms. In addition, aver-age values of CLA were 1.72 g 100 g−1 of total fatty acids, in spring milk in the Los Lagos region, and 0.42 g 100 g−1 in summer milk, in the Los Angeles region. Similarly, the CLA content of dairy products was higher than that of raw milk. Milk processing affected the transferring of CLA from fresh milk into the final products. Sweetened condensed milk presented lower CLA values than raw and powdered milk. In conclusion, this study indicates the importance of the production systems to the CLA content as well as the effects of milk processing into dairy products. To sum up, more research is needed to elucidate the exact effect of the processing conditions of dairy products on the CLA content.
Keywords: CLA, functional foods, grazing, milk quality
al., 2006; Bisig et al., 2007). As for cheeses, reports and reviews present results for individual varieties, often in the belief that CLA levels may vary due to different pro-cessing conditions. Herzallah et al., (2005) reported CLA decreases of 21 and 53 % in cheeses heated in a micro-wave oven for 5 and 10 min, respectively. These effects are likely to be small and variations in CLA levels are similar to the levels in raw milk (Gómez-Cortés et al., 2009). However, other studies detected new CLA isomers in ripened cheeses (Werner et al., 1992; Lavillonière et al., 1998; Sehat et al., 1998) and it was hypothesized that biohydrogenation of linolenic acid in cheese could lead to the formation of CLA isomers as intermediates. Thus, the present study aimed to assess the contents of total and individual CLA isomers of cow dairy products in Chile, both in raw milk received at commercial dairy plants and its derived products destined for human consumption. Additionally, the effect of processing fresh milk into dairy products on the CLA content was also assessed.
Materials and Methods
Experimental samples
Raw milk - Milk samples were collected from two regions in Chile considered representative of two different dairy production systems, based on feeding strategy: grazing based systems (Los Lagos region, Osor-no) and housing systems using TMR diets (Bio-Bio re-gion, Los Angeles). The predominant genotype of dairy cow in southern Chile corresponds to a Chilean Black Friesian, multiparous cow (6.6 ± 1.8 calvings), with an
1Catholic University of Temuco/School of Veterinary Medicine, Montt 56 − Temuco − Chile.
2Milk Company, Francisco del Campo s/n – Osorno − Chile. 3University of Sevilla/School of Agricultural Engineering − Agroforestry Science Dept., Ctra. Utrera km 1 − 41013 – Sevilla – Spain.
*Corresponding author <[email protected]>
Edited by: Paulo Cesar Sentelhas
Conjugated linoleic acid of dairy foods is affected by cows’ feeding system and
Juan Pablo Avilez Ruiz1, Marcelo Wladimir Alonzo2, Manuel Delgado Pertíñez3*
Received February 10, 2015 Accepted June 28, 2015
processing of milk
Introduction
Conjugated linoleic acid (CLA) has been indicated as one of the most potentially beneficial fatty acids (FA) for human health (Collomb et al., 2006). The most effec-tive strategy for multiplying the content of CLA in raw milk involves supplementing ruminant feed with differ-ent oils or oilseeds with high levels of linoleic and linole-nic acids (Hervás et al., 2008). Feeding ruminants under grazing conditions (natural and/or improved pastures) can also provide high CLA content in raw milk (Gómez-Cortés et al., 2009; Avilez et al., 2012).
In Chile, cattle production systems are based, for the most part, on grazing (generally, southern Chile), whereas a minority of systems correspond to housing dairy farms that use total mixed ration (TMR) diets (gen-erally, central Chile). At present, there are no studies re-garding the content and proportion of CLA isomers in the Los Lagos region, the largest milk production area in the country. Furthermore, the distribution of CLA in dairy products commercially available in Chile is unknown. However, it is well accepted that milk undergoes changes during its preparation or processing, which may include moderate or severe heat treatments, that can lead to un-desirable changes in lipids and proteins (Herzallah et al., 2005). Semma (2002) reported that milk lipids could un-dergo chemical and physical changes during processing
and storage, such as auto-oxidation and formation of trans
average milk production of 17.8 ± 3.20 kg d−1, milk fat
percentage of 3.67 ± 3.6 and protein percentage of 3.42 ± 1.4. Raw milk samples were collected from the tanks of a Chilean milk company, located in the Osorno sector (Los Lagos region, 6 reception tanks) and the Los Angeles sector (Bio-Bio region, 5 reception tanks). Each tank had a capacity of 120,000 L and milk was kept at 8 °C. Three
samples of 100 mL were collected in each sector at
15-day intervals during the summer (n = 18), autumn (n = 18), and spring (n = 18), according to the protocol laid down by the International Dairy Federation (IDF, 1995). These samples were transported to the laboratory in iso-lated-thermo boxes at 4 °C and subsequently stored at -80 °C until analysis.
Dairy products - Collection of dairy products was made over three years. Samples of sweetened condensed milk (sample weight: 0.40 kg) were obtained from a Chil-ean milk company plant located in Los Angeles (two sam-ples per month, n = 72). Powdered milk samsam-ples (sample weight: 4 kg) were obtained from the same milk company but now in another plant located in Osorno (two samples per month, n = 72). In addition, samples of commercial butter (sample weight: 0.12 kg, n = 14) were obtained and Gouda cheese (sample weight: 1 kg, n = 14), the most consumed cheese in Chile produced in the two major dairies in southern Chile. All samples were transported in isolated-thermo boxes at 4 °C to the laboratory and subsequently stored at 4 °C until analysis.
CLA is found in dairy products made from fresh milk. Three samples of raw milk from the tanks of milk company plants located in both the Osorno and Los Ange-les regions were collected at 10-day intervalsfor 10 months (n = 90), in accordance with the protocol laid down in the International Dairy Federation. In addition, samples of processed products previously made from raw milk were also collected, which included powdered milk (three samples per month, n = 30) obtained by evaporation (55-70 °C) and spray-drying (the air is filtered and heated to 150-250 °C) and sweetened condensed milk obtained by evaporation at 100 °C (three samples per month, n = 30). All samples were shipped in isolated-thermo boxes at 4 °C to the laboratory and subsequently stored at 4 °C until analysis.
Determination of CLA content and composition
The CLA content of isomers (cis-9, trans-11;
trans-10, cis-12; cis-10, cis-12) in raw milk and dairy prod-uct samples were determined by the Folch method, using a mixture of chloroform and methanol (2:1, v:v). Indi-vidual CLA isomers were identified by comparing their retention times with those of an authenticated standard FA mix. The fatty acids were analyzed by gas chromatog-raphy after transesterification of FA to FA methyl esters as previously described by Avilez et al., (2012). Briefly, FA methyl esters were analyzed by gas chromatography, Flame Ionization Detector (FID), a capillary column SP-2560 (100 m, 0.25 mm i.d. with 0.20 µm thickness in the stationary phase) using He as the tracer gas. Gas
chroma-tography conditions were as follows: the injection volume was 0.5 µL, a split injection was used (70:1, v:v); ultrapure hydrogen was the carrier gas; and the injector and de-tector temperatures were 250 and 300 ºC, respectively. The initial temperature was 70 ºC (maintained for 1 min),
increased by 5 ºC min−1 to 100 ºC (held for 3 min), then
by 10 ºC min−1 to 175 ºC (held for 40 min), and then
again by 5 ºC min−1 to 220 ºC (maintained for 19 min) for
a total run time of 86.5 min. Data were then quantified using the HPCHEM Stations software, and expressed as a percentage of area according to the total FA identified.
Statistical analysis
CLA content data were analysed using the general linear model (GLM) in the SPSS for Windows 18.0 pack-age. For the distribution of CLA content in dairy products, a global or partial comparison of means was analyzed, including the fixed effect of type of product, as well as the dairy production systems and season of sample harvest-ing (for raw milk), or the year of harvest (for processed products). For the effect of processing raw milk into dairy products on the CLA content, the fixed effects of the type of product and month were considered. Pairwise compar-isons of means were carried out, where appropriate, using Tukey's honest significant difference tests, considering a level of significance of 5 %.
Results and discussion
CLA content of commercial dairy products
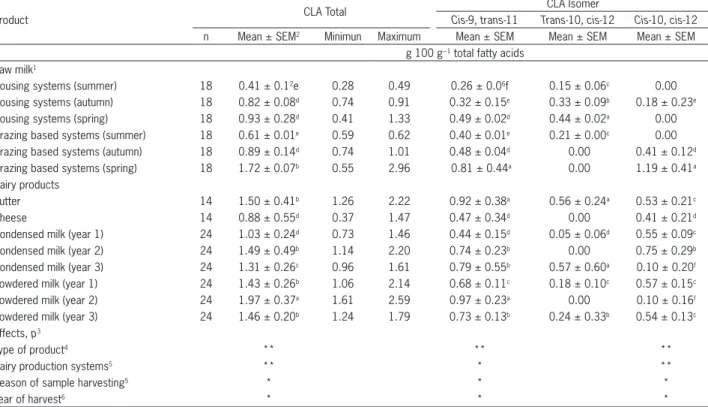
Table 1 presents the CLA content in raw milk of bulk tank commercial dairy plants and in dairy products. Raw milk presented total CLA mean values between
1.72 g 100 g−1 total FA in spring milk from the Osorno
region and 0.42 g 100 g−1 in summer milk from the Los
Angeles region. The total CLA content of dairy products showed average values with greater variability, ranging
from 0.88 g 100 g−1 of total FA in cheese up to 1.50 g
100 g−1 in butter; 1.49 g 100 g−1 in sweetened condensed
milk and 1.97 g 100 g−1 in powdered milk. Comparing
total CLA content and its isomers in all products tested,
the dairy products presented higher contents (p≤ 0.01)
when compared with raw milk, except for spring milk from the Osorno region. Similarly, the amount of CLA
in raw milk differed (p≤ 0.05) by season and geographic
region, with higher levels during the spring and in the Osorno region, but no differences were observed be-tween regions during autumn. Furthermore, differences between years were observed for sweetened condensed milk and powdered milk, with higher CLA levels in the second year when compared to the first and third ones.
A study conducted in Germany reported
maxi-mum CLA values in raw milk of 1.16 g 100 g−1 of total
FA (Fritsche and Steinhart, 1998). In France, Laloux et
al., (2007) reported 0.04 g 100 g−1, and 0.72 g 100 g−1 of
total FA was reported in Portugal (Martins et al., 2007). These values were lower than those found in the present
g 100 g−1 of total FA in Osorno). However, CLA values
from previous studies refer only to cis-9, trans-11 isomer
in the German study, total CLA in the French study, and
17 isomers with a greater proportion of cis-9, trans-11, in
the study conducted in Portugal.
CLA values found in the present study could be related to the dairy cattle production system of each re-gion, and particularly with the type of diet. In the case of the Los Lagos region (Osorno), the diet is based mainly on grazing, whereas the productive system of the Bio-Bio region (Los Angeles), has housing and TMR diets. There is strong evidence that milk produced from graz-ing animals had higher CLA concentrations in their milk compared to non or low grazing animals (Butler et al., 2008; Rego et al., 2008; Gómez-Cortés et al., 2009). Also, seasonal differences in CLA content may be related to differences in diet quality, mainly due to ingestion and nutritional composition of the herbage (Dewhurst et al., 2006). Lower CLA content in milk have been observed where cows were grazing mature pastures, and this ef-fect has been attributed to the declining quantity and quality of the herbage (Ward et al., 2003; Avilez et al., 2012). In this respect, CLA content in the milk increased during the spring season when cows were fed on high
quality pasture (1.20 g 100 g−1 of total FA) compared to
the summer season (0.90 g 100 g−1) and the autumn (1.00
g 100 g−1) (Thomson et al., 2003). In previous studies,
neither sites of sampling nor the type of animal produc-tion system deployed had been menproduc-tioned as determin-ing factors. In Chile, the levels of CLA from raw milk re-ceived in the Osorno region are very important because the volume of milk collected in this region represents around 71 % of the total national milk production. In addition, these values of CLA in raw milk and processed products are higher than those reported in the interna-tional literature.
In dairy products, international researchers have
reported CLA values of 0.40 g 100 g−1 of total FA in
mature cheese and from 0.29 to 0.71 g 100 g−1 in fresh
cheese in Germany (Fritsche and Steinhart, 1998); 0.39,
0.80 and 0.16 g 100 g−1 in Beaufort, Blue and
Camem-bert cheeses, respectively, in France (Laloux et al., 2007);
and 0.48 g 100 g−1 in cheese without (type not specified)
in Portugal (Martins et al., 2007). On the other hand, cheeses, such as Parmesan and Romano, with ripeness over 10 months were among the cheeses with lower
amounts of CLA (less than 0.50 g 100 g−1 of total FA;
Henning et al., 2006). In the case of butter, values from
0.48 to 0.51 g 100 g−1 have been reported (Mir et al.,
2003; Laloux et al., 2007; Martins et al., 2007). In sweet-ened condensed milk, Chin et al., (1992) indicated
val-ues below 0.70 g 100 g−1. Thus, the results presented in
this study, for similar products, have higher values than those mentioned above.
Table 1 − Conjugated linoleic acid contents (CLA) in raw milk of bulk tank commercial dairy plants and in dairy products.
Product CLA Total
CLA Isomer
Cis-9, trans-11 Trans-10, cis-12 Cis-10, cis-12
n Mean ± SEM2 Minimun Maximum Mean ± SEM Mean ± SEM Mean ± SEM
g 100 g−1 total fatty acids Raw milk1
Housing systems (summer) 18 0.41 ± 0.12e 0.28 0.49 0.26 ± 0.06f 0.15 ± 0.06c 0.00
Housing systems (autumn) 18 0.82 ± 0.08d 0.74 0.91 0.32 ± 0.15e 0.33 ± 0.09b 0.18 ± 0.23e
Housing systems (spring) 18 0.93 ± 0.28d 0.41 1.33 0.49 ± 0.02d 0.44 ± 0.02a 0.00
Grazing based systems (summer) 18 0.61 ± 0.01e 0.59 0.62 0.40 ± 0.01e 0.21 ± 0.00c 0.00
Grazing based systems (autumn) 18 0.89 ± 0.14d 0.74 1.01 0.48 ± 0.04d 0.00 0.41 ± 0.12d
Grazing based systems (spring) 18 1.72 ± 0.07b 0.55 2.96 0.81 ± 0.44a 0.00 1.19 ± 0.41a
Dairy products
Butter 14 1.50 ± 0.41b 1.26 2.22 0.92 ± 0.38a 0.56 ± 0.24a 0.53 ± 0.21c
Cheese 14 0.88 ± 0.55d 0.37 1.47 0.47 ± 0.34d 0.00 0.41 ± 0.21d
Condensed milk (year 1) 24 1.03 ± 0.24d 0.73 1.46 0.44 ± 0.15d 0.05 ± 0.06d 0.55 ± 0.09c
Condensed milk (year 2) 24 1.49 ± 0.49b 1.14 2.20 0.74 ± 0.23b 0.00 0.75 ± 0.29b
Condensed milk (year 3) 24 1.31 ± 0.26c 0.96 1.61 0.79 ± 0.55b 0.57 ± 0.60a 0.10 ± 0.20f
Powdered milk (year 1) 24 1.43 ± 0.26b 1.06 2.14 0.68 ± 0.11c 0.18 ± 0.10c 0.57 ± 0.15c
Powdered milk (year 2) 24 1.97 ± 0.37a 1.61 2.59 0.97 ± 0.23a 0.00 0.10 ± 0.16f
Powdered milk (year 3) 24 1.46 ± 0.20b 1.24 1.79 0.73 ± 0.13b 0.24 ± 0.33b 0.54 ± 0.13c
Effects, p3
Type of product4 ** ** **
Dairy production systems5 ** * **
Season of sample harvesting5 * * *
Year of harvest6 * * *
0.72 g d−1 (Martins et al., 2007). Ritzenthaler et al., (2001)
suggested that optimal consumption of CLA should be
be-tween 15 and 20 g d−1, whereas rich consumption should
be around 65 g d−1 (Park et al., 2001). On the contrary, Ip
et al., (1999) suggested an optimal CLA consumption of
3.0 g d−1 for a 70 kg person to reap health benefits. Daily
CLA consumption in Chile, considering the contents of CLA found in the present study, ranged between 0.03 and 0.24 g d−1.
Evaluation of the CLA content in dairy products af-ter processing
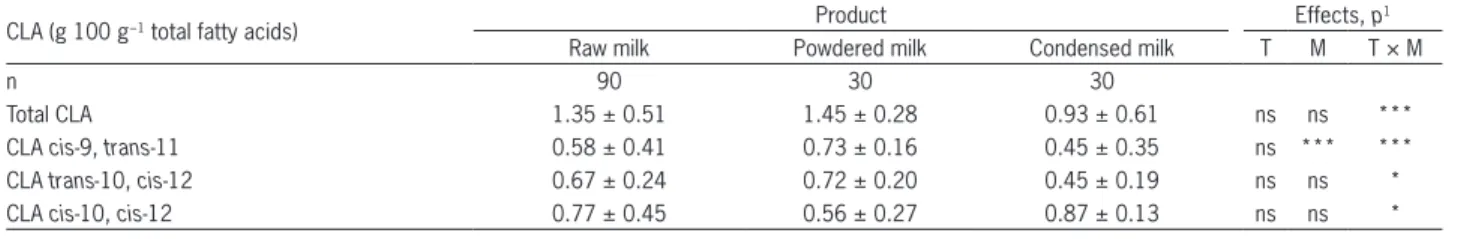
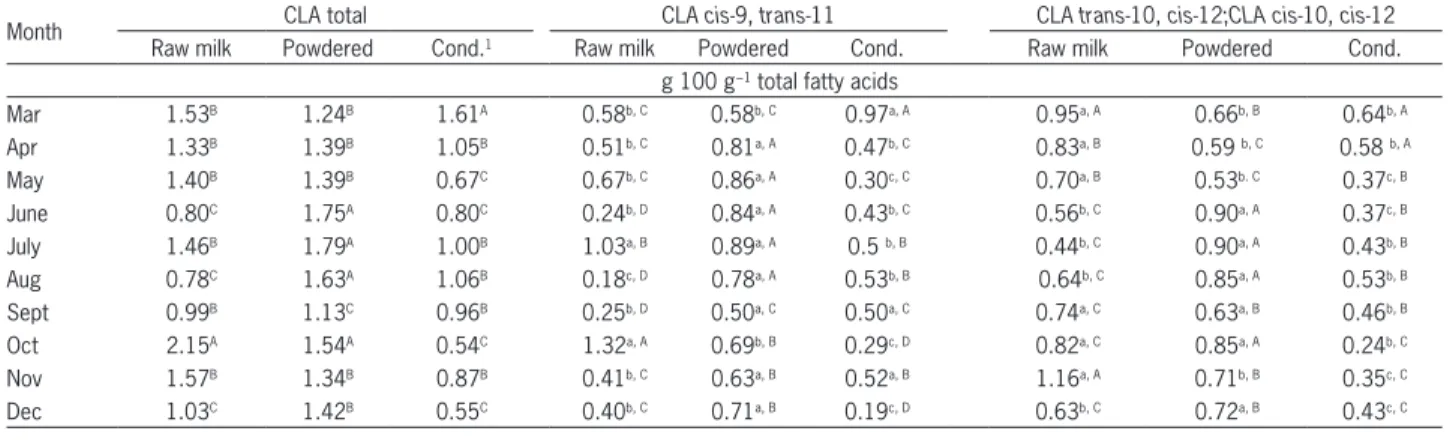
The amounts of total CLA and each of their isomers in raw milk observed at commercial dairy plants and those found in processed products obtained from that milk are shown in Table 2. A significant interaction between prod-uct type and sampling month was observed (Table 3 and Figure 1). In general, raw milk presented higher CLA contents during the autumn (March to May) and spring-time (especially October and November) months when compared to the wintertime (especially June and August) months. In contrast, powdered and sweetened condensed milk products presented higher values during the win-ter months, albeit with greawin-ter variability, especially in sweetened condensed milk. Furthermore, sweetened condensed milk collected in most of the months studied (specifically 6 out of the 10 sampling months) had lower CLA content than raw milk and powdered milk although the latter showed similar values to those found in raw milk, and even in 4-5 months of the study, showed higher values, most of them coinciding with the months (winter) of lowest values obtained for raw milk.
Table 1 summarizes the content of CLA isomers. The cis-9, trans-11 presented a range between a minimum
of 0.26 g 100 g−1 of total FA in summer for raw milk from
the Los Angeles region and a maximum of 1.26 g 100 g−1
in butter from the Osorno region. This isomer represents 53 % of total CLA, with higher values in the Osorno re-gion. In the case of sweetened condensed milk, this
iso-mer ranged from 0.44 to 0.74 g 100 g−1, depending on
the year; while cheese and butter had a range of 0.37 -
1.47 and 1.26 - 2.22 g 100 g−1, respectively. The isomer
trans-10, cis-12 had a range of 0.15 to 0.44 g 100 g−1 for
total FA in raw milk received at the plants. This isomer was not detected in milk samples collected during the au-tumn and spring in the Osorno region. In dairy products, the levels of this isomer ranged from 0.00 to 0.56 g 100
g−1 of total FA. The isomer cis-10, cis-12 presented higher
proportions during springtime in raw milk from Osorno
region (1.19 g 100 g−1 of total FA), as well as in condensed
and powdered milk (0.75 and 0.57 g 100 g−1 of total FA,
respectively). As for the total amount of CLA, this isomer reached about 50 % in sweetened condensed milk and powdered milk, this being the major isomer found in raw milk in springtime from the Osorno region.
In the literature values have been reported of 0.70 g
100 g−1 of total FA for the cis-9, trans-11 isomer for
sweet-ened condensed milk (Shantha et al., 1995); whereas in
cheese, values of 0.32 and 0.89 g 100 g−1 have been
re-ported with an average of 0.35 g 100 g−1 (Martins et al.,
2007). The same authors reported values of 0.38 for
but-ter, as well as values of 1.32 g 100 g−1 for this product
(Shantha et al., 1995).
The isomer trans-10, cis-12 would be present in
amounts of only 3 to 5 % of the total CLA in milk (Par-odi, 1999) and less than 1 % in dairy products (Martins et al., 2007). However, in the present study, the values obtained were higher than those reported in the litera-ture, which is remarkable given its important
physiologi-cal role. Also, the contents of cis-10, cis-12 isomer were
higher than those reported in the literature (less than 0.01 %). Furthermore, it has not been detected in either butter or cheese (Martins et al., 2007). It is thus important, given the high proportion observed in this study, to determine their biological function.
In Germany, human consumption of CLA from
dairy products is estimated in 0.24 g d−1 (Fritsche and
Steinhart, 1998). In France, it ranges from 0.17 to 0.21
g d−1 (Laloux et al., 2007), and in Portugal from 0.40 to
Table 2 − Contents of conjugated linoleic acid (CLA) in dairy products made from cows’ fresh milk.
CLA (g 100 g−1 total fatty acids) Product Effects, p
1
Raw milk Powdered milk Condensed milk T M T × M
n 90 30 30
Total CLA 1.35 ± 0.51 1.45 ± 0.28 0.93 ± 0.61 ns ns ***
CLA cis-9, trans-11 0.58 ± 0.41 0.73 ± 0.16 0.45 ± 0.35 ns *** *** CLA trans-10, cis-12 0.67 ± 0.24 0.72 ± 0.20 0.45 ± 0.19 ns ns *
CLA cis-10, cis-12 0.77 ± 0.45 0.56 ± 0.27 0.87 ± 0.13 ns ns *
1T, Product type; M, Sample months; T × M interaction; *p≤ 0.05; ***p≤ 0.001; ns: not significant, p > 0.05.
Conclusion
Higher values were found in raw milk obtained from regions with dairy farms based on grazing systems compared to regions with dairy farms based on total mixed ration and housing. Likewise, dairy products had significantly higher CLA content than raw milk. The
most important CLA isomer across regions was the cis
-9, trans-11 isomer, whereas the amounts of the isomers
trans-10, cis-12 and cis-10, cis-12 were higher than those reported in the literature. Consumption of dairy prod-ucts in Chile is lower than other countries, but the high amounts of CLA found in Chilean dairy products studied provide a level that is adequate for human health.
Milk processing significantly affected the transfer-ring of CLA from raw milk into dairy products (sweet-ened condensed milk and powdered milk). For both, total CLA and isomers, sweetened condensed milk presented lower CLA contents than the original raw milk and pow-dered milk. Instead, powpow-dered milk showed similar or above values to those observed in raw milk. More re-search is needed to elucidate the exact effect of process-ing and storage conditions of milk and dairy products on CLA content.
Acknowledgments
The authors thank CONICYT (the National Com-mission for Scientific and Technological Research) and the milk company for funding this research (FONDEF Project N° D02I1135 “Development of products with high con-tent of functional active principles from cows' milk and its derivatives”).
References
Avilez, J.; Escobar, P.; Diaz, C.; von Fabeck, G.; Matamoros, R.; García, F.; Alonzo, M.; Delgado-Pertíñez, M. 2012. Effect of extruded whole soybean dietary concentrate on conjugated linoleic acid concentration in milk in Jersey cows under pasture conditions. Spanish Journal of Agricultural Research 10: 409-418.
Variation in CLA concentration in dairy products is essentially a function of their original concentration (in raw milk). Nevertheless, the results of the effect of processing conditions, storage, and packaging on the CLA content of various types of dairy products are unclear.
Coakley et al., (2007) reported that cis-9, trans-11 and cis
-10, trans-12 isomers were not significantly affected by milk processing to produce cheese made with standard processes (pasteurization of milk and subsequent cooling at 30 °C, 6 months of ripening of cheese at 8 °C). Howev-er, Shantha et al. (1995) detected a decrease in total CLA in cheese samples after 10 wks of refrigerated storage (4 °C). Also, Herzallah et al., (2005) reported decreases in CLA content of 21 and 53 % in cheeses heated to 94 ± 1.0 °C in a microwave oven for 5 and 10 min, respectively.
These authors also observed a decrease in trans isomers
of pasteurized cheese at 63 °C for 30 min or heated in a microwave at 96 °C for 5 min. The decline of CLA con-tent in milk after heating may be due to the action of free radicals, which are formed as a result of lipid oxida-tion (Leung and Liu, 2000). Other studies have detected new CLA isomers in ripened cheeses (Werner et al., 1992; Lavillonière et al., 1998; Sehat et al., 1998), and it has been hypothesized that biohydrogenation of linolenic acid in cheese could lead to the formation of CLA isomers as intermediates (Gnädig et al., 2004). Moreover, refriger-ated storage and thermal treatment resulted in significant declines in or even disappearance of a number of minor
CLA isomers, plus a significant increasing of trans-trans
isomers from both cis-trans, trans-cis, and cis-cis isomers
especially in CLA-fortified milk powder as well as in fer-mented milk, yogurt, and milk-juice blends (Rodríguez-Alcalá and Fontecha, 2007). In this study, CLA contents increased in powdered milk, especially in those months in which the original raw milk had lower CLA values,
which could be explained by increases in the trans
iso-mers, though only three isomers were analysed. However, more research is needed to elucidate the exact effect of processing and storage conditions of milk and dairy prod-ucts on the CLA content.
Table 3 − Contents of conjugated linoleic acid (CLA) in dairy products made from cows’ fresh milk according to month.
Month CLA total CLA cis-9, trans-11 CLA trans-10, cis-12;CLA cis-10, cis-12
Raw milk Powdered Cond.1 Raw milk Powdered Cond. Raw milk Powdered Cond.
g 100 g−1 total fatty acids
Mar 1.53B 1.24B 1.61A 0.58b, C 0.58b, C 0.97a, A 0.95a, A 0.66b, B 0.64b, A
Apr 1.33B 1.39B 1.05B 0.51b, C 0.81a, A 0.47b, C 0.83a, B 0.59 b, C 0.58 b, A
May 1.40B 1.39B 0.67C 0.67b, C 0.86a, A 0.30c, C 0.70a, B 0.53b. C 0.37c, B
June 0.80C 1.75A 0.80C 0.24b, D 0.84a, A 0.43b, C 0.56b, C 0.90a, A 0.37c, B
July 1.46B 1.79A 1.00B 1.03a, B 0.89a, A 0.5 b, B 0.44b, C 0.90a, A 0.43b, B
Aug 0.78C 1.63A 1.06B 0.18c, D 0.78a, A 0.53b, B 0.64b, C 0.85a, A 0.53b, B
Sept 0.99B 1.13C 0.96B 0.25b, D 0.50a, C 0.50a, C 0.74a, C 0.63a, B 0.46b, B
Oct 2.15A 1.54A 0.54C 1.32a, A 0.69b, B 0.29c, D 0.82a, C 0.85a, A 0.24b, C
Nov 1.57B 1.34B 0.87B 0.41b, C 0.63a, B 0.52a, B 1.16a, A 0.71b, B 0.35c, C
Dec 1.03C 1.42B 0.55C 0.40b, C 0.71a, B 0.19c, D 0.63b, C 0.72a, B 0.43c, C
Bisig, W.; Eberhard, P.; Collomb, M.; Rehberger, B. 2007. Influence of processing on the fatty acid composition and the content of conjugated linoleic acid in organic and conventional dairy products: a review. Lait 87: 1-19.
Butler, G.; Nielsen, H.; Slots, T.; Seal, C.; Eyre, M.; Sanderson, R.; Leifert, C. 2008. Fatty acid and fat-soluble antioxidant concentrations in milk from high- and low-input conventional and organic systems: seasonal variation. Journal of the Science Food and Agriculture 88:1431-1441.
Chin, S.; Liu, W.; Storkson, J.M.; Ha, L.; Pariza, M. 1992. Dietary sources of conjugated dienoic isomers of linoleic acid, a newly recognized class of anticarcinogens. Journal of Food Composition and Analysis 5: 185-197.
Coakley, M.; Barrett, J.; Murphy, R.; Ross, R.; Stanton, C. 2007. Cheese manufacture with milk with elevated conjugated linoleic acid levels caused by dietary manipulation. Journal of Dairy Science 90: 2919-2927.
Collomb, M.; Schmid, A.; Sieber, R.; Wechsler, D.; Ryhänen, E. 2006. Conjugated linoleic acids in milk fat: variation and physiological effects. International Dairy Journal 16: 1347-1361. Dewhurst, R.J.; Shingfield, K.J.; Lee, M.R.; Scollan, N.D. 2006.
Increasing the concentrations of beneficial polyunsaturated fatty acids in milk produced by dairy cows in high-forage systems. Animal Feed Science and Technology 131: 168-206.
Fritsche, J.; Steinhart, H. 1998. Amounts of Conjugated Linoleic Acid (CLA) in German foods and Evaluation of daily intake. Z Lebensm Unters Forsh 206: 77-82.
Gnädig, S.; Chamba, J.F.; Perread, E.; Chappaz, S.; Chardigny, J.M.; Rickert, R.; Steinhart, H.; Sébédio, J.L. 2004. Influence of manufacturing conditions on the conjugated linoleic acid content and the isomer composition in ripened French Emmental cheese. Journal of Dairy Research 71: 367-371.
Gómez-Cortés, P.; Frutos, P.; Mantecón, A.R.; Juárez, M.; de la Fuente, M.A.; Hervás, G. 2009. Effect of supplementation of grazing dairy ewes with a cereal concentrate on animal performance and milk fatty acid profile. Journal of Dairy Science 92: 3964-3972. Henning, D.R.; Baer, R.J.; Hassan, A.N.; Dave, R. 2006. Major
advances in concentrated and dry milk products, cheese and milk fat-based spreads. Journal of Dairy Science 89: 1179-1188. Herzallah, S.M.; Humeid, M.A.; Al-Ismail, K.M. 2005. Effect of
heating and processing methods of milk and dairy products on conjugated linoleic acid and trans fatty acid isomer content. Journal of Dairy Science 88: 1301-1310.
Hervás, G.; Luna, P.; Mantecón, A.R.; Castañares, N.; de la Fuente, M.A.; Juárez, M.; Frutos, P. 2008. Effect of diet supplementation with sunflower oil in milk production, fatty acid profile and ruminal fermentation in lactating dairy ewes. Journal of Dairy Research 75: 399-405.
International Dairy Federation [IDF]. 1995. Milk and Milk Products. Guidance on Sampling. FIL-IDF, Brussels, Belgium. (Standard No. 50C).
Ip, C.; Banni, S.; Angioni, E.; Carta, G.; McGinley, J.; Thompson, H.J.; Barbano, D.; Bauman, D. 1999. Conjugated linoleic acid-enriched butter fat alters mammary gland morphogenesis and reduces cancer risk in rats. Journal of Nutrition 129: 2135-2142. Laloux, L.; du Chaffaut, L.; Razanamahefa, L.; Lafay, L. 2007.
Trans fatty acid content of foods and intake levels in France. European Journal of Lipid Science and Technology 109: 918-929.
Lavillonière, F.; Martin, J.C.; Bougnoux, P.; Sébédio, J.L. 1998. Analysis of conjugated linoleic acid isomers and content in French cheeses. Journal of the American Oil Chemists Society 75: 343-352. Leung, Y.H.; Liu, R.H. 2000. Trans-10, cis-12-conjugated linoleic
acid isomer exhibits stronger oxyradical scavenging capacity than cis-9, trans-11-conjugated linoleic acid isomer. Journal of Agriculture and Food Chemistry 48: 5469-5475.
Martins, S.V.; Lopes, P.A.; Alfaia, C.M.; Ribeiro, V.S.; Guerreiro, T.V.; Fontes, C.M.; Castro, M.F.; Soveral, G.; Prates, J.A. 2007. Contents of conjugated linoleic acid isomers in ruminant-derived foods and estimation of their contribution to daily intake in Portugal. British Journal of Nutrition 98: 1206-1213.
Mir, P.S.; Okine, E.K.; Goonewardene, L.; He, M.L.; Mir, Z. 2003. Effects of synthetic conjugated linoleic acid (CLA) or bio-formed CLA as high CLA beef on rat growth and adipose tissue development. Canadian Journal of Animal Science 83: 583-592. Park, Y.; Albright, K.J.; Cai, Z.Y.; Pariza, M.W. 2001. Comparison of
methylation procedures for conjugated linoleic acid and artifact formation by commercial (trimethylsilyl) diazomethane. Journal of Agriculture and Food Chemistry 49: 1158-1164.
Parodi, P.W. 1999. Conjugate linoleic acid and other anticarcinogenic agents of bovine milk fat. Journal of Dairy Science 82: 1339-1349. Rego, O.A.; Rosa, H.J.; Regalo, S.M.; Alves, S.P.; Alfaia, C.M.; Prates, J.A.;
Vouzela, C.M.; Bessa, R.J. 2008. Seasonal changes of CLA isomers and other fatty acids of milk fat from grazing dairy herds in the Azores. Journal of the Science of Food and Agriculture 88: 1855-1859. Ritzenthaler, K.L.; McGuire, M.K.; Falen, R.; Shultz, T.D.;
Dasgupta, N.; McGuire, M.A. 2001. Estimation of conjugated linoleic acid intake by written dietary assessment methodologies underestimates actual intake evaluated by food duplicate methodology. Journal of Nutrition 131: 1548-1554.
Rodríguez-Alcalá, L.M.; Fontecha, J. 2007. Fatty acid and conjugated linoleic acid (CLA) isomer composition of commercial CLA-fortified dairy products: evaluation after processing and storage. Journal of Dairy Science 90: 2283-2290.
Sehat, N.; Kramer, J.K.; Mossoba, M.M.; Yurawecz, M.P.; Roach, J.G.; Eulitz, K.; Morehouse, K.M.; Ku, Y. 1998. Identification of conjugated linoleic acid isomers in cheese by gas chromatography, silver ion high performance liquid chromatography and mass spectral reconstructed ion profiles. Comparison of chromatographic elution sequences. Lipids 33: 963-971.
Semma, M. 2002. Trans fatty acids: properties, benefits and risks. Journal of Health Science 48: 7-13.
Shantha, N.C.; Ram, L.N.; O’Leary, J.; Hicks, C.L.; Decker, E.A. 1995. Conjugated linoleic acid concentrations in dairy products as affected by processing and storage. Journal of Food Science 60: 695-697. Thomson, N.A.; Chand, A.; Kay, J.K. 2003. Predicting D9-desaturase
activity and the association with conjugated linoleic acid (CLA) concentration in bovine milk. Proceedings of the New Zealand Society of Animal Production 63: 25-30.
Ward, A.T.; Wittenberg, K.M.; Froebe, H.M.; Przybylski, R.; Malcolmson, L. 2003. Fresh forage and solin supplementation on conjugated linoleic acid levels in plasma and milk. Journal of Dairy Science 86: 1742-1750.