Ecophysiology of deciduous plants grown at
different densities in the semiarid region of Brazil
Marlete Moreira de Sousa Mendes
1*, Claudivan Feitosa de Lacerda
2, Francisco Éden
Paiva Fernandes
3, Ana Clara Rodrigues Cavalcante
3, Teógenes Senna de Oliveira
41Departamento de Biologia, Universidade Federal do Ceará, (UFC), Fortaleza, CE, Brazil. 2Departamento de Engenharia Agrícola, UFC, Fortaleza, CE, Brazil.
3Embrapa Caprinos e Ovinos, Sobral, CE, Brazil. 4Departamento de Solos, CCA, UFV, Viçosa, MG, Brazil. *Corresponding author: [email protected] Received: 26 October 2012; Accepted: 03 July 2013
ABSTRACT: Physiological differences in the Cordia oncocalyx tree growing at different densities in two distinct areas were investigated. An agrosilvopastoral system (AGP) and a secondary forest (SF) were studied. Under both types of land-use, C. oncocalyx presented a relative frequency of approximately 50%, and absolute densities of 670 and 80 individuals per hectare, respectively. Net photosynthesis (A), stomatal conductance (gs), and transpiration (E) were measured, and the SPAD index was recorded in sun leaves from the canopy and shade leaves from the lower canopy, in both the wet and dry seasons. We quantified the dry biomass of leaves and fruit on a per-tree basis at the end of the wet season. Net photosynthesis was higher in shaded leaves in the AGP in the wet season, reaching an average of 4.8 µmol m-2 s-1 against 3.2 µmol m-2 s-1 under SF. As trees began to shed their leaves at the beginning of the dry season and more radiation reached the shaded leaves, there was an increase in SF for A, depending on the intensity of light reaching the leaves. In the sun leaves, gas exchange was similar for the land-use systems during the wet season, but stronger in AGP than under SF during the dry season. This happened when the leaves in AGP retained more relative water content during a period of low gravimetric levels of the soil water. The lower tree density in AGP promoted a higher SPAD index and dry biomass in both the sun and shaded leaves, and allowed greater A, E and gs rates in the sun leaves at the beginning of the dry period.
KEYWORDS: agroforestry system, chlorophyll, Cordia oncocalyx, dry biomass, leaf gas exchange, secondary forest.
INTRODUCTION
With the growing world population, the demand for new areas for agriculture or livestock is also increasing, leading to more deforestation. In the face of the non-sustainability of conventional and traditional farming methods, alternative management regimes have been proposed, among which are agroforestry systems such as the silvopastoral, the silvicultural and the agrosilvopastoral systems. The agrosilvopastoral system proposes the combination of trees with agriculture and livestock.
In Brazil, studies about agroforest have been carried out mainly in the Amazon and the Atlantic Forest region, focusing
on plantations of cupuaçu and pupunha (Alfaia et al. 2004),
cocoa (Moço et al. 2010) and coffee (Souza et al. 2012). In the semiarid region of Brazil, studies have focused on the cultivation of maize and pasture, investigating aspects such as water and nutrient loss (Aguiar et al. 2010), physical quality of the soil (Silva et al. 2011), floristics and phytosociology (Campanha et al. 2011), nutrient dynamics, and microclimate (Menezes et al. 2002, Maia et al. 2008). However, there is no information as to the ecophysiology of plants.
In northeastern Brazil, where the Caatinga vegetation
cultivation and, finally, abandonment of the area (IBGE 2006). In this region, the establishment of agroforestry systems can allow the preservation of trees and the physical characteristics of the environment, together with the breeding of animals and/or production of plants.
Studies that consider the effect of reduced tree density while assessing physiological alterations in native trees or cultivated plants in agroforestry are scarce, and little is known about this topic. It is possible that tree height and biomass be negatively affected by the implementation of agroforestry systems (Lott et al. 2000, Singh et al. 2007). On the other hand, Will et al. (2001) did not observe any effect of plant density on leaf respiration or net photosynthesis. Therefore, it is important to understand how reduced plant density under an agroforestry system may influence the physiological processes of trees, which will ultimately impact on the productivity of the trees and of the system as a whole.
Based on observations made in experimental areas of Sobral, Ceará, in northeastern Brazil, it was noted that trees in secondary forests begin to shed their leaves earlier than those found in agrosilvopastoral systems. It was hypothesized that under land-use systems where tree density is lower, such as agrosilvopastoral systems, leaf gas exchange and tree biomass are higher in comparison to those of the forest.
Cordia oncocalyx is a common native tree, widely distributed
across the semiarid region of Brazil (Carvalho 2008). Those physiological variations were investigated, which occur in
C. oncocalyx growing both under an agrosilvopastoral system and in the secondary forest, and which could justify the choice of agroforestry as a cropping system in other semiarid regions.
MATERIAL AND METHODS
Study areas: The study areas are located in the Crioula Farm, at the National Goat and Sheep Research Center, which belongs to EMBRAPA in Sobral, Ceará, northeastern Brazil (Figure 1). The location is in the semiarid region of Ceará (3°41′S and 40°20′W), at a 70 m height, with a slope of 3 to 20%. The average annual temperature is 30ºC, and the average annual rainfall is 821 mm, with rains concentrated between February and May. The soils are Orthic Chromic Luvisol and the typical Orthic Hypochromic Luvisol (Aguiar et al. 2006). Rainfall during the study is presented in Figure 2. The prevalent
vegetation in the area is the woody savanna(locally known
as Caatinga) (Woodward et al. 2004) consisting mostly of deciduous species that lose their leaves during the dry season, which is from June to January.
In 1997, a long-term experiment was established by EMBRAPA to evaluate agroforestry as an alternative to traditional and conventional agricultural systems in the region.
Figure 1. Map showing the experimental areas of the National Goat and Sheep Research Centre belonging to EMBRAPA, in the Crioula Farm, Sobral, Ceará, Brazil. AGP – agrosilvopastoral system, SILV – silvopastoral system, TR – traditional cropping, SF – secondary forest and TRAN – transition zones. Numbers (1 and 2) correspond to study areas used in this experiment. Source: adapted from Campanha et al. (2009).
Experimental Areas on Crioula Farm
Brazil
Caption: AGP
352600 352500 352400 352200
Sobral
352700 352300
Ceará
352800
9582850
9583000
9583150
9583450
9582700
9583300
9582550
352600 352500 352400
352200 352300 352700 352800
9582850
9583000
9583150
9583450
9582700
9583300
9582550
SILV TR SF TRAN
0 40 80 160 240
The systems evaluated in the experiment included: traditional cropping, agrosilvopastoral and silvopastoral, with a secondary forest used as control. Two of these systems were selected for the present study. The agrosilvopastoral system (AGP) corresponds
to an area of 1.6 ha of Caatinga, where maize (Zea mays L.) or
sorghum (Sorghum bicolor L. Moench) are cultivated in 3 m
wide alleys separated by rows of leucaena [Leucaena leucocephala
(Lam.) de Wit]. Some trees were removed when the system was established, leaving approximately 200 trees per hectare, corresponding to 22% of the ground cover. No fertilizers were used and crop and tree management was carried out exclusively by hand. The secondary forest (SF) corresponds to
an area of 1.6 ha of Caatinga, with secondary vegetation that is
approximately 50 years old covering 90% of the ground. The areas are separated by a 800 m distance, and both are the same age. All the trees in the area were tillered before the experiment began because wood had been removed by the local population. However, for a long time (about 50 years), no wood had been removed from the area. In 1997, when the experiment was set up, the trees in AGP were pruned to leave only the trunk with the largest diameter. As a consequence of these managements, in SF the trees continue tillered, with the diameter of individual shoots between 0.05 and 0.11 m, and the total for all shoots in individual trees varying between 0.25 and 0.28 m. In 2011, the trunks in AGP presented an average diameter, at breast height, of 0.30 m.
Plant Species Studied: Nine tree species are found in
the two areas, four being common to both: Cordia oncocalyx
Allemão, Mimosa caesalpiniifolia Benth., Poincianella bracteosa
(Tul.) L.P. Queiroz, and Bauhinia cheilantha (Bong.) Steud.
(Campanha et al. 2011). Cordia oncocalyx Allemão (locally
known as pau-branco), a member of the Boraginaceae, is
abundant, presenting 670 individuals per hectare in SF and 80 individuals per hectare in AGP. This species was chosen due to its high frequency of 49.1% under SF and 50% in AGP (Campanha et al. 2008), and because it presents complete leaf abscission at different periods in the two study
areas.The analyzed trees were on average 8.2±0.3 m high in
AGP, and 9.0±0.5 m high under SF, producing leaves and
flowering at the beginning of the wet season (between January and February). Fruiting follows in March, and the fruits remain on the trees until the dry season starts ( July or August), when the plants also begin to shed their leaves.
Water content of the soil and plants: To measure the gravimetric water content of the soil, in April (wet season) and September (dry season) three samples were collected at depths of 0–0.10, 0.10–0.20, 0.20–0.40, and 0.40–0.60 m, following the procedure outlined by EMBRAPA (1997). In order to measure the water content of the leaves, five samples of branches that had been exposed to the sun were collected from each system of land use, at a height of approximately 8 m, from February to September, after photosynthetic rates had been measured. All the material was weighed immediately after collection to avoid water loss. The soil and plant samples were dried in an oven at 65ºC for the leaves and at 105ºC for the soil, for 24 h, and then weighed again to obtain the dry weight. With these data, the percentage of water in the leaves and soil was calculated.
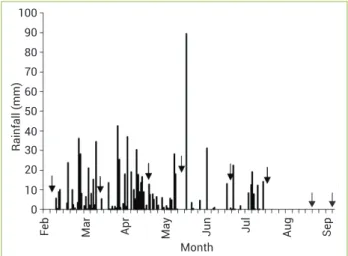
Physiological measurements: Physiological data from the wet season (February to July) were grouped together and separated from the data obtained during the dry season (in August and September). These sampling dates refer to 30 and 50 days after the final rainfall, respectively. June and July were considered as rainy months because 2011 was atypically wet, with a total volume of precipitation higher than the historical mean: the wet season beginning in the second half of December, 2010, and ending mid-July, 2011 (Figure 2).
Net photosynthesis (A), stomatal conductance (gs),
transpiration (E), leaf-to-air vapor pressure deficit (VPDleaf-to-air),
leaf temperature (Tleaf), and photosynthetically active radiation
reaching the leaf when A was measured (PAR), were recorded
with an infrared gas analyzer (LI-6400XT, LI-COR Biosciences,
USA) under conditions of natural temperature, CO2 and light.
Water use efficiency (WUE) was calculated as the ratio between
A and E.
Three sun canopy leaves and shaded leaves from the lower canopy, from three trees per system, were used for
Figure 2. Daily rainfall obtained from automatic meteorological stations installed in both experimental areas (AGP and SF), from February to September, 2011. Arrows indicate days when physiological data were measured.
90 80 70
50
Fe
b
Mar Apr May
100
60
Rainfall
(
mm)
40 30 20
0 10
Au
g
Jun Jul Sep
measurements. To reach the sun leaves, three scaffolding towers were assembled in each system, one per each tree, with a height similar to that of the plants, between eight and nine meters.
Measurements were taken from shaded and sun leaves one day a month, from February to September, between noon and 1:00 pm. In order to assess the daily cycle of gas exchange in sun leaves, measurements taken at 7–8:00 am, 10–11:00 am and 3–4:00 am between May and September were added to the data.
The SPAD index of the leaves was measured with a portable device (SPAD-502P, Minolta, Japan) that detects the intensity of the green color of the leaf. Data consisted of the average of three measurements per leaf, three leaves per tree, three trees from both the AGP and SF, and included sun and shaded leaves.
Leaf and fruit biomass: At the end of the wet season, before the beginning of leaf abscission, all the leaves from three trees in each system were collected and weighed. These trees had similar characteristics in relation to those chosen for leaf gas exchange measurements. Sun leaves, shaded leaves and fruits were separated. Three subsamples of leaves and three subsamples of fruits from each tree were then taken and dried to constant weight in an oven at 65°C in order to measure dry mass. These data were used to calculate the percentage of dry biomass (PDM %) as (DMs x 100)/FMs, in which DMs is the dry biomass of the subsample and FMs is the fresh biomass of the subsample, both in grams. To calculate the total
dry biomass of the sample (TDM, in kg tree-1), the values of
the total fresh biomass samples per tree (TFM, in kg tree-1)
were multiplied by the PDM.
Statistical analysis: Variance analysis was carried out followed by the Tukey’s test (a=5%) to evaluate the differences between seasons (wet season, 30 and 50 days after the final rainfall) and land-use systems (AGP and SF) in
Tleaf, VPDleaf-to-air, PAR, gas exchange and water use efficiency
in shaded leaves, as well as SPAD index in sun and shaded leaves. Data of the soil gravimetric moisture, leaf water content, gas exchange and water use efficiency in sun leaves, VPDleaf-to-air, at different times of the day, and the dry biomass of sun and shaded leaves, were analyzed with the Student’s
t-test. The BioEstat 5.0 software (Ayres et al. 2007) was used
to carry out statistical analyses, and figures were prepared
using the Microcal OriginTM (1997) software.
RESULTS
Water content of soil and plants: The soil gravimetric moisture content in April varied between 16 and 22% in
AGP and between 19 and 25% in SF. It differed significantly between systems only in the 0–0.1 m depth range, with greater moisture in AGP (Figure 3A). During the dry season, in September, percentages varied between 5 and 7% in AGP and 6 and 8% in SF, and moisture content was lower in AGP at all other evaluated depths (Figure 3B). In both study areas, the moisture content of the leaves varied from 60 to 70% between February and June, and from 50 to 60% starting from July. Leaf water content tended to be lower in AGP, but no significant differences were observed for most months. In September, 50 d after the final rainfall, the trend was reversed, with greater leaf water content in AGP than in SF (Figure 4).
Leaf temperature, photosynthetically active
radiation and vapor pressure deficit: The temperature
(Tleaf) of the sun leaves was higher in SF than in AGP during
the dry season, both on the 30th and 50th d after the final
rainfall. In contrast, the temperature of the shaded leaves
Figure 3. Gravimetric soil moisture in April (A) and September (B), at four depth increments, in an agrosilvopastoral system (AGP) and a secondary forest (SF) (n=3). *indicates statistically significant differences between land-use systems, by Student’s t-test (p<0.05).
25
20
15
5
A
30
10
0–0.1
Gra
vimetric
moistu
re
(
%)
0
0.1–0.2 0.2–0.4 0.4–0.6
Depth (m)
* AGP
SF
25
20
15
5
B
* 30
10
0–0.1
Gra
vimetric
moistu
re
(
%)
0
0.1–0.2 0.2–0.4 0.4–0.6
Depth (m)
* *
differed between the systems only 50 d after the final rainfall
(Table 1). In the sun leaves, Tleaf increased 3.7ºC in AGP and
6.4ºC in SF between the wet season and 50 days after the final
rainfall. In the shaded leaves, the increased Tleaf during the
same period amounted to 7.2ºC in AGP and 9.5ºC in SF. The photosynthetically active radiation (PAR) reaching the sun leaves differed between systems in the rainy period and 30 d after the final rainfall, but it was the same in both systems 50 d after the final rainfall. The PAR reaching the shaded leaves in SF was 20 times higher 50 d after the final rainfall as compared to the wet season, but PAR reaching the shaded leaves in AGP did not differ significantly in these two dates (Table 1). We
recorded strong variations in VPDleaf-to-air between the rainy
and dry seasons, in both shaded and sun leaves and in both
land-use systems. An increase in VPDleaf-to-air of more than 50%
was observed in the sun leaves in AGP, as well as an increase of more than 100% in the sun leaves in SF. Fifty d after the final
rainfall, VPDleaf-to-air was higher in SF than in AGP for both sun
and shaded leaves, with a 1.6 kPa increase in the sun leaves and 0.84 kPa in the shaded leaves (Table 1).
Gas exchange and water use efficiency in shade leaves: In the wet season, shaded leaves of C. oncocalyx presented higher A rates in AGP (on average
4.8 µmol m-2 s-1) than in SF (on average 3.2 µmol m-2 s-1).
Starting in August, this trend was reversed, and 50 d
after the final rainfall, the leaves in SF exhibited higher A
rates than in AGP (on average 1.23 and 0.80 µmol m-2 s-1,
respectively, Figure 5A). Conversely, in the dry season, gs
was higher on average in AGP (0.05 and 0.03 mol m-2 s-1 at
30 and 50 d, respectively) than in SF (0.03 and 0.02 mol
m-2 s-1 at 30 and 50 d, respectively). The same occurred with
E, which was greater in AGP (2.5 and 2.0 mmol m-2 s-1 at
30 and 50 days, respectively) than in SF (1.7 mmol m-2 s-1
at 30 and 50 d). This led to lower WUE in plants of this system 30 and 50 d after the final rainfall (Figure 5B–D).
Gas exchange and water use efficiency in sun leaves:
Gas exchange was more intense during the wet season and in the morning, decreasing from midday on. Net photosynthesis was similar between systems in the wet season at all times, with
averages ranging from 6 (in the afternoon) to 10 µmol m-2 s-1
(in the morning and at midday). However, starting 30 d after
the final rainfall, CO2 assimilation was higher in plants in AGP
for the entire day, the difference being highest 50 d after the final rainfall (Figure 6A).
Figure 4. Water content in sun leaves of Cordia oncocalyx in an agrosilvopastoral system (AGP) and a secondary forest (SF) (n=5). *indicates statistically significant differences between land-use systems, by Student’s t-test (p<0.05).
50
40
30
10
AGP
60
20
Feb
W
ater
con
tent
(%)
0
SF
Mar Apr May
Month *
70 80
Jun Jul Aug Sep
*
Table 1. Leaf temperature (Tleaf), photosynthetically active radiation (PAR), and leaf-to-air vapor pressure deficit (VPDleaf-to-air) of sun and shaded leaves of Cordia oncocalyx measured between noon and 1:00 pm in an agrosilvopastoral system (AGP) and a secondary forest (SF), in the wet season, 30 and 50 days after final rainfall
Season Tleaf (°C) PAR (µmol m
-2 s-1) VPD(leaf-to-air) (kPa)
AGP SF AGP SF AGP SF
Sun leaves
Wet season 34.17 35.01 1,795.83 1,373.37 2.71 2.73
30 days 37.26 39.45 2,064.87 1,508.89 4.40 3.56
50 days 37.87 41.39 1,901.47 1,628.24 4.69 6.29
Shaded leaves
Wet season 32.74 32.28 62.09 38.52 2.61 2.46
30 days 38.59 39.34 69.92 189.02 5.14 5.64
50 days 39.90 41.83 109.91 863.65 5.86 6.70
Wet season data represents averages of the values obtained between February and July (n=54); 30 day data represents averages of the values obtained in August, 30
Stomatal conductance and E differed between systems in
the wet season, and were higher for leaves in SF, with gs being
higher starting from midday, and E starting from 9:00 am.
However, in the dry season these parameters were greater
in AGP for all of the observed times (Figure 6B–C). The gs
decreased in the afternoon 30 and 50 days after the final rainfall (Figure 6B). It reached its lowest values at 3-4:00 pm, namely
0.09 and 0.05 mol m-2 s-1 in AGP and SF, respectively, at 30 d,
and 0.05 and 0.04 mol m-2 s-1 in AGP and SF, respectively, at 50 d.
However, despite the reduction in gs at 3-4:00 pm, in the leaves
in AGP 50 d after the final rainfall E remained high with values
similar to those recorded 30 d after the final rainfall (3.05 and
3.27 mmol m-2 s-1, respectively). There was a slight E reduction
in trees in SF at 3–4:00 pm between 30 and 50 d after the final
rainfall (2.31 and 1.66 mmol m-2 s-1, respectively) (Figure 6C).
Water use efficiency in the wet season decreased from 9:00 am on (Figure 6D). Consequently, systems started to differ
from one another, and plants in AGP exhibited higher WUE between noon and 1:00 pm and 3–4:00 pm. Thirty days after the final rainfall, WUE was more similar between systems, but it was still higher in AGP from 7–8:00 am to noon–1:00 pm when
it reached averages of 2.07 and 1.28 µmol mmol-1. The greatest
difference occurred 50 d after the final rainfall, when the highest averages for all times were recorded in trees in AGP (between
2.55 µmol mmol-1 at 7–8:00 am and 0.87 µmol mmol-1 3–4:00 pm).
During the wet period, the leaf-to-air VPD differed
only at 3:00 pm (Figure 7A). Unlike gs and A, the daily
trend in VPDleaf-to-air showed a progressive increase in the
dry season after the early hours of the day in both systems.
At midday and at 3-4:00 pm, the greatest values of VPDleaf-to-air
were recorded for all periods. Thirty days after the final rainfall, VPDleaf-to-air was different between AGP and SF for all observed times, however, it was higher in AGP (5.84 kPa) than in SF (5.28 kPa) at 3–4:00 pm (Figure 7B). Fifty days after the
Figure 5. Net photosynthesis (A), transpiration (B), stomatal conductance (C), and water use efficiency (D) in shaded leaves of Cordia
oncocalyx in an agrosilvopastoral system (AGP) and a secondary forest (SF). Wet season data represent averages of the values obtained
between February and July (n=54); 30 days data represents averages of the values obtained in August, 30 days after the final rainfall and into the dry season (n=9); 50 days data represents averages of the values obtained in September, 50 days after the final rainfall and into the dry season (n=9). Different lowercase letters indicate significant differences (p<0.05) between seasons within the same land-use system, and different uppercase letters indicate significant differences (p<0.05) between land-use systems (Tukey’s test).
2.5 2.0 1.5
0.5
A
3.0
1.0
Wet season
Photosyn
thesis
(
μmol m
-2 s -1)
0.0
30 days 50 days
aA
4.5 4.0
3.5 5.0 5.5
aB
bA bA
bA bB
0.20
0.15
0.05
B
0.10
Wet season
Stomatal
conductance
(
mol
m
-2 s -1)
0.00
30 days 50 days
aA aA
bA
bB bA cB
2.5
2.0
1.5
0.5
C
3.0
1.0
Wet season
T
ranspiration
(
mmol
m
-2 s -1)
0.0
30 days 50 days
aA 4.5
4.0
3.5
aA
bA
bB
bA bB
1.0
0.8
0.6
0.2
D
1.2
0.4
Wet season
W
ater use efficiency
(
μmol mmol
-1)
0.0
30 days 50 days
aA 1.4
aB
bB aA
bB aA
Figure 6. Net photosynthesis (A), stomatal conductance (B), transpiration (C) and water use efficiency (D) in sun leaves of Cordia oncocalyx, in an agrosilvopastoral system (AGP) and a secondary forest (SF). AGPw and SFw = wet season, averages of the values obtained between February and July (n = 54); AGP30 and SF30 = averages of the values obtained in August, 30 days after the final rainfall and into the dry season (n=9); AGP50 and SF50 = averages of the values obtained in September, 50 days after the final rainfall and into the dry season (n = 9). Symbols indicate significant differences (p<0.05) between systems: * between AGPw and SFw; º between AGP30 and SF30; # between AGP50 and SF50, by Tukey’s test.
final rainfall, VPDleaf-to-air was generally higher in trees of SF.
Furthermore, at 3-4:00 pm, VPDleaf-to-air was the same (5.7 kPa)
in trees of both AGP and SF (Figure 7C).
Chlorophyll: The SPAD index of the shaded leaves was higher in AGP for all measurements (Figure 8A). In SF, the SPAD index was different for the wet season and 50 d after the final rainfall (34.9 and 29.5, respectively), with a reduction during this period also observed in AGP, showing averages of 50.6 and 48.4, respectively. The SPAD index in sun leaves differed between systems in the wet season and 50 d after the final rainfall, with the highest values occurring in AGP (44.9 and 40.4, respectively) (Figure 8B). The SPAD index of the sun leaves in AGP did not change in the wet and dry seasons, while
in SF they were reduced for the period between 30 and 50 d after the final rainfall.
Dry biomass of Cordia oncocalyx: We recorded the highest production of total fresh biomass in the leaves and fruits in AGP, with almost three times more fresh biomass per tree in AGP than in SF. The percentage of dry biomass in the fruits and shaded leaves was also higher under this system, reaching almost 80% for fruits and 40% for leaves. The total average dry biomass (when combining
fruits and leaves) per plant was 4.0 kg tree-1 in SF and
20 kg tree-1 in AGP (Table 2). In both AGP and SF, shaded
leaves contributed a little to the total dry biomass per tree (13.2 and 14.8%, respectively). Fruits of trees in AGP
# 10
9 8
1
A
11 12
7–8 am 0
9–10 am noon–1 pm 3–4 pm
#
Photosynthesis
(
μmol m
-2 s -1)
5 4 3 6 7
2
#
#
#
Stomatal
conductance
(
mol
m
-2 s -1) 0.25
0.20
B
0.30
7–8 am 0.00
9–10 am noon–1 pm 3–4 pm
#
0.10 0.15
0.05
#
# *
*
#
7–8 am 9–10 am noon–1 pm 3–4 pm
7
6
5
2
C
8
3
0
Daytime (h)
T
ranspiration
(
mmol
m
-2 s -1)
#
#
#
1 4
* *
*
#
W
ater use efficiency
(
μmol mmol
-1)
7–8 am 9–10 am noon–1 pm 3–4 pm 3.0
2.5
1.0
D
3.5
1.5
0.0
Daytime (h) #
#
#
0.5
2.0 * * *
AGPw SFw
AGP30 SF30
contributed approximately 35% for the total dry biomass, whereas in SF this percentage was only 7.6%, showing that fruit production is much higher in AGP.
DISCUSSION
In the wet season, net photosynthesis was 32% higher in shaded leaves in AGP than in SF (Figure 5A), even though
PAR, Tleaf and VPDleaf-to-air (Table 1), as well as gs, were
similar in both systems. Thirty days after the final rainfall, the beginning of leaf shedding enabled a more intense contact betweem solar radiation and shaded leaves in SF,
increasing A in this system even though Tleaf and VPD
leaf-to-air remained similar in both systems. Fifty days after the
final rainfall, lower VPDleaf-to-air in shaded leaves in AGP led
to greater stomatal opening, however, this did not translate
into greater A. On the contrary, Egea et al. (2011) stated
that A increases with gs, both of which are affected by the
radiation intensity (Turner and Thomas 1998). Indeed, they both decrease with the reduced incidence of PAR (Rodrigues et al. 2011). Hence, although leaf humidity allowed stomatal opening, the reduced incidence of solar
Figure 7. Leaf-to-air vapor pressure deficit in sun leaves of
Cordia oncocalyx, in an agrosilvopastoral system (AGP) and a secondary forest (SF). (A) Wet season, average of values recorded between February and July (n=54); (B) Values recorded in August, 30 days after the final rainfall, during the dry season (n=9); (C) Values recorded in September, 50 days after the final rainfall, during the dry season (n=9). *indicates significant differences between land-use systems as determined by Student’s t-test (p<0.05).
6 5 4 2 A 7 3 7–8 am V apor p ressu r e deficit ( KP a) 1
9–10 am noon–1 pm 3–4 pm
* 8 6 5 4 2 B 7 3 7–8 am V apor p ressu r e deficit ( KP a) 1
9–10 am noon–1 pm 3–4 pm
* 8 * * * Daytime (h) 6 5 4 2 C 7 3 7–8 am V apor p ressu r e deficit ( KP a) 1
9–10 am noon–1 pm 3–4 pm
* 8
*
*
Figure 8. SPAD index in shaded (A) and sun (B) leaves of
Cordia oncocalyx in an agrosilvopastoral system (AGP) and a secondary forest (SF). For the descriptions of evaluation times see the caption of Figure 5. Different lowercase letters indicate significant differences (p<0.05) between land-use systems, and different uppercase letters indicate significant differences (p<0.05) between seasons in the same land-use system, as determined by Tukey’s test.
25 20 15 5 A 30 10 Wet season SP AD inde x 0
30 days 50 days
aA 45 40 35 50 55 bA aAB bA aB bB 25 20 15 5 B 30 10 Wet season SP AD inde x 0
30 days 50 days
aA 45 40 35 50 55 bAB
aA aA aA
bB
AGP SF
Table 2. Total fresh biomass per tree (TFM), percentage of dry biomass in subsamples (PDM), and total dry biomass per sample tree (TDM) of Cordia oncocalyx in a secondary forest (SF) and in an agrosilvopastoral system (AGP), in July
TFM (kg tree-1) PDM (%) TDM (kg tree-1)
SF AGP SF AGP SF AGP
Sun leaves 8.63 23.07** 42.16 45.77* 3.63 10.55**
Shaded leaves 1.60 7.00** 32.32 39.43** 0.53 2.72**
Fruits 0.54 9.33** 63.87 79.28** 0.34 7.33**
Total 10.77 39.40** – – 4.50 20.60**
TFM and TDM n=3; PDM n=9. The symbols indicate significant differences between land-use systems by Student’s t-test: * (p<0.05), ** (p<0.01).
radiation affected the photochemical phase and reduced A
in shaded leaves of AGP.
Lower rates of A, E and gs were observed in shaded leaves
in relation to sun leaves, as a result of the low levels of solar radiation received by the former (Figures 5A–C and 6A–C, Table 1). Under clear skies, approximately four times less radiant flux density reaches the shaded leaves (Grant 1985). In addition, the high density of trees reduces the amount of PAR reaching shaded leaves, and has a direct influence on leaf gas exchange (Jensen et al. 2011). However, shaded leaves play the important role to compensate, by taking advantage of the weak radiation
that reaches them, thus being able to ensure CO2 fixation in
situations that would promote stomatal closure in sun leaves. Net photosynthesis in sun leaves was similar in both systems in the wet season (Figure 6A). In that season, soil water content was not a limiting factor for the development of the
plants, so A was high. After the period of high water availability,
the soil began to dry, and both the temperature and air vapor pressure deficit increased, creating conditions that are adverse to gas exchange (D’Ambrosio et al. 2006, Mahouachi 2009). Soil water can be retained longer in forests than in agroforests, due to the higher density of plants, lower surface runoff and reduced water loss by evaporation, since less solar radiation can reach the ground (Eastham et al. 1988, McDonald et al. 2002, Silva et al. 2011, Raz-Yaseef et al. 2012). It is therefore possible that in SF the higher density of trees and reduced transpiration rates during the dry season were the main responsible factors for the greater soil water content in this system 50 days after the final rainfall, compared to AGP.
In the dry season, gs, A, E and leaf water content were
higher in the sun leaves in AGP, while water content in the soil was lower. Fifty days after the final rainfall, when soil water in AGP was lower than in SF (Figure 3), the higher leaf water
content (Figure 4) allowed higher E in the sun leaves in AGP
(Figure 6C). High VPDleaf-to-air in the sun leaves in SF partly
explains the stomatal closure that occurred 50 days after the final rainfall, but not 30 d, when leaves in AGP and SF had
similar VPDleaf-to-air. Santos et al. (2013) observed greater A
in Jatropha curcas in a semi-humid forest than in a semiarid
Caatinga area during the dry season, which they attributed to
higher soil water content and lower VPDleaf-to-air. With increased
VPDleaf-to-air, E increases,promoting a reduction in leaf water potential and leading to stomatal closure (Streck, 2003).
Gas exchange in C. oncocalyx was higher in the wet season
for both areas, and lower at the start of the dry season for both shaded and sun leaves. This indicates that gas exchange was influenced by the seasons due to the drop in soil moisture at the beginning of the dry period. Similarly, Romero and Botía
(2006) observed that Prunus dulcis showed A ranging from
8 to 14 µmol m-2 s-1 between 9:00 am and 5:00 pm during
the wet season, whereas in the period of severe water stress,
A was high (8 to 10 µmol m-2 s-1) only between 1:00 pm and
3:00 pm. In addition, gs and A are influenced by water stress,
while the relative water content in the leaf decreases (Gindaba
et al. 2005). However, A does not always depend on soil
water content or on VPDleaf-to-air (Streck 2003). This indicates
that the different photosynthetic rates recorded in AGP and SF were also influenced by factors related to the plant itself. The techniques used in AGP alter the development patterns of the trees, given the lower density of plants in this system.
Such low density can change rates of A, E and WUE between
individuals of the same species (Forrester et al. 2012). In addition to the influence of weather conditions, which include greater VPD and air temperature and lower soil moisture, all observed especially in the dry season, gas exchange is also affected by leaf maturity. Physiological processes in deciduous
plants such as C. oncocalyx slow down at the start of the
dry season, when leaf abscission begins. Thirty days after
the final rainfall, at the start of the dry season, C. oncocalyx trees
were shedding leaves differently in the two land-use systems. Uemura et al. (2005) and Muthuri et al. (2009) observed
higher A, E, and WUE in young, mature leaves and a decrease
in these variables with leaf senescence.
Nutrient content in the soil may also be responsible for the differences in physiology and yield. Plants growing in naturally
or artificially fertile soils have a higher chlorophyll content, A and
concentrations, their photosynthetic capacity and total biomass are reduced (Boussadia et al. 2010). Mendes (2013) reported higher levels of N, P and K in AGP than in SF, which shows that this improvement in soil fertility may be linked to the increased nutrient content in leaves and increased physiological processes of plants growing on that land-use system.
Leaves in SF exhibited a lower SPAD index (Figure 8), were more yellow in color than in AGP, and were more prone to falling from the tree. This is also relevant in terms of physiology, since chlorophyll is the pigment responsible for light absorption. Guerfel et al. (2009) observed that shaded plants exhibited higher chlorophyll content, which was attributed to the strategy developed by the plants to increase the amount of pigment necessary to absorb radiation. Even though the higher SPAD index in shaded leaves in AGP were associated with a lower incident PAR 30 and 50 days after the final rainfall, the effects on the chlorophyll obtained here cannot be explained directly by incident radiation, since PAR in sun leaves was higher in AGP, and also exhibited a higher SPAD index.
Despite the more beneficial physical environment promoted by SF, including greater soil moisture retention and reduced water loss by evaporation, the higher plant density in SF can lead to greater competition for water and nutrients, with negative consequences for leaf gas exchange and tree growth (Kilpeläinen et al. 2010). High intercession among the roots of neighboring trees, and the shade provided by a dense canopy, result in plants investing more energy in competition than in growth, as demonstrated by Gerhardt (1996). This suggests that given the lower tree density
in AGP, C. oncocalyx plants may transfer more energy to increase
their basal area and produce leaf and fruit biomass. Studies by Campanha et al. (2011) confirmed that many tree individuals in this agrosilvopastoral system were classified in groups of diameter
larger than 0.18 m. This was not the case in SF, where most individuals were in the 0–0.06 m diameter class.
We found that greater leaf dry biomass was associated with lower tree density in AGP. Subedi et al. (2012) demonstrated that the above-ground biomass decreases considerably when the density of trees increases from 700 to 4,000 individuals per hectare, with trees planted at lower density showing greater percentage of biomass as leaves. Hummel (2000) studied a
different species of the genus Cordia [C. alliodora (Ruiz and
Pav.) Oken] and observed that greater tree density resulted
in stems with smaller diameters, as with C. oncocalyx in SF.
This may be associated with greater competition, and the need for investment in plant height to improve light capture by the canopy (Strand et al. 2006).
Our findings suggest that C. oncocalyx plants in AGP
may be more resistant to drought compared to the plants in SF. Indeed, they maintain greener leaves with higher relative content of chlorophyll. Trees also maintained higher
rates of E, gs, and A throughout the day in sun leaves, with
higher WUE and leaf water content, 50 d after the final rainfall in the dry season, when the gravimetric soil water content was low. This may be explained by the impact of agroforestry management techniques, including low tree density and differences in nutrient availability and in other soil properties.
ACKNOWLEDGEMENTS
The authors would like to thank Embrapa Goats and Sheep for allowing the field work for this study. We are also grateful to the Coordination for Enhancement of Higher Eduation Personnel (CAPES) and the National Council for Scientific and Technological Development (CNPq) for their financial support.
Aguiar MI, Maia SMF, Oliveira TS, Mendonça ES, Araújo-Filho JA (2006) Perdas de solo, água e nutrientes em sistemas agroflorestais no município de Sobral, CE. Revista Ciência Agronômica 37:270-278.
Aguiar MI, Maia SMF, Xavier FAS, Mendonça ES, Araújo-Filho JA, Oliveira TS (2010) Sediment, nutrient and water losses by water erosion under agroforestry systems in the semi-arid region in northeastern Brazil. Agroforestry Systems 79:277-289.
Alfaia SS, Ribeiro GA, Nobre AD, Luizão RC, Luizão FJ (2004) Evaluation of soil fertility in smallholder agroforestry systems and pastures in western Amazonia. Agriculture, Ecosystems & Environment 102:409-414.
Ayres M, Ayres-Júnior M, Ayres DL, Santos AA (2007) Bioestat – Aplicações estatísticas nas áreas das ciências biomédicas. Ong Mamirauá, Belém, PA.
Boussadia O, Steppe K, Zgallai El Hadj SB, Braham M, Lemeur R, Van Labeke MC (2010) Effects of nitrogen deficiency on leaf photosynthesis, carbohydrate status and biomass production in two olive cultivars ‘Meski’ and ‘Koroneiki’. Scientia Horticulturae 123:336-342.
Campanha MM, Aguiar MI, Maia SM, Oliveira TS, Mendonça ES, Araújo-Filho JA (2008) Perdas de solo, água e nutrientes pela erosão hídrica em diferentes sistemas de manejo agroflorestal no semiárido cearense. Embrapa, Sobral, CE, Brasil. Circular Técnica, 37.
Campanha MM, Nogueira RS, Oliveira TS, Teixeira AS, Romero RE (2009) Teores e estoque de carbono no solo de sistemas agroflorestais e tradicionais no semiárido brasileiro. Embrapa, Sobral. Circular Técnica, 42.
Campanha MM, Araújo FS, Menezes MO, Silva VM, Medeiros HR (2011) Structure of plantcommunity of shrubs and trees in agrosilvopasture system, in Sobral – CE. Revista Caatinga 24:94-101.
Carvalho PER (2008) Pau-branco-do-sertão (Auxemma oncocalyx). Embrapa Florestas, Colombo-PR. Circular Técnica, 153.
D’Ambrosio N, Arena C, Santo AV (2006) Temperature response of photosynthesis, excitation energy dissipation and alternative electron sinks to carbon assimilation in Beta vulgaris L. Environmental and Experimental Botany 55:248-257.
Eastham J, Rose CW, Cameron DM, Rance SJ, Talsma T (1988) The effect of tree spacing on evaporation from an agroforestry experiment. Agricultural and Forest Meteorology 42:355-368.
Egea G, Verhoef A, Vidale PL (2011) Towards an improved and more flexible representation of water stress in coupled photosynthesis – stomatal conductance models. Agricultural and Forest Meteorology 151:1370-1384.
Empresa Brasileira de Pesquisa Agropecuária – EMBRAPA (1997) Manual de métodos de análise de solo, segunda ed. Ministério da Agricultura, Rio de Janeiro, Brasil.
Forrester DI, Collopy JJ, Beadle CL, Warren CR, Baker TG (2012) Effect of thinning, pruning and nitrogen fertiliser application on transpiration, photosynthesis and water-use efficiency in a young
Eucalyptus nitens plantation. Forest Ecology and Management
266:286-300.
Gerhardt K (1996) Effects of root competition and canopy openness on survival and growth of tree seedlings in a tropical seasonal dry forest. Forest Ecology and Management 82:33-48. Gindaba J, Rozanov A, Negash L (2005) Photosynthetic gas exchange, growth and biomass allocation of two Eucalyptus and three indigenous tree species of Ethiopia under moisture deficit. Forest Ecology and Management 205:127-138.
Grant RH (1985) The influence of the sky radiance distribution on the flux density in the shadow of a tree crown. Agricultural and Forest Meteorology 35:59-70.
Groot A, Saucier JP (2008) Volume increment efficiency of
Picea mariana in northern Ontario, Canada. Forest Ecology and
Management 255:1647-1653.
Guerfel M, Obaccouri O, Boujnah D, Chai Bi W, Zarrouk M (2009) Impacts of water stress on gas exchange, water relations, chlorophyll content and leaf structure in the two main Tunisian olive (Olea europaea L.) cultivars. Scientia Horticulturae 19:257-263.
Hummel S (2000) Height, diameter and crown dimensions of
Cordia alliodora associated with tree density. Forest Ecology and
Management 127:31-40.
Instituto Brasileiro de Geografia e Estatística – IBGE (2006) Censo Agropecuário. IBGE, Rio de Janeiro, Brasil.
Jensen AM, Löf M, Gardiner ES (2011) Effects of above- and below-ground competition from shrubs on photosynthesis, transpiration and growth in Quercus robur L. seedlings. Environmental and Experimental Botany 71:367-375.
Kilpeläinen A, Routa J, Peltola P, Gerendiain AZ, Pulkkinen P, Kellomäki S (2010) Effects of genetic entry and competition on above ground biomass production of Norway spruce grown in southern Finland. Forest Ecology and Management 259:2327-2332.
Lott JE, Howard SB, Ong CK, Black CR (2000) Long-term productivity of a Grevillea robusta-based overstorey agroforestry system in semi-arid Kenya: I. Tree growth. Forest Ecology and Management 139:175-186.
Maia SMF, Xavier FAS, Oliveira TS, Mendonça ES, Araújo-Filho JA (2008) Frações de nitrogênio em Luvissolo sob sistemas agroflorestais e convencional no semi-árido cearense. Revista Brasileira de Ciência do Solo 32:381-392.
Mahouachi J (2009) Changes in nutrient concentrations and leaf gas exchange parameters in banana plantlets under gradual soil moisture depletion. Scientia Horticulturae 120:460-466.
McDonald MA, Healey JR, Stevens PA (2002) The effects of secondary forest clearance and subsequent land-use on erosion losses and soil properties in the Blue Mountains of Jamaica. Agriculture, Ecosystems & Environment 92:1-19.
Mendes MMS (2013) Ecofisiologia de plantas nativas e cultivadas e parâmetros físicos e químicos do ambiente em sistemas agroflorestais no semiárido cearense. Fortaleza, Universidade Federal do Ceará. PhD thesis.
Menezes RSC, Salcedo IH, Elliott ET (2002) Microclimate and nutrient dynamics in a silvopastoral system of semiarid northeastern Brazil. Agroforestry Systems 56:27-38.
Microcal Software INC. (1997) Data analysis and technical graphics software. Origin Professional version 6.0. Northampton, MA. Minotta G, Pinzauti S (1996) Effects of light and soil fertility on growth, leaf chlorophyll content and nutrient use efficiency of beech (Fagus sylvatica L.) seedlings. Forest Ecology and Management 86:61-71.
Moço MKS, Gama-Rodrigues EF, Gama-Rodrigues AC, Machado RCR, Baligar VC (2010) Relationships between invertebrate communities, litter quality and soil attributes under different cacao agroforestry systems in the south of Bahia, Brazil. Applied Soil Ecology 46:347-354.
Muthuri CW, Ong CK, Craigon J, Mati BM, Ngumi VW, Black CR (2009) Gas exchange and water use efficiency of trees and maize in agroforestry systems in semi-arid Kenya. Agriculture, Ecosystems & Environment 129:497-507.
Raz-Yaseef N, Yakir D, Schiller G, Cohen S (2012) Dynamics of evapotranspiration partitioning in a semi-arid forest as affected by temporal rainfall patterns. Agricultural and Forest Meteorology 157:77-85.
Rodrigues BM, Arcoverde GB, Antonino AC, Santos MG (2011) Water relations in physic nut according to climatic seasonality, in semiarid regions. Pesquisa Agropecuária Brasileira 46:1112-1115.
Romero P, Botía P (2006) Daily and seasonal patterns of leaf water relations and gas exchange of regulated deficit-irrigated almond trees under semiarid conditions. Environmental and Experimental Botany 56:158-173.
Santos CM, Veríssimo V, Wanderley-Filho HCL, Ferreira VM, Cavalcante PGS, Rolim EV, Endres L (2013) Seasonal variations of photosynthesis, gas exchange, quantum efficiency of photosystem II and biochemical responses of Jatropha curcas
Silva GL, Lima HV, Campanha MM, Gilkes RJ, Oliveira TS (2011) Soil physical quality of Luvisols under agroforestry, natural vegetation and conventional crop management systems in the Brazilian semi-arid region. Geoderma 167–168:61-70.
Singh G, Mutha S, Bala N (2007) Effect of tree density on productivity of a Prosopis cineraria agroforestry system in North Western India. Journal of Arid Environments 70:152-163. Souza HN, Goede RGM, Brussaard L, Cardoso IM, Duarte EMG, Fernandes RBA, Gomes LC, Pulleman MM (2012) Protective shade, tree diversity and soil properties in coffee agroforestry systems in the Atlantic Rainforest biome. Agriculture, Ecosystems & Environment 146:179-196.
Strand M, Löfvenius MO, Bergsten U, Lundmark T, Rosvall O (2006) Height growth of planted conifer seedlings in relation to solar radiation and position in Scots pine shelterwood. Forest Ecology and Management 224:258-265.
Streck N (2003) Stomatal response to water vapor pressure deficit: an unsolved question. Revista Brasileira de Agrociência 9:317-322.
Subedi S, Kane M, Zhao D, Borders B, Greene D (2012) Cultural intensity and planting density effects on aboveground biomass of 12-year-old loblolly pine trees in the Upper Coastal Plain and Piedmont of the southeastern United States. Forest Ecology and Management 267:157-162.
Turner DW, Thomas DS (1998) Measurements of plant and soil water status and their association with leaf gas exchange in banana (Musa
spp.): a laticiferous plant. Scientia Horticulturae 77:177-193. Uemura A, Ishida A, Matsumoto Y (2005) Simulated seasonal changes of CO2 and H2O exchange at the top canopies of two
Fagus trees in a winter-deciduous forest, Japan. Forest Ecology
and Management 212:230-242.