BOWEN RATIO-ENERGY BALANCE ASSOCIATED ERRORS IN
VINEYARDS UNDER DRIPPING IRRIGATION
JOSÉ MONTEIRO SOARES
1, PEDRO VIEIRA DE AZEVEDO
2& BERNARDO BARBOSA DA SILVA
3 1Empresa Brasileira de Pesquisa Agropecuária (Embrapa), Embrapa Semi-Arido.
BR 428, km 152, Zona Rural, Petrolina, PE, CEP: 56.300-970
E-mail: [email protected]
2, 3
Universidade Federal de Campina Grande (UFCG), Centro de Ciência e Tecnologia (CCT),
Depto. de Ciências Atmosféricas (DCA).
Av. Aprígio Veloso, 882, Campus I, Bodocongó, Campina Grande, PB, CEP: 58.109-970.
E-mails:
2[email protected];
3[email protected]
Received November 2005 - February May 2007
ABSTRACT
This study was conducted at the Bebedouro Experimental Station in Petrolina-PE, Brazil, to evaluate the errors associated to the application of the Bowen ratio-energy balance in a 3-years old vineyard (Vitis vinifera, L), grown in a trellis system, irrigated by dripping. The fi eld measurements were taken during fruiting cycle (July to November, 2001), which was divided into eigth phenological stages. A micrometeorological tower was mounted in a grape-plants row in which sensors of net radiation, global solar radiation and wind speed were installed at about 1.0 m above the canopy. Also in the tower, two psicometers were installed at two levels (0.5 and 1.8 m) above the vineyard canopy. Two soil heat fl ux plates were buried at 0.02 m beneath the soil surface. All these sensors were connected to a Data logger 21 X of Campbell Scientifi c Inc., programmed for collecting data once every 5 seconds and storage averages for every 15 minutes. A comparative analysis were made among four Bowen ratio accepting/rejecting rules, according to the methodology proposed by Spano et al. (2000): βr1 – values of β calculated by Bowen (1926) equation; βr2 – values of β as proposed by Verma et al. (1978) equation; βr3 – exclusion of the β values obtained as recommended by Unland et al. (1996) and βr4 – exclusion of the β values calculated as proposed by Bowen (1926), out of the interval (-0.7 < β < (-0.7). Constacted that the Unland et al. (1996) and Soares (2003) accepting/rejection rules were better than that of Verma et al. (1978) for attenuating the advective effects on the calculations of the Bowen ratio. The comparison of βr1 with βr2 rules showed that the statistical errors reaching maximum values of 0.015. When comparing βr1 with βr3 e βr4, the β errors reaching maximum values of 5.80 and 3.15, respectively.
Keywords: latent and sensible heat fl uxes, evapotranspiration, semi-arid region.
RESUMO: ERROS ASSOCIADOS PELA RAZÃO DE BOWEN AO BALANÇO DE ENERGIA EM PARREIRAIS SOB IRRIGAÇÃO POR GOTEJAMENTO.
1. INTRODUCTION
Fine table-grape (Vitis vinifera, L.) crop in the San
Francisco River Valley has reached economical relevance in the seventy’s decade, when the use of advanced technology allowed obtaining and offering competitive and higher fruit quality to different consumer markets. In terms of growing area, the viticulture in that region has expanded considerably in the last decade, going from 1,759 ha in 1990 (Agrianual, 1997) to 9.850 ha in 2003 (Valexport, 2005). Nowadays, the table-grape outstands as one of the main fruit explored in the region, been the fi fth in growing area and the second in the list of Brazilian exportation, reaching around 36,848 t in 2003, which means approximately US$ 92 millions and 98% of the Brazilian exportation of table fi ne grapes. These numbers demonstrate the importance of this agribusiness for income generation for the country, fortifying the regional economy and creating new jobs, being grapes considered one of the crops which today shows the best relation of generated jobs per growing area (around 5 workers per hectare). Throughout the last decade, increasing changes have been observed in the grapes production scenery at the Submedio São Francisco River Valley, northeast Brazil. The trade business, before exclusively addressed to the internal market, was encouraged to look toward new markets for absolving a higher offer of grapes produced in that region. The exportations were fundamental for the improvement of fruit quality required by the international market high standards. In terms of global market and in comparison to other table-grapes exporting countries, the region had the disadvantage of concentrating its production in the seed cultivars while there was an increasing choice of the international market for seedless grapes. Also, the price of the “Italia” seed table-grape in the European market decreased throughout the last decade, reaching US$ 3.00 per 4.5 kg box in the 2001 harvest, while the mean price of the Superior Seedless variety was around US$ 14.00 per box.
In the last six years, the middle region of the San Francisco River Valley, northeast Brazil, has been expanding its production of seedless table-grape, mainly with the variety
known as Superior Seedless. This variety is characterized by its precociousness (90-100 days from pruning to harvest) and by its excellent market acceptance characteristics such as bunch and grape size, low sourness and high sugar grade, but with low and irregular fi eld yield. Despite the use of high water application effi ciency site-irrigation systems by the local growers, the use of crop coeffi cients for seed-grapes adjusted to local climatic conditions has been considered as the causes of the continuous reduction in grape crop productivity.
The Bowen ratio-energy balance (BREB) is a simple, practical and indirect method for estimating latent heat fl ux (LE) under known boundary conditions. Some authors have used this method for the determination of water requirements by fruit plantations (Fuchs & Tanner, 1970; Ohmura, 1982; Heilman et al., 1989; Oliver & Sene, 1992; Spano et al., 2000; Lopes et al., 2001; Azevedo et al., 2003). In semi-arid regions, where crops are usually submitted to a large range of water stress levels, the vertical temperature gradient (∆T) may be very large while the vapor pressure gradient (∆e) appears to be very small. This means that it’s very important to obtain highly precise measures of vapor pressure (Angus & Watts, 1984). One of the most simple way of getting these precise air vapor pressure measurements is by using differential psychrometers, which require a frequent maintenance of the dry and wet bulb thermometers as well as the continuous data recording (Fritschen & Gay, 1979). Nevertheless, one can use well-calibrated thermocouples, which may detect temperature differences from 0.05 to 0.2 °C and may increase measurements precision by interchanging psychrometers position in the micrometeorological tower (Fritschen & Simpson, 1989).
Ohmura (1982) showed that changes in wind speed and direction, air and dew point temperatures were, in general, very small for Bowen ratio (β) ≅ -1, indicating consistent rates of latent (LE) and sensible (H) heat fl uxes. So that, for those time-periods with β[cal]≅ -1, Malek et al. (1990) calculated LE
as the average between the values obtained before and after the considered time period. When analyzing the evolution of the Bowen ratio with the corn crop height, Cellier & Brunet β calculados pela equação de Bowen (1926); βr2 – correção dos valores de βr1 com base na equação
proposta por Verma et al. (1978); βr3 - correção dos valores de βr1 de acordo com Uhland et al. (1996);
βr4 – exclusão dos valores de βr1, que se encontrasse fora do intervalo (-0,7 < β < 0,7), recomendado
por Soares (2003). Constata-se que as metodologias propostas por Unland et al. (1996) e por Soares (2003) apresentaram melhores correções dos valores da razão de Bowen, concernentes a ocorrência de efeitos advectivos. Quando se compararam os valores de βr1 com βr2 constatou-se que o erro estatístico máximo era de apenas 0,015. No entanto, quando comparam os valores de βr1 com os de βr3 e βr4, verifi cou-se os erros máximos foram de 5,80 e 3,15, respectivamente.
(1992) observed that the BREB can not be applied for uniform tall crops due to the heterogeneity of the study area in relation to air temperature and humidity. However, they mentioned that important values dispersion observed in the lower layers can be a result of occasionally non-homogeneous fl uxes that take place just bellow crop canopy and go through the lowest air layers close to soil surface.
Oliver & Sene (1992) observed values of the Bowen ratio at the soil surface (6 ≤ β ≤ 8), much greater than those obtained at the top of a vineyard canopy, as a result of the lower evaporation rate at soil surface level. They also observed that β values changed signifi cantly during rainy days and after a rain, when then returns to values less then 2. Unland et al. (1996) observed that when the relation 1 + β < 0.3 occurrs, LE and H are approximately equal but of opposite sign, indicating that the BREB can not quantify the fl uxes coming from the surface. These situations usually occurr in the early morning and late afternoon hours when the available energy (Rn) is low and the time-rate of energy change is high (Konzelmann et al., 1997). Prueger et al. (1997) also observed limitations in the use of the Bowen ratio-energy balance in the time-periods around sunrise and sunset, caused by the occurrence of small gradients of temperature and vapor pressure defi cit, resulting in values of β close to -1 and ∝. Similar limitations also may occurr in crops with non-uniform soil cover and under advective conditions usually found in sem-arid agricultural regions.
Angus & Watts (1984) observed that the BERB offers good results for wet conditions while for very dry conditions or strong convection it becomes very imprecise. Also, it was observed that, for any value of the Bowen ratio, the net radiation (Rn) and soil heat fl ux (G) contribute to an about 4% error
in the estimation of the latent heat fl ux (LE). Heilman et al. (1989) mentioned that the major requirement of this method is the measurement of temperature and water vapor gradients within the internal boundary layer in equilibrium with the canopy surface cover. Verma et al. (1978) observed that high values of latent heat fl ux are related to low values of |∆T/∆e|, which may be associated to strong advection. For correcting the advective effects on LE and H, Verma et al. (1978) suggested an expression to be used when -0,1 > ∆Ts/∆e > - 0,8. However, it has been observed that calculations restrictions may occur for Bowen ratio (β) close to -1, even when the Verma et al. (1978) methodology is used, what results in unreal values for the latent heat fl ux.
Thus, some authors have proposed additional rules for accepting/rejecting β. Unland et al. (1996) have recommended the exclusion of two levels data when |∆e| < 0,0005 kPa and β ≈ -1, particularly for range between |1 + β| < 0,3. In such case, the values of LE and H must be obtained as the average of the values obtained before and after the considered time interval.
The objective of this study was to evaluate the errors associated to the application of the Bowen ratio-energy balance method for determining the sensible and latent heat fl uxes throughout the fruiting cycle of a seedless vineyard grown in the soil and climate conditions of the middle region of San Francisco River Valley at northeast Brazil.
2. DATAS AND METODOLOGY
2.1. Experimental site
This study was conducted at the Bebedouro Experimental Station of the Brazilian Organization for Agriculture and Animal Research (Embrapa Semi-Árido) in the semi-arid region of the middle reaches of San Francisco River Valley at Petrolina-PE, Brazil (latitude: 09° 09’ S; longitude: 40° 22’ W; altitude: 365.5 m). The region has climate and soil conditions as described by Azevedo et al. (2003).
The 70 m x 70 m experimental plot was placed at the center of a 3-year-old seedless vineyard (Vitis vinifera, L),
variety ‘Superior Seedless’, grown in a trellis system with plants spaced by 4.0 m between rows and by 2.0 m between plants and surrounded by others vineyard areas. The fi eld measurements were taken during fruiting cycle (July to November, 2001), which were divided into the following phenological stages: budding period (BP); vegetative growth (VG); full fl owering (FF); beginning fruit growth (BFG); pause on fruit growth (PFG); ending fruit growth (EFG); fruit maturation (FM); physiological rest (PR). The vineyard was daily irrigated by a dripping line system with emitters spaced by 0.50 m and water outlet of 2.3 L h-1.
2.2. Instrumentation used
The climatic characteristics of the region were obtained from a meteorological station next to the local of this study as follows: mean temperature of 26.5 °C; relative humidity of 67.8%; mean annual pluviometric precipitation of 400 mm; annual radiation of 3,000 hours; mean annual evaporation of 2,000 mm, and wind speed of 2.3 m/s.
2.3. Bowen ratio-energy balance
The latent heat fl ux (LE) was obtained by the energy balance equation, neglecting the effects of advection, changes in canopy heat storage and energy consumed by the canopy net photosynthesis process. Thus, assuming equality between the turbulent diffusion coeffi cients of sensible (Kh) and latent
(Kw) heat fl uxes and (∂T/∂z) / (∂ea/∂z) ≈ ∆T/∆ea, the Bowen
ratio was obtained as:
β = H/LE ≅γ (ΔT/Δea) (1)
So that, LE (W m-2) was calculated by:
LE= Rn−G
+
1 β (2)
where Rn (W m-2) is the net radiation, G (W m-2) the soil heat
fl ux, γ (kPa °C-1) the psychometric constant, ∆T = T
2 – T1 (°C)
and ∆ea = e2 – e1 (kPa) are air temperature and water vapor
pressure measurements at two levels above orchard canopy, respectively. Then, the sensible heat fl ux (H, in W m-2) was
computed as residuals from the energy balance equation, as follows:
H = Rn – G – LE (3)
All the energy balance components were obtained for the daytime period (i.e., Rn > 0). Moreover, the fl uxes were
considered as positive when downwards and negative when upwards of the canopy surface.
2.4. Rules of accepting/rejecting Bowen ratio values
The Bowen ratio (β) analysis was made by using accepting/rejecting rules, as follows: βr1 – values de β (Eq. 1),
without any advective effects correction; βr2 – values de β as
proposed by Verma et al. (1978), which includes terms for correction of advective effects originated from monsoons which predominate in the region where this study was carried out, aiming at correcting the values of the components of energy balance:
βr2 γ T e T e T e
2
2 95 3 72 1 72
= . + .
(
∆ /∆)
+ .(
∆ /∆)
(
∆ /∆)
;(4) βr3 – exclusion of β values obtained by Eq. 1, using
Unland et al. (1996) rule, when |∆ea|< 0.0005 kPa and
|1 + β| < 0.3, conditions which aim at the correction of advective effects and, consequently, the elimination of β values when they geet close to -1, since this study was carried out in a semi-arid region; βr4 – exclusion of the β values (Eq. 1) out
of the interval (-0,7 < β < 0,7), proposed by Soares (2003), as a practical rule for correction of advective effects in studies with energy balance carried in irrigated áreas under tropical semi-arid conditions.
2.5. Bowen ratio error analysis
The statistical error (εβ), based on Bowen (1926)
and Verma et al. (1978) methodologies, was obtained as (Spano et al., 2000):
εβ=
(
β −β)
=
∑
1
1 2
1
n r i
i n
or εβ=
(
β −β)
=
∑
1
2 2
1
n r i
i n
(5) where n is the number of observations and the subscript i = r1 (Bowen, 1926), r2 = (Verna et al., 1978), r3 = (Unland et al., 1996) e r4 = (Soares, 2003).
3. RESULTS AND DISCUSSION
Table 1 presents the behavior of hourly average values of accepting/rejecting rules βr1, βr2, βr3 and βr4 for all phenological
stages of a fruiting cycle. For soil cover factors Fsc < 0.7 (obtained
based on measurement of leaf area), occurred in the budding period (BP), β values were mainly negatives throughout the daytime period, except for some occurrences of positive values but very close to zero. It was also observed that the values for rules βr3 and βr4 showed less dispersion as compared to those
of βr1 and βr2. Also, the Verma et al. (1978) advective effects
correction (βr2) was not effi cient once the β values close to -1 did
not change with that correction. The values of βr3 and βr4 showed
to be very close to each other and almost constant in the morning period and slightly variable in the afternoon period.
For soil cover factors 0.7 < Fsc ≤ 0.97, occurred in the
vegetative growth stage (VG), β values were mainly positive throughout the daytime period. However, it was observed a few negative values, mainly for rules βr1 and βr2. The average
values show grater variability throughout the day for rules βr1
and βr2 as compared to rules βr3 and βr4, with average values
ranging from -0.71 to 1.59 and from -0.18 to 0.27, respectively. This means that the rule proposed by Verma et al. (1978) does not give the correction of advective effects determined by the original equation of Bowen (1926), but are readily corrected by the methodologies proposed by Uhland et al. (1996). The daytime values of βr3 and βr4 showed to be much more constant
Table 1 – Average values of the Bowen ratio for each accepting/rejecting rule, time interval and phonological stage: budding period (BP); vegetative
growth (VG); full fl owering (FF); beginning fruit growth (BFG); pause on fruit growth (PFG); ending fruit growth (EFG); fruit maturation (FM); physiological rest (PR).
Time interval Phenological phase
BP DV FF BFG PFG EFG MF PR
Bowen ratio accepting/rejecting rule, βr1
06:00 – 06:45 07:00 – 07:45 08:00 – 08:45 09:00 – 09:45 10:00 – 10:45 11:00 – 11:45 12:00 – 12:45 13:00 – 13:45 14:00 – 14:45 15:00 – 15:45 16:00 – 16:45 17:00 – 17:45
-0.17 -0.27 -0.25 -0.28 -0.43 -1.01 -0.26 -0.49 -1.77 1.33 -0.01 0.02 0.28 0.24 0.27 1.59 0.64 -0.71 1.22 0.95 0.31 0.13 0.22 0.00 0.57 1.29 0.32 0.40 0.48 0.52 0.45 0.30 0.27 0.14 0.08 -0.38 -0.28 0.11 0.18 0.25 0.24 0.28 0.30 0.42 -1.29 0.12 -0.29 -0.13 -0.13 0.38 0.47 0.50 0.51 0.39 0.41 0.39 0.38 0.28 0.12 -0.03 -007 0.97 0.41 0.46 0.36 -0.15 0.87 0.18 0.21 0.03 -0.03 -0.13 0.84 0.48 1.51 1.64 0.84 0.59 -1.40 0.37 -1.12 -0.15 -0.23 0.10 -1.41 0.88 1.03 -1.49 0.97 0.64 0.79 -0.75 0.19 0.22 0.04 0.58 Bowen ratio accepting/rejecting rule, βr2
06:00 – 06:45 07:00 – 07:45 08:00 – 08:45 09:00 – 09:45 10:00 – 10:45 11:00 – 11:45 12:00 – 12:45 13:00 – 13:45 14:00 – 14:45 15:00 – 15:45 16:00 – 16:45 17:00 – 17:45
-0.17 -0.27 -0.26 -0.29 -0.44 -1.02 -0.26 -0.49 -1.80 -0.34 -0.01 0.02 0.28 0.68 0.27 1.59 0.08 -0.71 1.22 0.95 0.31 0.13 0.22 0.00 0.55 1.30 0.48 0.40 0.48 0.52 0.45 0.30 0.27 0.14 0.08 -0.38 -0.28 0.11 0.14 0.25 0.24 0.28 0.30 0.42 -1.29 0.12 -0.29 -0.13 -0.13 0.37 0.43 0.50 0.51 0.39 0.41 0.39 0.38 0.28 0.12 -0.03 -0.07 0.97 0.41 0.46 0.36 -0.15 0.87 0.18 0.21 0.03 -0.03 -0.13 0.84 0.48 1.51 1.73 0.84 0.59 1.89 0.37 -1.12 -0.15 -0.23 0.10 -1.32 0.89 0.88 -1.48 0.97 0.65 0.81 -0.20 0.17 0.31 0.04 0.57 Bowen ratio accepting/rejecting rule, βr3
06:00 – 06:45 07:00 – 07:45 08:00 – 08:45 09:00 – 09:45 10:00 – 10:45 11:00 – 11:45 12:00 – 12:45 13:00 – 13:45 14:00 – 14:45 15:00 – 15:45 16:00 – 16:45 17:00 – 17:45
-0.17 -0.27 -0.26 -0.29 -0.44 -0.31 -0.22 0.00 0.06 -0.23 -0.01 0.00 0.27 -0.07 -0.18 0.17 0.15 0.12 0.09 0.20 0.22 -0.05 0.00 0.00 0.01 0.15 0.28 0.40 0.32 0.33 0.30 0.30 0.27 0.14 -0.04 0.01 -0.16 0.02 0.15 0.30 0.24 0.28 0.30 0.42 0.26 0.12 -0.09 -0.22 -0.07 0.19 0.24 0.50 0.51 0.39 0.41 0.39 0.38 0.28 0.01 -0.07 0.03 0.26 0.43 0.37 0.53 0.19 0.16 0.24 0.04 0.03 0.02 -0.05 0.25 0.48 0.16 0.16 0.63 0.27 0.10 -0.06 -0.02 -0.02 -0.11 0.01 -0.02 0.86 0.83 0.77 0.80 0.77 0.53 0.39 0.30 0.15 0.01 -0.01 Bowen ratio accepting/rejecting rule, βr4
06:00 – 06:45 07:00 – 07:45 08:00 – 08:45 09:00 – 09:45 10:00 – 10:45 11:00 – 11:45 12:00 – 12:45 13:00 – 13:45 14:00 – 14:45 15:00 – 15:45 16:00 – 16:45 17:00 – 17:45
For soil cover factors Fsc > 0.97, which occurred in
the following phenological stages, the average β values were mainly positive with maximum around midday and minimum in the sunset and sunrise hours in the full fl owering (FF). At fruit maturation (FM) and physiological rest (PR) stages, the values of βr1 and βr2 sometimes were too high (varying from 1.51 to
1.89), sometimes too low (-1.49 to -1.32), which occurred any time of the day, conditions not observed when the methodologies proposed by Uhland et al. (1996) and by Soares (2003) were used (Table 1). However, when we analyse the pause on fruit growth (PFG) stage, it can be found that the values obtained using the methodologies proposed by Bowen (1926) (βrl) and
by Verma et al. (1978) (βr2) were almost equal to those obtained
by the methodologies by Uhland et al. (1996) (βr3) and by
Soares (2003) (βr4). When analyzing each accepting/rejecting
rule separately, one can observe that βr1 semms to condition
the obtainment of very variable data throughout the daytime period, with the occurrence of positive and negative values. Bigger fl uctuations were observed in the morning for the full fl owering (FF) and beginning fruit growth (BFG) stages and in the afternoon for the ending fruit growth (EFG) stage. Similar behavior of βr2 values was obtained with very small correction
frequency based on the methodology proposed by Bowen (1926), except in the beginning fruit growth (BFG) stage when it was observed an inversion in the Verma et al. (1978) rule. It can also be observed that the values of βr3 and βr4 appeared to
be very closed to each other mainly in the full fl owering (FF); beginning fruit growth (BFG) and pause on fruit growth (PFG) stages, with the values of βr3 been slightly greater than those
for βr4. Meanwhile, in the ending fruit growth (EFG) and full
maturation (FM) stages, the βr3 values looks to be too far apart
from those of βr4, except in the early morning and late afternoon
hours when they became almost equal (Table 1).
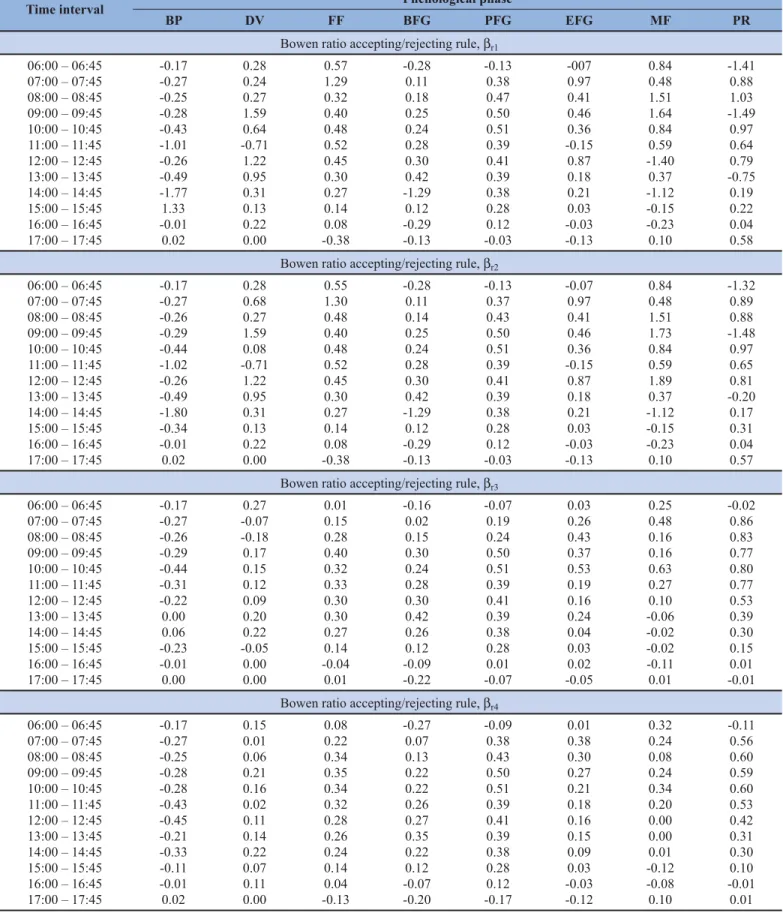
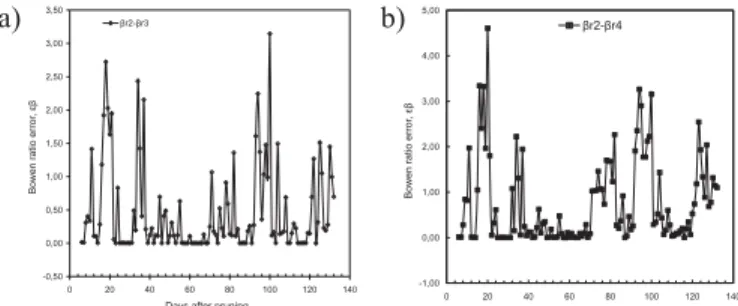
Figures 1 and 2 shown overall comparatives analysis of the β values obtained by the four accepting/rejecting rules applied in this study (Spano et al., 2000). When comparing βr1 and βr2
with βr3, the statistical error (εβ) was too variable throughout
the vineyard fruiting cycle reaching maximum values of 5.80 and 3.15, respectivily (Figures 1a and 2a). When comparing βr1
and βr2 with βr4, εβwas even more variable reaching maximum
values of 4.60 and 2.25, respectivily (Figures 1b and 2b). However, when comparing βr1 with βr2 the maximum value of
εβ was 0.015 (Figure 1c). Then, the application of Verma et al.
(1978) methodology did not reduces signifi cantly the advective effects on the values of the Bowen ratio (βr1) as occurred when
using that proposed by Unland et al. (1996) - βr3. This means that
the Verma et al. (1978) equation coeffi cients need to be adjusted to the surroundings environmental conditions. The alternative accepting/rejecting rule (βr4), that is, accepting only values
of the Bowen ratio in the interval -0.7 < β < 0.7, resulted in β
values very close to those obtained by the Unland et al. (1996) rule - βr3. In this study, it was used a vertical distance between
psychrometers of 150 cm, once the use of the standard 100 cm resulted in quite high errors in the values of β.
This shows that the methodology proposed by Verma et al. (1978) does not allow an effi cient correction of advective effects when Bowen ratio is calculated based on the original equation recommended by Bowen (1926), corrections that can be obtained when using the methodologies proposed by both Uhland (1996) and Soares (2003).
By comparing the latent heat fl ux obtained by the BREB with that determined by high precision weight lysimeter in alfalfa crop, Todd et al. (1998) observed decreasing values of β throughout day-time with higher frequency of negative values.
-0,002 0,000 0,002 0,004 0,006 0,008 0,010 0,012 0,014 0,016
0 20 40 60 80 100 120 140
Days after pruning
Bowen
ratio
error
,ε
β
βr1-βr2
-0,50 0,00 0,50 1,00 1,50 2,00 2,50
0 20 40 60 80 100 120 140
Days after pruning
Bowen
ratio
error
,εβ
βr1 - βr4 -1,00
0,00 1,00 2,00 3,00 4,00 5,00 6,00 7,00
-1 19 39 59 79 99 119 139
Days after pruning
Bowen
ratio
error
,ε
β
βr1- βr3
Figure 1 – Comparative analysis between the accepting/rejecting β
values rules in relation to the Bowen (1926) methodology for estima-tion of the Bowen ratio, βr1: (a) relation: relação βr1_βr2; (b) relation:
βr1_βr3; (c) relation: βr1_βr4, for vineyards at Petrolina-PE, northeast
Brazil. a)
b)
Moura et al. (2001), observed for a guava orchard, that β rarely becomes above + 1 or bellow -1 with values in the interval between 0.0 and 0.05 for most of the days but rather variable in the early morning and late afternoon hours.
-0,50 0,00 0,50 1,00 1,50 2,00 2,50 3,00 3,50
0 20 40 60 80 100 120 140 Days after pruning
Bowen
ratio
error
,ε
β
βr2-βr3
-1,00 0,00 1,00 2,00 3,00 4,00 5,00
0 20 40 60 80 100 120 140 Days after pruning
Bowen
ratio
error
,ε
β
βr2-βr4
Figure 2 – Comparative analysis between the accepting/rejecting β
values rules in relation to the Verma et al. (1978) methodology for estimation of the Bowen ratio, βr2: (a) relation: βr2_βr3; (b) relation: βr2_βr4, for vineyards at Petrolina-PE, Northeast Brazil.
4. CONCLUSIONS
(1) In this study, the Verma et al. (1978) methodology showed few effectivess (??) for attenuating the advective effects on the calculations of the Bowen ratio;
(2) The Unland et al. (1996) and Soares (2003) accepting/ rejection rules were better than that of Verma et al. (1978) for attenuating the advective effects on the calculations of the Bowen ratio;
(3) When comparing the Verma et al. (1978) methodology for obtaining Bowen ratio (βr2) with those of original method
(βr1), Unland et al. (1996) accepting/rejection rule (βr3) and
exclusion of |β| > 0.7 (βr4), the maximum statistical errors
were 0.015, 5.80 and 3.15, respectively.
5. ACKNOWLEDGEMENTS
Thanks to Brazilian Agricultural Research Corporation (Embrapa Tropical Semi-Arid) and to Research National Council - CNPq – PADFIN, program which fi nanced the installation and conduction of the vine and this study. Acknowledge also to the professors of the Atmospheric Science Department of Campina Grande Federal University, for the research advising.
6. REFERENCES
AGRIANUAL. 1997. São Paulo: FNP, 1997, p. 424-435. AGRIANUAL. 2002. São Paulo: FNP, 2002, p. 524-536. ANGUS, D.E.; WATTS, P.J. Evapotranspiration: how good is the
Bowen ratio method? Agricultural Water Management, Amsterdan,v. 8, p. 133-150, 1984.
AZEVEDO, P.V. de; SILVA, B.B. da; SILVA, V.P.R. da, Water requirements of irrigated mango orchards in northeast Brazil. Agricultural Water Management, Amsterdan, v. 58, p. 241-254, 2003.
CELLIER, P.; BRUNET, Y. Flux-gradient relationships above tall plant canopies. Agricultural Forest and Meteorology, Amsterdan, v. 58, p. 93-117, 1992.
F R I T S C H E N , L . J . ; G AY, L . W. E n v i r o n m e n t a l instrumentation. New York: Springer Verlog, 1979. 216pp.
FRITSCHEN, L.J.; SIMPSON, J.R. Surface energy and radiation balance systems: general description and improvements. Journal of Applied Meteorology, Boston, v. 28, p. 680-689, 1989.
FUCHS, M.; TANNER, C.B. Error analysis of Bowen ratios measured by differential psichrometry. Agricultural Meteorology, Amsterdan, v. 7, p. 329-334, 1970.
HEILMAN, J.L.; BRITTIN, C.L; NEALE, C.M.U. Fetch requirements for Bowen ratio measurements of latent and sensible heat fl uxes. Agricultural Forest and Meteorology, Amsterdan, v. 4, p. 261-273, 1989.
KONZELMANN, T.; CALANCA, P.; MÜLLER, G. et al. Energy balance and evapotranspiration in a high mountain area during summer. Journal of Applied Meteorology, Boston, v. 36, n. 1, p. 966-973, 1997.
LOPES, P.M.O.; SILVA, B.B. da; AZEVEDO, P.V. de; et al. Balanço de Energia num pomar de mangueira irrigado. Revista Brasileira de Agrometeorologia, Santa Maria, v. 7, n. 1, p. 1-8, 2001.
MALEK, E.; BINGHAM, G.E.; McCURDY, G.D. Evapotranspiration from the margin and moist playa so closed desert valley. Journal Hydrology, Amsterdan,v.120, p. 15-34, 1990.
MOURA, M.S.B. de; SILVA, B.B. da; AZEVEDO, P.V. de; SOARES, J.M.; LOPES, P.M.O. Determinação de erros do fl uxo de calor latente obtido pelo método do balanço de energia baseado na razão de Bowen. In: CONGRESS BRASILEIRO DE AGROMETEOROLOGIA, 13, 2003, Santa Maria. Situação Atual e Perspectiva da Agrometeorologia: Anais. Santa Maria: SBA:UNIFRA: UFSM, 2003. 1 CD-ROM
OHMURA, A. Objetive criteria for rejecting data for Bowen ratio fl ux calculations. Journal Applied Meteorology, Boston,v. 21, n. 4, p. 595-598, 1982.
OLIVER, H.R.; SENE, K.J., 1992. Energy and water balances of developing vines. Agricultural Forest and Meteorology, Amsterdan, 185, 1992.
PRUEGER, J.H.; HATFIELD, J.L.; AASE, K.J.; JUNIOR, J.L. Agroclimatology: Bowen ratio comparison lisimeters evapotranspiration. Agronomy Journal, Maidson,v. 89, p. 730-736, 1997.
SPANO, D.; SNYDER, R.L.; DUCE, P.; PAW, U.K.T. Estimating sensible and latent heat flux densities from grapevine canopies using surface renewal. Agricultural Forest and Meteorology, Amsterdan,v. 104, p. 171-183, 2000.
TODD, R.W.; EVETT S.R,; HOWELL, T.A. Latent heat flux of irrigated alfalfa measured by weighing lysimeter and Bowen ratio-energy balance. St. Joseph: ASAE, 1998. 19p. (ASAE. Paper 98219). Trabalho apresentado na ASAE Annual International Meeting, 1998, Orlando, Florida.
UNLAND, H.E.; HOUSER, P.R.; SHUTTLEWORTH, W. et al. Surface flux measurement and modeling at a semi-arid sonoran desert site. Agricultural Forest and Meteorology. Amsterdan, v. 82, p. 119-153, 1996.