ISSN 1678-992X
ABSTRACT: Climate, soil and management are the main drives for growth and production of tropical pastures. Thus, a better understanding of the effects of these factors and their inter-actions under climate conditions is required to obtain effective management options. Here, we used data from two field trials to research on climate and management interactions on the pro-duction seasonality of Panicum maximum Jacq. Treatments included four sampling times (250, 500, 750, and 1000 °C accumulated) during eight regrowth period, under irrigated and rainfed conditions and, cuts were made to simulate grazing intensity. All treatments were arranged in a completely randomized block design with four replications. At each sampling time, basal tillers were sampled to observe meristematic differentiation and were linked with the respective day-length. Soil moisture was determined, and the water availability index (WAI) was calculated. The dry matter production (DMP) was taken and relative productivity was calculated. Soil moisture was the key seasonal drive in spring-summer and the WAI could be used to adjust the maximum production for that season. The major drive for DMP in fall was the daylength, which was found at 11.81 h. For all seasons, DMP correlated better with the residues in early regrowth phase (r = 0.82 and p < 0.0001) and with degree-days at final regrowth phase (r = 0.73 p < 0.01). Applying these critical values to management guidelines should make Guinea grass DMP more efficient on tropical farms.
Keywords: daylength, degree-days, mombaça, tropical forage, water deficit
Key factors that influence for seasonal production of Guinea grass
Leandro Coelho de Araujo1*, Patricia Menezes Santos2, Daniel Rodriguez3, José Ricardo Macedo Pezzopane2
1São Paulo State University/FEIS, Av. Brasil, 56 – 15385-000 – Ilha Solteira, SP – Brazil.
2Embrapa Southeast Livestock, Rod. Washington Luiz, km 234 s/n, – 13560-970 – São Carlos, SP – Brazil. 3The University of Queensland– Queensland Alliance for Agriculture and Food Innovation, PO Box 102 – Toowoomba – Australia.
*Corresponding author <[email protected]>
Edited by: James Pierre Muir
Received October 08, 2016 Accepted February 20, 2017
Introduction
Air temperatures ranging between 12 and 17.5 °C generally provide slow or no growth for tropical forag-es cultivated in Brazil (Cruz et al., 2011; Araujo et al., 2013). Thus, for areas with mild temperatures in winter, irrigation alone cannot provide significant production since air temperature acts as the main limiting factor. The dry matter (DM) production of tropical forage grass-es is also influenced by photoperiods that stimulate flo-ral induction. At the onset of meristem differentiation, the formation of leaf primordium is interrupted and the reproductive tissue growth starts to cause changes in sugars partitioning, which is preferentially driven to internode elongation and seed production (Taiz et al., 2015) reducing the leaf appearance rate, resulting in a decrease in the forage quality and voluntary feed intake of cattle (Giacomini et al., 2009).
Water deficit also drives DM seasonal produc-tion of Panicummaximum (Guinea grass) cv. ‘Mombaça’ (Souza et al., 2005; Carnevalli et al., 2006); however, little is known about the critical values needed for its growth and the interactive effect of water availability on annual productivity. Besides climate variables, the sward management also affects pasture growth. For ex-ample, the amount of post-defoliation remnant biomass can influence pasture regrowth. This is determined by remaining number meristematic growth points, leaf area, and organic reserves (Gomide et al., 2002). Thus, the initial herbage mass conditions could directly influ-ence the seasonal production of Mombaça due to its isolated effect on regrowth or in association with cli-mate variables.
A post-grazing remnant biomass of 0.30 m height is indicated to provide greater grazing efficiency and higher DM accumulation rate for Mombaça (Carnevalli et al., 2006). Although there are results available from several studies assessing sward structure under differ-ent tropical grazing managemdiffer-ent conditions, few studies have focused on the associated climate variables. This combined assessment could help to better understand the factors involved in DM accumulation during re-growth, the weight of each variable at a given growth stage or season, and their participation in the seasonal production. The aims of this study were to (i) determine the effects of photoperiod and soil moisture on aboveg-round DM production; and (ii) evaluate the relationship between post-harvest remnant biomass and degree-days on Guinea grass regrowth.
Materials and Methods
Experimental site
The experiment was carried out at the Cerrado biome (Savanna) in São Carlos, São Paulo State, Brazil (21°57’42” S, 47°50’28” W, and altitude 860 m) between 23 Feb 2010 and 11 Apr 2011. The soil was an Oxisol (Soil Survey Staff, 1999), and the climate is subtropi-cal humid (Koppen classification: Cwa) (Alvares et al., 2013). The annual average values of maximum, mini-mum and mean air temperatures and accumulated an-nual precipitation are 27.1, 15.9, 21.5 °C and 1,356 mm, respectively.
During the experiment the lowest temperatures occurred during late fall to mid-winter, with average mean air temperature of 17.6 °C and average minimum
Animal Science and Pastur
es
|
Resear
ch Ar
air temperature of 12.6 °C, whereas the highest tem-peratures were recorded in summer, reaching values of 23.0 and 18.7 °C for average mean air temperature and average minimum air temperature, respectively (Table 1). The cumulative rainfall was 1.658 mm and the highest and lowest values were recorded during the mid-summer to early fall (509 mm) and winter (9 mm), respectively (Table 1). The frequency of rainfall was higher during summer to early fall accounting for approximately 75 % of the total precipitation (Table 1).
Establishment of Guinea grass
Guinea grass was sown on 18 Nov 2009 in two simultaneous trials, one irrigated and one rainfed. Irri-gation was used in order to achieve maximum growth rates. Sprinkler irrigation was used every 4 d whenever the balance between cumulative daily precipitation and cumulative Piche evaporimeter evaporation was -20 mm or greater. In both trials, the grass was mechanically cut twice during the establishment phase (19 Jan and 23 Feb 2010) at 0.3 m aboveground and fertilized with 80 kg N ha–1 cut–1 using ammonium sulfate.
Treatments and mass harvesting
For each trial, plots (6 by 6 m) were arranged in a completely randomized block design with four replica-tions. Samples were taken at four sampling times consid-ering the thermal sum up to 250, 500, 750, and 1000 °C (treatments) - during eight regrowth periods, as shown in the diagram (Figure 1).
After the last sampling time (1000 °C) for each of the eight-regrowth periods, all the plots were mechani-cally cut down to 0.3 m above the soil, and a new cycle of regrowth and sampling started. The pasture was then fertilized using 71 kg N ha–1 cut–1, 35 kg K ha–1 cut–1, and
33 kg P ha–1 cut–1 split applied as ammonium sulphate,
potassium chloride, and single superphosphate, respec-tively.
At each sampling time, the fresh weight of the to-tal mass from soil surface to 0.3 m (remnant biomass
stratum) and above 0.3 m (defoliation stratum) was re-corded inside two 1 by 1 m quadrats. Fresh subsamples were taken (0.5 kg) to estimate the green leaf area us-ing a Leaf Area Meter, samples were then oven dried at 60 °C for 72 h to determine the leaf dry weight.
Climatic data and soil moisture
Daily air temperatures (maximum, minimum, and average), rain, and incoming total solar radiation were recorded using an automatic weather set up near the experimental site. The photoperiod for each day of the year was calculated based on the local latitude.
Soil moisture content was recorded using calibrat-ed capacitance sensors (Sentek, 2001). Readings were taken at the center of each 1000 °C treatment, repre-senting the whole block. They were taken at 0.1 m inter-vals between 0.1 and 1 m soil depth.
Hydrologic indices
To investigate the effect of soil water availability on DM production between the systems, we performed a linear regression between the hydrologic indices (in-dependent) and relative DM production ((in-dependent), calculated for each sampling time. The two hydrologic indices, termed here as direct (DWI) and indirect (IWI)
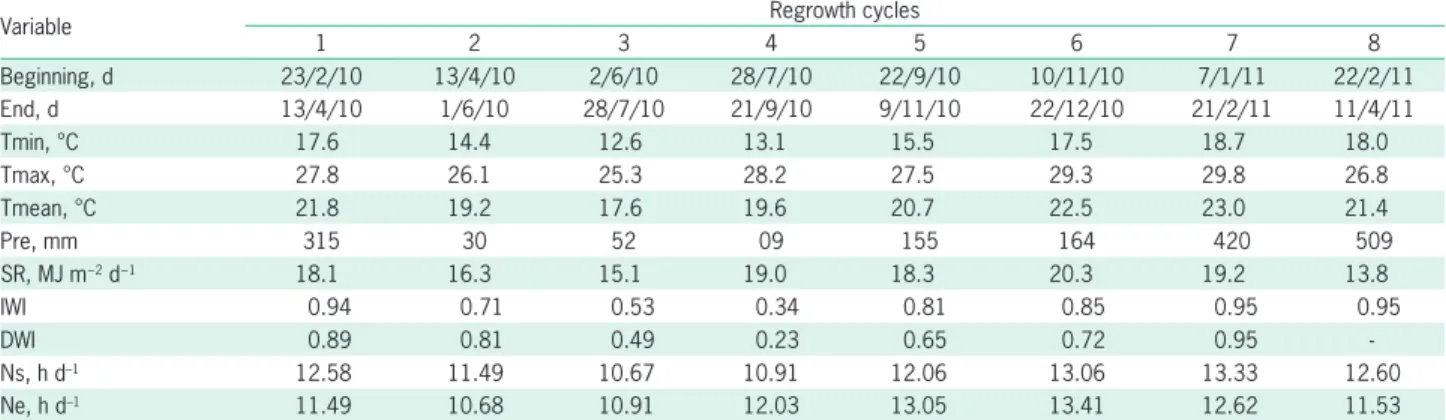
Table 1 – Climatic conditions of regrowth cycles for Guinea grass from 2010 to 2011 in São Carlos, SP, Brazil.
Variable Regrowth cycles
1 2 3 4 5 6 7 8
Beginning, d 23/2/10 13/4/10 2/6/10 28/7/10 22/9/10 10/11/10 7/1/11 22/2/11
End, d 13/4/10 1/6/10 28/7/10 21/9/10 9/11/10 22/12/10 21/2/11 11/4/11
Tmin, °C 17.6 14.4 12.6 13.1 15.5 17.5 18.7 18.0
Tmax, °C 27.8 26.1 25.3 28.2 27.5 29.3 29.8 26.8
Tmean, °C 21.8 19.2 17.6 19.6 20.7 22.5 23.0 21.4
Pre, mm 315 30 52 09 155 164 420 509
SR, MJ m−2 d−1 18.1 16.3 15.1 19.0 18.3 20.3 19.2 13.8
IWI 0.94 0.71 0.53 0.34 0.81 0.85 0.95 0.95
DWI 0.89 0.81 0.49 0.23 0.65 0.72 0.95
-Ns, h d–1 12.58 11.49 10.67 10.91 12.06 13.06 13.33 12.60
Ne, h d–1 11.49 10.68 10.91 12.03 13.05 13.41 12.62 11.53
Tmax, Tmin and Tmean = maximum, minimum and mean air temperatures, respectively; Pre = accumulated precipitation; SR = Average incoming solar radiation; DWI and IWI = direct and indirect moisture index method, respectively; and Ne and Ns is the photoperiod at the end and at the start of the regrowth cycle.
water indices (mm d–1). The DWI was calculated as ratio
between actual (ETa) and crop evapotranspiration (ETc) calculated for the rainfed and irrigated trials, respective-ly. The IWI was calculated based on the procedures de-scribed by Thornthwaite (1948), and Thornthwaite and Mather (1955), i.e. the ratio of ETa to potential evap-otranspiration (ETp). The crop coefficient and the soil water holding capacity (mm) were assumed as 1 and 100 respectively, as assumed by Pezzopane et al. (2014).
Apical meristem development and critical photoperiod
The apical meristem developmental stage was determined in 10 basal tillers per plot that displayed heights close to the average height observed in the re-spective sward. The selected tillers were sectioned at ground height, and after a longitudinal cut, the apical meristem was observed using a stereomicroscope using magnification up to 40x. Reproductive initiation was defined when floral primordia could be identified oth-erwise the apex was classified as in a vegetative phase.
A critical photoperiod was defined as the photo-period (h) that coincided with the transition of the apical meristems from vegetative to reproductive (flowering). This transition phase was demarcated as soon as the undifferentiated flower primordial structures were ob-served under the microscope.
Statistical analysis
All statistical analyses were performed using SAS (Statistical Analysis System, v. 9.0), with a model appro-priate for a completely randomized block design with four replications and four treatments. The variables were submitted to preliminary exploratory analysis to identify outliers and check the satisfaction of the basic premises of analysis of variance (linearity, homoscedas-ticity and normality of the errors). Significance was de-clared at p ≤ 0.05.
The effect of water availability in the soil on rel-ative DM production was evaluated by simple linear regressions (Y = β0 + β1×1 + ε) fitted using the REG procedure. The values of the relative DM production were used as dependent variables and the calculated hy-drologic indices as independent variables. The influence of post-harvest remnant biomass and days-degrees over regrowth cycles for the irrigated trial were analyzed by the Pearson's correlation between above-remnant bio-mass DM production and (i) below-remnant biobio-mass DM production at the beginning of each regrowth and (ii) cumulative degree-days using the CORR procedure.
Results
Water index
In the irrigated trial, the soil moisture ranged from 218 to 268 mm, showing an average of 243 ± 9.5 mm. The maximum and minimum values of field capac-ity (FC) were 100 and 87 %, respectively, with an
aver-age of 96 ± 3.0 %. For the rainfed trial, the soil moisture range was rather significant, with values ranging from 123 to 235 mm and an average of 162 ± 28.2 mm. Con-sequently, the oscillation based on FC was much higher than that observed in the irrigated trial showing an aver-age of 64 ± 11 % and the highest and lowest values of 93 and 49 %.
A similar variation for hydrologic indices was ob-served during the seasons declining gradually from the 1st cycle in the late summer to the 4th cycle in the winter
season where it reached the lowest value of 0.23. Sub-sequently, the values increased reaching a maximum of 0.95 in the summer (Table 1).
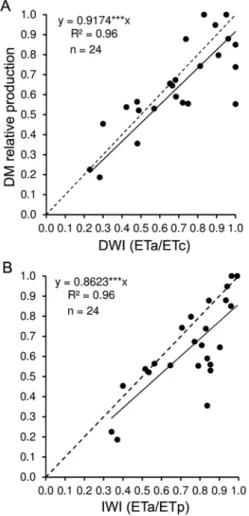
To evaluate the maximum decrease in the DM pro-ductivity of Guinea grass due to soil water, simple linear regression analyses between the relative DM productiv-ity (rainfed/irrigated) ratio and DWI and IWI were per-formed, using the mean values of sampling time (250, 500, 750, and 1000 °C) of each regrowth cycle. The fit-ting of equations showed the variation of DM relative productivity of about 9.0 % (p < 0.0001) for each 10 % variation in the DWI and IWI values, respectively (Fig-ures 2A and B).
DM production
In this study, the leaf fraction accounted for about 92 % of total DM of the above-remnant biomass for the irrigated and rainfed trials. Therefore, the individual values of the morphological fractions are not shown and are consolidated as total DM production.
The average above-remnant biomass total DM production observed at the end of each regrowth cycles was of 3,857 ± 124 and 2,996 ± 302 kg ha–1 for the
ir-rigated and rainfed trials, respectively. DM production showed a variation of about 68 % for the irrigated trial, whereas for the rainfed trial, it showed a variation of 89 %. In both trials, the highest and lowest DM productions were recorded for regrowth cycles in summer-fall and late fall to early winter, respectively. For more informa-tion, refer to Araujo et al. (2013).
Apical meristem
The floral meristem in early flowering stage were observed at the beginning of fall, with a photoperiod of approximately 11.8 h (Figure 3). The reproductive-meri-stem phase followed for the next 42 d of which, the first 20 d were characterized by early floral meristems with undifferentiated structures and in the remaining 22 d almost all tillers were flowered, producing about 66 kg of DM ha–1 of panicles.
Degree-days vs. remnant biomass
ture during the experimental period. However, tropical forage grasses are generally tolerant to water deficit, having considerable compensatory growth when water deficit is withdrawn (Guenni et al., 2002). Studies using
U. brizantha cv. Marandu (Palisadegrass) have indicated that soil moisture must be decreased to 25 % of FC to exhibit a significant reduction in DM production and til-lering (Araujo et al., 2011). Still, growth can be normal-ized a few days after the occurrence of an event that suppresses moisture deficit, such as rain or irrigation (Guenni et al., 2002).
Another important factor is the low air tempera-ture. Since lower soil moisture values were recorded in the winter season when we observed the lowest aver-age air temperature of 17.6 °C (4th cycle), which is close
to the minimum base temperature for Guinea grass of 15.6 °C (Araujo et al., 2013). Other studies have also re-(Araujo et al., 2013), three distinct phases were
distin-guished as shown in Figure 4. In phase 1 the Guinea grass production (from 0 to 250 °C) was more correlat-ed to the residual DM, followcorrelat-ed by phase 2 (at 500 °C) characterized by similar correlations among the vari-ables, ending with a phase 3, where DM production was better correlated with degree-days (from 750 to 1000 °C) (Figure 4). These phases corresponded to the foliar area index of 2.45; 4.79 and ≥ 5.98 m2 leaf m–2 soil,
respec-tively (data not shown).
Discussion
Soil moisture and hydrologic indices
Despite the low soil moisture observed in the rain-fed trial, the total DM reduction as compared to the ir-rigation trial was only 25 %. A greater reduction was expected, given the observed frequency of low soil
mois-Figure 2 – Relationship between Guinea grass DM relative
production (rainfed/irrigated) and (A) direct moisture index (DWI) and (B) indirect moisture index (IWI). Where: ETa = actual evapotranspiration; ETc = crop evapotranspiration; ETp = potential evapotranspiration; the points represent an average value for a given phase of each regrowth cycle; ---1:1; ***p < 0.0001.
Figure 3 – Occurrence of floral meristem (___) in basal tillers of
Guinea grass according to the local photoperiod (....). Reproductive
initiation was defined when floral primordia could be identified, using a stereomicroscope, otherwise the apex was classified as in a vegetative phase. A total of 1,560 basal tillers were observed.
ported that the maximum productivity of Guinea grass is not reached in the fall/winter with mild temperatures in spite of irrigation (Souza et al., 2005).
Although the water deficit effect cannot be disso-ciated from thermal stress in experiments carried out on farms, these results are more representative of tropical pastures cultivated on commercial farms as compared to experiments carried out in plant growth chambers. The use of indices related to the soil moisture obtained from field experiments could be important to highlight water deficit on the seasonal production of Guinea grass on farms.
The water indices calculated in this experiment showed a linear relationship with DM relative produc-tion (rainfed/irrigated) of Guinea grass (Figures 2A and 2B). Similar results were presented by Pezzopane et al. (2014) for the same cultivar and location (indepen-dent data). These authors used data collected from 54 regrowth cycles between 2004 and 2012, and observed by segmented regression analysis the breakpoint was lo-cated at 0.97, meaning that values of water indices lower than that affect DM production without irrigation.
The results obtained show that both indices, DWI and IWI, can be useful variables to identify seasons where productivity of Guinea grass is influenced by soil moisture. Another important point observed is the high correlation shown between the indices IWI and DWI (r = 0.81; p < 0.0001 and n = 24), indicating that the indi-rect can be used instead of the diindi-rect method, which is advantageous especially because of the simplicity of IWI estimation, which requires only data on air temperature, precipitation, and latitude.
This correlation between DM production and hydrologic indices explains the better fits obtained in empirical models of DM accumulation when this index was considered in order to fit the maximum growth to rainfed conditions. Using this premise, Cruz et al. (2011) found a better fit in the model used to estimate the rate of DM accumulation of Palisadegrass for this location. At this time, the model was more accurate (R2 from 64
to 75; p < 0.0001) when the degree-days were corrected for the hydrologic index.
Apical meristem
The Guinea grass species are, in general, short-day plants (Felippe, 1978; Loch, 1980), that is, the plants start flowering when the photoperiod is smaller than the established critical value. However, caution must be tak-en with the interpretation of the results obtained here, as they do not indicate precisely the critical flowering photoperiod for Guinea grass due to the methodology used, since floral induction occurred in the period prior to the meristematic differentiation observed in this ex-periment.
The exact observation of the vegetative to repro-ductive transition phase could be achieved only with the use of scanning electron microscopy, as demonstrated by Reinheimer et al. (2005) for Guinea grass and U.
plantaginea, after when critical daylength could be ac-curately estimated . However, the results presented here provide support to infer that the critical photoperiod of Guinea grass is, on average, close to 11.8 h and that this cultivar is a short day plant, since flowering started in a less than critical daylength (Figure 3). In a similar study, Camargo-Bortolin et al. (2007) reported forGuinea grass cv. Tanzania a critical photoperiod of 11.5 h, whereas for Guinea grasscv. Colonião grown in a controlled en-vironment, it was approximately 12 h (Felippe, 1978).
Degree-days vs. remnant biomass
The highest correlation between the early re-growth phase and the post-defoliation remnant bio-mass is justified, since the apical meristems, leaf area index, and remaining organic reserves after defoliation are the main variables that determine the subsequent regrowth of Guinea grass. Although there is much dis-cussion about which of these variables most contributes in the early regrowth phase, studies have shown that these components are involved in the regrowth; how-ever, their ratios and importance depend on factors such as the intensity and frequency of defoliation, climate, forage species, shoot age and others (Woledge and Leafe, 1976; Donaghy and Fulkerson, 1997; Gomide et al., 2002).
Only after the initial regrowth phase (second phase), resulting in the emergence of new leaf tissues would photosynthesis provide a greater contribution in the appearance and elongation of new tissues, primarily due to a higher photosynthetic rate of new tissues com-pared to the older ones (Ryle and Powell, 1975; Jewiss and Woledge, 1967). From this point onward, tempera-ture exerts greater influence on the process, especially on the radiation use efficiency (Alexandrino et al., 2005), which explains the higher correlation between DM pro-duction and the cumulative degree-days after 500 °C (Figure 4).
This information can drive new studies that use climate data such as air temperature or degree-days to estimate DM production of tropical pastures indicating that the best associations between accumulated DM and those variables occur when the regrowth phase is be-tween the thermal sum of 500 and 1000 °C and that the inclusion of data regarding post-defoliation remnant bio-mass matter could improve parameterization and pre-diction of empirical models, provided this information is considered when the cumulative average temperature is below 500 °C.
Conclusions
animals according to the latitude of each property (e.g., temperature and daylength). As for the hydrologic in-dex, this can be a useful tool to identify key periods of the year when the hydrologic balance has a direct in-fluence on dry matter production, and the use of his-torical of temperature and precipitation data is sufficient to perform this type of zoning. During the regrowth of Mombaça, DM production was more dependent upon post-harvest remnant biomass up to cumulative thermal sums of 500 °C, then degree-days were more correlated with the DM production.
Acknowledgments
Thanks to FAPESP (São Paulo Research Founda-tion) for granting a graduate scholarship to L.C. Araujo (2009/00263-6).
References
Alexandrino, E.; Gomide, J.A.; Gomide, C.A.M. 2005. Canopy growth and development of Panicum maximum cv. Mombaça. Revista Brasileira de Zootecnia 34: 2164-2173 (in Portuguese, with abstract in English).
Alvares, C.A.; Stape, J.L.; Sentelhas, P.C.; Gonçalves, J.L.M.; Sparovek, G. Köppen’s climate classification map for Brazil. 2013. Meteorologische Zeitschrift 22: 711–728.
Araujo, L.C.; Santos, P.M.; Mendonça, F.C.; Mourão, G.B. 2011. Establishment of Brachiaria brizantha cv. Marandu, under levels of soil water availability in stages of growth of the plants. Revista Brasileira de Zootecnia 40: 1405-1411.
Araujo, L.C.; Santos, P.M.; Rodriguez, D.; Pezzopane, J.R.M.; Oliveira, P.P.A.; Cruz, P.G. 2013. Simulating Guinea grass production: empirical and mechanistic approaches. Agronomy Journal 105: 61-69.
Camargo-Bortolin, L.H.G.; Santos, P.M.; Prado, C.H.B.A. 2007. Survival strategy of panicum maximum Tanzania pastures under rotational grazing. Archivos de Zootecnia 56: 169-180 (in Portuguese, with abstract in English).
Carnevalli, R.A.; Silva, S.C.; Bueno, A.A.O.; Uebele, M.C.; Bueno, F.O.; Hodgson, J.; Silva, G.N.; Morais, J.P.G. 2006. Herbage production and grazing losses in Panicum maximum
cv. Mombaça under four grazing managements. Tropical Grasslands 40: 165-176.
Cruz, P.G.; Santos, P.M.; Pezzopane, J.R.M.; Oliveira, P.P.A.; Araujo, L.C. 2011. Empirical models to estimate the accumulation of dry matter in Marandu palisade grass using agrometeorological variables. Pesquisa Agropecuária Brasileira 46: 675-681 (in Portuguese, with abstract in English).
Donaghy, D.J.; Fulkerson, W.J. 1997. The importance of water-soluble carbohydrate reserves on regrowth and root growth of
Lolium perenne (L.). Grass and Forage Science 52: 401-407.
Felippe, G.M. 1978. Effects of photoperiod, GA3 and CCC on flowering of Panicum maximum. Hoehnea 7: 11-16.
Giacomini, A.A.; Silva, S.C.; Sarmento, D.O.L.; Zeferino, C.V.; Souza Júnior, S.J.; Trindade, J.K.; Guarda, V.A.; Nascimento Júnior, D. 2009. Growth of marandu palisadegrass subjected to strategies of intermittent stocking. Scientia Agricola 66: 733-741.
Gomide, J.A; Huaman, C.A.M. and Paciullo, D.S.C. 2002. Photosynthesis, organic reserves and regrowth of mombaça grass (Panicum maximum Jacq.) under different defoliation intensities of the main tiller. Revista Brasileira de Zootecnia 31: 2165-2175 (in Portuguese, with abstract in English).
Guenni, O.; Marín, D.; Baruch, Z. 2002. Responses to drought of five Brachiaria species. I. Biomass production, leaf growth, root distribution, water use and forage quality. Plant and Soil 243: 229-241.
Jewiss, O.R.; Woledge, J. 1967. The effect of age on the rate of apparent photosynthesis in leaves of tall fescue (Festuca
arundinacea Schreb.). Annals of Botany 31: 661-671.
Loch, D.S. 1980. Selection of environment and cropping system for tropical grass seed production. Tropical Grasslands 14: 159-168.
Pezzopane, J.R.; Cruz, P.G.; Santos, P.M.; Bosi, C.; Araujo, L.C. 2014. Simple agrometeorological models for estimating Guinea grass yield in Southeast Brazil. International Journal of Biometeorology 58: 1479-1487.
Reinheimer, R.; Pozner, R.; Vegetti, A.C. 2005. Inflorescence, spikelet, and floral development in Panicum Maximum and
Urochloa Plantaginea (poaceae). American Journal of Botany
92: 565-575.
Ryle, G.J.A.; Powell, C.E. 1975. Defoliation and regrowth in the graminaceous plant: the role of current assimilate. Annals of Botany 39: 297-310.
Sentek Technologies. 2001. Calibration of the Sentek Soil Moisture Sensors. Sentek, Stepney, Australia.
Soil Survey Staff. 1999. Soil Taxonomy: A Basic System of Soil Classification for Making and Interpreting Soil Surveys. 2ed. USDA-NRCS, Washington, DC, USA. (Agricultural Handbook, 436).
Souza, E.M.; Isepon, O.J.; Alves, J.B.; Bastos, J.F.P.; Lima, C.L. 2005. Effects of irrigation and nitrogen fertilization on dry matter yield of Panicum maximum cultivars. Revista Brasileira de Zootecnia 34: 1146-1155 (in Portuguese, with abstract in English).
Taiz, L.; Zeiger, E.; MØller, I.M.; Murphy, A. 2015. Plant Physiology and Development. Sinauer, Sunderland, MA, USA. Thornthwaite, C.W. 1948. An approach toward a rational
classification of climate. Geographical Review 38: 55-94. Thornthwaite, C.W.; Mather, J.R. 1955. The Water Balance.
Drexel Institute of Technology, Philadelphia, PA, USA. Woledge, J.; Leafe, E.L. 1976. Single leaf and canopy photosynthesis