• Nenhum resultado encontrado

Resear ch Ar ticle

N/A
N/A
Protected

Academic year: 2019

Share "Resear ch Ar ticle"

Copied!
8
0
0

Texto

(1)

ISSN 1678-992X

ABSTRACT: Sugarcane (saccharum spp.) in Brazil is managed on the basis of “production environments”. These “production environments” are used for many purposes, such as variety allocation, application of fertilizers and definition of the planting and harvesting periods. A quality classification is essential to ensure high economic returns. However, the classification is carried out by few and, most of the time, non-representative soil samples, showing unreal local conditions of soil spatial variability and resulting in classifications that are imprecise. One of the important tools in the precision agriculture technological package is the apparent electrical conductivity (ECa) sensors that can quickly map soil spatial variability with high-resolution and at low-cost. The aim of the present work was to show that soil ECa maps are able to assist classification of the "production environments" in sugarcane fields and rapidly and accurately reflect the yield potential. Two sugarcane fields (35 and 100 ha) were mapped with an electromagnetic induction sensor to measure soil ECa and were sampled by a dense sampling grid. The results showed that the ECa technique was able to reflect mainly the spatial variability of the clay content, evidencing regions with different yield potentials, guiding soil sampling to soil classification that is both more secure and more accurate. Furthermore, ECa allowed for more precise classification, where new “production environments”, different from those previously defined by the traditional sampling methods, were revealed. Thus, sugarcane growers will be able to allocate suitable varieties and fertilize their agricultural fields in a coherent way with higher quality, guaranteeing greater sustainability and economic return on their production.

Keywords: proximal soil sensors, site-specific soil management, soil apparent electrical conductivity, precision agriculture technologies

Precision production environments for sugarcane fields

Guilherme Martineli Sanches1* , Maria Thereza Nonato de Paula2 , Paulo Sérgio Graziano Magalhães2 , Daniel Garbellini Duft4 ,

André César Vitti3 , Oriel Tiago Kolln4 , Bernardo Melo Montes Nogueira Borges4 , Henrique Coutinho Junqueira Franco4

1Universidade Estadual de Campinas/FEA – Depto. de Bioenergia, R. Monteiro Lobato, 80 – Cidade Universitária – 13083-852 – Campinas, SP – Brasil.

2Universidade Estadual de Campinas/FEAGRI, Av. Cândido Rondon, 501 – 13083-875 – Campinas, SP – Brasil. 3Agência Paulista de Tecnologia dos Agronegócios/Polo Regional Centro Sul, R. São Jorge, 283 – 13411-516 – Piracicaba, SP – Brasil.

4Laboratório Nacional de Ciência e Tecnologia do Bioetanol/ CTBE - Av. Giuseppe Máximo Scolfaro, 10.000 – 13083-100 – Campinas, SP – Brasil

*Corresponding author <guilhermeosanches@gmail.com>

Edited by: Silvia del Carmen Imhoff

Received April 12, 2017 Accepted September 05, 2017

Introduction

Brazilian sugarcane mills conduct their crop man-agement on the basis of “production environments” or “cropping environments”. It is pivotal to have knowl-edge of these sugarcane “production environments” to adopt technological measures that explore the maxi-mum yield potential such as correct variety allocation in terms of its genetic potential, fertilization and defini-tion of planting and harvesting period (Landell et al., 2003). Despite its immense importance to the Brazilian sugarcane production system, the classification of envi-ronments is currently based on the expertise of profes-sionals and is carried out by few and non-representa-tive soil samples, showing unrealistic local conditions of soil spatial variability. For several years, the fields were managed homogeneously (Moral et al., 2009). This led to precision agriculture (PA), an approach that encompasses several concepts and technologies for localized management (Silva et al., 2011). One of the technologies that can support producers by providing a more precise description of their areas compared to traditional approaches is the soil apparent electrical conductivity (ECa) sensor method. ECa has proven to be a highly successful, rapid, high-resolution and low-cost method (Reedy and Scanlon, 2003) for determining soil fertility variability (Sudduth et al., 2005) and soil production potential (Corwin and Lesch, 2005; Corwin, 2003). The ECa has been correlated with moisture, soil

salinity, clay content, cation exchange capacity (CEC), clay minerals, pore size and distribution, organic mat-ter and temperature (Ekwue and Bartholomew, 2011; Kitchen et al., 1999; McBratney et al., 2005; Molin and Faulin, 2013; Rhoades and Dowrick, 1999; Sudduth et al., 2001). Within the context of a soil sensing technol-ogy (Viscarra Rossel and Bouma, 2016) to enhance site-specific management and improve the whole produc-tion system, the current study aimed to assess if soil ECa maps are able to assist the classification of “pro-duction environments” in sugarcane fields. Specifically: (i) assess the potential of ECa to be a tool for mapping the variability of physicochemical soil attributes, (ii) map the ECa and soil attributes of two commercial sug-arcane fields and investigate the correlation between them, and (iii) compare the classification of the current “production environments” from areas in item (ii) to a new classification based on a soil sampling targeted by ECa maps, evidencing technological limitations and improvements.

Materials and Methods

The evaluation of the potential of ECa was carried out by the selection of scientific papers that document the data of the ECa and their correlation with soil attri-butes. In total, 17 scientific papers were selected (Table 1) and Pearson’s correlation coefficients between the ECa and soil attributes were extracted.

Agricultural Engineering

|

Resear

ch Ar

(2)

Two experimental fields were selected to map the soil ECa. Soils were classified according to USDA Soil Taxonomy (Soil Survey Staff, 2014). Field 1 (21°49'11.67" S, 48°35'43.37" W; 485 m altitude) was ~100 ha, and its soils were classified as Ultic

Haplust-alfs [clay, silt and sand = 59, 230 and 711 g kg–1,

re-spectively] and a Rhodic Eutrustox [clay, silt and sand

= 267, 362 and 371 g kg–1, respectively] planted with

sugarcane variety RB855453. Field 2 (21°46'27.97" S, 48°37’33.75” W; 564 m altitude) was 35 ha, its soil was classified as Typic Haplustox [clay, silt and sand =

246, 53 and 701 g kg–1, respectively] and planted with

sugarcane variety RB975201. The soil of the experi-mental fields was sampled from a regular grid (50 m) from the 0.0-0.2 m layer. Experimental fields 1 and 2 had 303 and 126 sampling points, respectively (Figure 1A and B, respectively). Soil samples were analyzed to quantify the micro- and macronutrients, clay content,

organic matter and pH. The ECa was measured by an electromagnetic induction (EMI) sensor in July 2014 (low rainfall season in the region), set to obtain read-ings from the 0.00-0.38 m layer. The ECa was mea-sured in parallel rows with intervals of 10 m pulled by a field vehicle. The data logger frequency was 1 Hz. The ECa readings of each experimental field were

taken over a period shorter than one day. There was

no precipitation on the days ECa was measured that could change the soil humidity and, consequently, in-fluence the ECa measurements. The data for the ECa and soil attributes were analyzed to remove discrep-ant values from laboratory errors and field readings following the method proposed by Driemeier et al. (2016). Any input value that deviated from the mean by more than three standard deviations (for a given attribute) was treated as an outlier. After the removal of discrepant values, the correlation between soil at-tributes and ECa was calculated using Pearson’s

cor-relation coefficient (r).

In order to obtain the spatial variability maps of the attributes evaluated, the data were interpolated using ordinary kriging (OK). In the variogram setting, data interpolation was achieved by cross-validation to select the model (exponential, Gaussian or spherical) that best adapted the data and produced the smallest errors.

The “production environments” of the experi-mental fields were defined in accordance with the Agronomic Institute (IAC) method (Prado, 2016). “Pro-duction environments” or “cropping environments” of sugarcane fields range from A to E, where environment A, in the state of São Paulo, Brazil, considering an av-erage of 5 years, presents the greatest productive

po-tential (> 100 Mg ha–1), while environment E has the

least (< 70 Mg ha–1). The current classification of the

experimental fields was obtained from the Mill data-base. New sampling points were targeted by ECa maps to perform a new classification and compare with the previous. The ECa maps were divided into classes (by quantiles) and the sample points were allocated to rep-resentative plots of the fields.

Figure 1 – Experimental sugarcane fields located at Nova Europa - SP. Field 1 (A) with 303 sampling points and 9 plots and Field 2 (B) with 126 sampling points and 2 plots.

Table 1 –Studies used in the assessment of the ECa potential (in chronological order) that contemplate the correlation of the soil apparent electrical conductivity (ECa) with soil attributes and the equipment used.

Authors Year Equipment Principle Carroll and Oliver 2005 EM38 Inductive Bronson et al. 2005 Veris / EM38 Resistive/Inductive

Tarr et al. 2005 EM38 Inductive

Cambouris et al. 2006 EM38 Inductive Aimun et al. 2007 Veris Resistive

Kühn et al. 2008 EM38 Inductive

Salton et al. 2011 Veris Resistive Rodríguez Perez et al. 2011 EM38 Inductive Valente et al. 2012 LandMapper Resistive

Guo et al. 2012 Veris Resistive

(3)

being a complementary tool to assist farmers in localized management practices.

The soil collected in the experimental fields showed that the clay content variation (amplitude) of

fields 1 and 2 were 530 and 84 g kg–1, respectively (Table

2). On average, the fields could be classified as clayey

(~ 479 g kg–1) and clay loam (~ 343 g kg–1),

respective-Results and Discussion

From the assessment of the ECa potential, 553 ob-servations of Pearson’s correlation coefficient between ECa and soil attributes were obtained (Figure 2A). The majority of the observations were obtained from sensors that measured ECa by the electrical resistivity principle,

i.e., sensors that directly contact the soil.Conversely, 61

observations (≈ 11 %) originated from inductive sensors,

which use the EMI principle to measure ECa. Although the latter method presents advantages over resistive sen-sors since it does not require direct contact with the soil, this principle is rarely used according to the studies as-sessed. One reason for this could be that EMI sensors are more complicated to calibrate than the majority of the resistive sensors. The results showed that the properties most evaluated by the authors of the studies were clay content, potassium (K), calcium (Ca), magnesium (Mg) and CEC. Clay content was the attribute most evaluated by the EMI principle (28 observations) compared to the resistive technique (24 observations). Boron was the at-tribute that presented the lowest number of observations (five observations). According to the observations, most soil attributes have positive correlations with soil ECa, except for aluminum (Al), hydrogen plus aluminum (H + Al) and iron (Fe) (Figure 2B). The attributes that presented

the highest correlation averages with ECa were Ca (r =

0.44), Mg (r = 0.43), the sum of the bases (r = 0.46) and

base saturation (r = 0.39). The highest correlations were

observed for clay content (r = 0.89), Mg (r = 0.86) and

CEC (r = 0.82). Minimal correlations were also found for

Ca (r = -0.77) and CEC (r = -0.73). Despite the Ca and

CEC showing more positive correlations with ECa, the minimal and negative correlations can be justified as re-lated by Bronson et al. (2005). According to the authors, negative correlation was unexpected and surprising for

these soil properties, as usually Ca2+ salts and ECa are

positively correlated. However, the authors concluded

that these results suggest that ECa may be negatively

affected by the presence of calcic horizons at the sites where ECa correlations were negative. The highest num-ber of observations and correlations observed for clay, Ca, Mg and CEC, revealed the importance of these properties to soil fertility management, where these attributes were those that were most investigated by the authors, inde-pendent of the crop assessed. The high variability in the Pearson’s correlations can be justified because the sensors are influenced, to a lesser or greater extent, by a specific soil attribute, depending on the local crop/climate condi-tions where the measurements were made (Pedrera-Par-rilla et al., 2016). The results corroborate Peralta and Cos-ta (2013), showing that ECa is a powerful and informative method capable of reflecting the variability in the physi-cochemical properties of the soil matrix, which allows for better crop site-specific management. Consequently, the ECa could be a useful procedure for obtaining high-quality information that reveals the spatial distribution of important soil properties for sugarcane management,

Table 2 – Descriptive statistics of soil clay content and apparent electrical conductivity (ECa) for experimental fields 1 and 2.

N valid Mean Min. Max. Var. SD CV Field 1

Clay 288 479.06 199.00 729.00 11118.92 105.45 22.01 ECa 25527 30.24 -52.70 141.00 1826.73 42.74 141.35

Field 2

Clay 123 343.14 300.00 384.00 517.92 22.76 6.63 ECa 11974 5.51 -4.34 14.70 8.88 2.98 54.12 Min. = Minimum; Max. = Maximum; Var. = Variance; SD = Standard Deviation; CV = Coefficient of Variation; Units = Clay [g kg–1]; ECa [mS m–1].

(4)

ly. Experimental field 1 presented higher clay content variability (CV = 22 %) than field 2, showing regions that could be classified as having a high clay content

(> 600 g kg–1). The largest clay contents were located in

the northern and southwestern parts of fields 1 and 2, respectively, according to interpolated spatial variability maps (Figures 3A and B, respectively).

Field 1 presented a high soil ECa value (141 mS

m–1), with negative values for both fields evaluated.

Nega-tive values can be justified by the calibration and the sen-sor measurement principle (Heil and Schmidhalter, 2015). The ECa followed the same trend as the clay variation, showing a larger amplitude and coefficient of variation for experimental field 1 than 2. The valid soil ECa read-ings after removal of outliers are presented in Table 2 and

had a high sampling density (255 and 342 readings ha–1,

for fields 1 and 2, respectively), allowing for maps with high spatial resolution (Figure 3C and D). On average, the ECa readings were higher for field 1 (Table 2), corre-sponding directly to the higher clay content presented by this field compared to field 2. The ECa showed significant

correlations with the clay content (r = 0.71), OM (r =

0.26), H + Al and CEC (r = 0.38) for field 1, and pH (r =

0.29), potassium (K; r = 0.43), copper (Cu; r = 0.42) and

manganese (Mn; r = 0.59) for field 2 (Table 3).

Presenting a high correlation with soil texture (Fortes et al., 2015), ECa showed a significant correlation

with clay content only in field 1. However, despite the low correlation in field 2, it is possible to observe that ECa spatial variability followed the same patterns as clay content variability. A similar finding was reported by Pedrera-Parrila et al. (2016). A low statistical

correla-tion between ECa and clay content for field 2 (r = 0.10)

does not mean that these attributes were not physically related. Proof of this are the variability maps of these attributes (Figure 3B and D, respectively). They clearly show that the regions of high and low clay content are the same with high and low apparent electrical conduc-tivity. Phosphorus and Potassium, important nutrients in sugarcane management (Leite et al., 2016), presented low correlations with ECa for field 1. However, a

sig-nificant correlation for potassium in field 2 (r = 0.43)

was observed. Most Pearson’s correlation observations reported in the studies assessed here for P and K also re-vealed low correlations with ECa, with an average equal to 0.15.

The previous soil pedological classification ac-cording to the Brazilian Soil Classification System (Pra-do, 2016) revealed two types of soil for experimental field 1 (Figure 4A). For experimental field 2 only one point was sampled for classification, revealing conse-quently one soil type (Figure 4B). According to the Mill database, the “production environments” of experimen-tal fields 1 and 2 were classified as A and D,

respective-Table 3 – Pearson’s correlation coefficient (r) between soil attributes and soil apparent electrical conductivity (ECa) for fields 1 and 2.

Clay OM pH P K Ca Mg H+Al BS CEC B Cu Mn

1 0.71* 0.26* 0.05ns 0.13ns 0.04ns 0.32* 0.19* 0.38* 0.29ns 0.38* 0.08ns 0.35* -0.04ns 2 0.10ns 0.06ns 0.29* 0.07ns 0.43* -0.11ns 0.14ns -0.23* 0.18ns 0.12ns -0.19ns 0.42* 0.59* *Significant at 5 %; ns = non-significant; Units = Clay [g kg–1]; OM and P [g dm–3], pH [CaCl

2]; K, Ca, Mg, H+Al, BS and CEC [mmolc dm

–3]; B, Cu and Mn [mg dm–3].

(5)

ly (Figure 5A and B, respectively). The yield potential of the current “production environments” corroborated the average clay content observed in the experimental fields, where field 1 has greater potential than field 2.

One reason for this is that clay soils presented higher fertility and water retention capacity (Havlin et al., 2013; Ismail and Ozawa, 2007), contributing to the good crop performance.

Figure 4 – Current soil maps pedological classification provided by Mill database (A and B) and the new classification by a targeted sampling (C and D) according Brazilian Soil Classification System (SiBCS) (Prado, 2016) with USDA Soil Taxonomy (Soil Survey Staff, 2014) correspondence for fields 1 (left) and 2 (right).

(6)

From the ECa spatial variability maps, new soil sampling points were guided (Figure 3C and D). At these points, soil fertility and pedological analyses were performed again to classify the “production envi-ronments”. Unlike the previous classification (without sample orientation), the new soil classification showed one more soil type (Rodhic Haplustalfs) for field 1 and two (Rodhic Haplustalfs and Rodhic Eutrustox) for field 2 (Figure 4C and D, respectively). The ECa variability maps allowed for sampling orientation, revealing new soil types that had been previously neglected. Prior in-formation on soil spatial variability, such as ECa, can help growers to allocate samples at representative sites in the fields, allowing for more accurate classification and mapping. As stated, while only one point was taken for soil classification for field 2, the ECa map showed that one sample only is not enough to represent the whole soil spatial variability. Next, three samples in field 2 were taken to improve the new classification. For field 1 five samples were maintained, but at differ-ent sites.

The new “production environments” classifica-tion, which involves mineralogical and soil fertility status, did not show the presence of environment A in experimental field 1; rather, environments B (points 1, 3 and 4) and C (points 2 and 5) were revealed. For ex-perimental field 2, the sampling points 6 and 7 showed the same previous classification, i.e., environment D. However, point 8 was reclassified as environment E, that is, with lower yield potential. Based on the results of the new classification performed by a targeted sam-pling, a new “production environments” map was pro-posed for the experimental fields (Figure 5C and D).

Sugarcane plots 04, 05, 50, 51 and 52, of experi-mental field 1, were proposed as belonging to environ-ment B, while the southern plots, 10, 11 and 12, were classified as environment C (Figure 5C). According to soil pedological classification, plot 09 was divided into environments B and C. For experimental field 2, a new division of sugarcane plots was proposed, dividing the

whole field in a north-south direction (Figure 5D).Plot

33 remained within the same previously classified en-vironment, while plot 32 was changed to environment E. The revised plot divisions in field 2 were adequate in the context of the ECa and clay content spatial vari-ability, as observed in the previous maps. From an agronomic perspective, the amended division may be more suitable for crop management compared to the original division. In contrast to experimental field 2, the division of plots was maintained at experimental field 1. It could be observed that environment B was found in the sites with higher clay and ECa contents, corresponding to the sites with the greatest yield po-tential. Despite the number of samples being equal for both classifications for field 1, guided samples by ECa helped to sound out a new soil type and “production environments”.

According to a historical series of yield

produc-tion from the Mill database, the plots 04, 05 and 09 of

field 1 presented, on average, 110 Mg ha–1 of

produc-tion, while plots 10, 11 and 12 produced, on average,

94 Mg ha–1. The yield of plots 50, 51 and 52 was 102

Mg ha–1. According to current plot division, plots 32

and 33 of experimental field 2 were not collected sepa-rately and, thus, it was not possible to distinguish the production gap between them based on the historical data. The production data from experimental field 1 corroborated the adjusted classification of the environ-ments, evidencing the different crop yield potential in this zone, originally classified as a single environment. This difference in yield potential can be justified by the difference in soil texture. As evidenced by the ECa, the lower yield was observed in the regions with a sandy texture. In this class of soils, the availability of water declines significantly, causing a decrease in sugarcane yield, even in the most fertile soils. The yield gaps shown by plots in experimental field 1 corroborate the new classification evidencing that site-specific manage-ment is necessary for improving the whole production system, such as the efficient use of a higher input.

The planting of a more robust sugarcane variety could provide greater yields in the areas with the low-est yield potential of field 1, and management practices should be differentiated through the establishment of different production environments. Prado (2016) high-lights that the management of sugarcane varieties is fundamental to reaching high levels of yield, where the correct selection and allocation of the different variet-ies is necessary according to correct classification of “production environments”. The adoption of different management practices in the most restrictive environ-ments, such as environment E in experimental field 2, can be fundamental to increase profitability and pro-duction sustainability, adopting measures to mitigate expenditure on fertilizers. Furthermore, an integrated variety of management practices can enhance environ-mental productivity through the interaction of soil, cli-mate and variety.

Conclusion

The traditional and current “production environ-ments” classification adopted by sugarcane mills, with no prior information about soil spatial variability, pro-vides imprecise classifications and crop management. A classification provided by a targeted sampling using the ECa sensors is a powerful tool that can help profession-als and producers achieve an accurate classification of sugarcane fields, allowing for allocation of the correct varieties. The use of technologies, like ECa sensors, that explore the yield potential are essential for guaranteeing

the best economic production return. The use of ECa

(7)

Acknowledgments

The authors are grateful to the Fundação de Ampa-ro à Pesquisa do Estado de São Paulo (FAPESP) for their financial support (process 2013/50942-2 and 2014/14965-0) and the mill for the field resources provided.

Author’s Contributions

Conceptualization: Sanches, G.M., Paula, M.T.N. Data acquisition: Sanches, G.M., Paula, M.T.N., Duft, D.G., Vitti, A.C., Kolln, O.T. Data analysis: Sanches, G.M. Design of Methodology: Magalhães, P.S.G., Vitti, A.C. Writing and editing: Sanches, G.M., Magalhães, P.S.G., Duft, D.G., Borges, B.M.M.N., Franco, H.C.J.

References

Aimrun, W.; Amin, M.S.M.; Ahmad, D.; Hanafi, M.M.; Chan, C.S. 2007. Spatial variability of bulk soil electrical conductivity in a Malaysian paddy field: key to soil management. Paddy Water Environment 5: 113-121.

Bronson, K.F.; Booker, J.D.; Officer, S.J.; Lascano, R.J.; Mass, S.J.; Searcy, S.W. 2005. Apparent electrical conductivity, soil properties and spatial covariance in the U.S. southern high plains. Precision Agriculture 6: 297-311.

Cambouris, A.N.; Nolin, M.C.; Zebarth, B.J.; Laverdière, M.R. 2006. Soil management zones delineated by electrical conductivity to characterize spatial and temporal variations in potato yield and in soil properties. American Journal of Potato Research 83: 381-395.

Carroll, Z.; Oliver, M. 2005. Exploring the spatial relations between soil physical properties and apparent electrical conductivity. Geoderma 128: 354-374.

Corwin, D.L.; Lesch S.M. 2003. Application of soil electrical conductivity to precision agriculture: theory, principles, and guidelines. Agronomy Journal 95: 455-471.

Corwin, D.L.; Lesch, S.M. 2005. Apparent soil electrical conductivity measurements in agriculture. Computers and Electronics in Agriculture 46: 11-43.

Costa, M.M.; Queiroz, D.M.; Pinto, F.A.C.; Reis, E.F.; Santos, N.T. 2014. Moisture content effect in the relationship between apparent electrical conductivity and soil attributes. Acta Scientiarum 36: 395-401.

Driemeier, C.E.; Ling, L.Y.; Sanches, G.M.; Pontes, A.O.; Magalhães, P.S.G.; Ferreira, J.E. 2016. A computational environment to support research in sugarcane agriculture. Computers and Electronics in Agriculture 130: 13-19.

Ekwue, E.; Bartholomew, J. 2011. Electrical conductivity of some soils in Trinidad as affected by density, water and peat content. Biosystems Engineering 108: 95-103.

Fortes, R.; Millán, S.; Prieto, M.H.; Campillo, C. 2015. A methodology based on apparent electrical conductivity and guided soil samples to improve irrigation zoning. Precision Agriculture 16: 441-454.

Guo, W.; Maas, S.J.; Bronson, K.F. 2012. Relationship between cotton yield and soil electrical conductivity, topography, and

Landsat imagery.Precision Agriculture 13: 678-692.

Havlin, J.L.; Tisdale, S.L.; Nelson, W.L.; Beaton, J.D. 2013. Soil Fertility and Fertilizers. Pearson, New York, NY, USA. Heil, K.; Schmidhalter, U. 2015. Comparison of the EM38 and

EM38-MK2 electromagnetic induction-based sensors for

spatial soil analysis at field scale.Computers and Electronics

in Agriculture 110: 267-280.

Ismail, S.M.; Ozawa, K. 2007. Improvement of crop yield, soil moisture distribution and water use efficiency in sandy soils by clay application. Applied Clay Science 37: 81-89.

Kitchen, N.R.; Sudduth, K.A.; Drummond, S.T. 1999. Soil electrical conductivity as a crop productivity measure for claypan soils. Journal of Production Agriculture 12: 607-617.

Kühn, J.; Brenning, A.; Wehrhan, M.; Koszinski, S.; Sommer, M. 2008. Interpretation of electrical conductivity patterns by soil properties and geological maps for precision agriculture. Precision Agriculture 10: 490-507.

Landell, M.G.A.; Prado, H.; Vasconcelos, A.C.M.; Perecin, D.; Rossetto, R.; Bidóia, M.A.P.; Silva, M.A.; Xavier, M.A. 2003. Oxisol subsurface chemical attributes related to sugarcane productivity. Scientia Agricola 60: 741-745.

Leite, J.M.; Ciampitti, I.A.; Mariano, E.; Megda, M.X.V.; Trivelin, P.C.O. 2016. Nutrient partitioning and stoichiometry in unburnt sugarcane ratoon at varying yield levels. Frontiers in Plant Science 7: 1-14.

McBratney, A.; Whelan, B.M.; Ancev, T.; Bouma, J. 2005. Future directions of precision agriculture. Precision Agriculture 6: 7-23.

Molin, J.P.; Faulin, G.D.C. 2013. Spatial and temporal variability of soil electrical conductivity related to soil moisture. Scientia Agricola 70: 1-5.

Moral, F.J.; Terrón, J.M.; Silva, J.R.M. 2009. Delineation of management zones using mobile measurements of soil apparent electrical conductivity and multivariate geostatistical techniques. Soil & Tillage Research 106: 335-343.

Pedrera-Parrilla, A.; Vijver, V.E.; Meirvenne, M. 2016. Apparent electrical conductivity measurements in an olive orchard under wet and dry soil conditions: significance for clay and soil water content mapping. Precision Agriculture 17: 531-545.

Peralta, N.R.; Costa, J.L. 2013. Delineation of management zones with soil apparent electrical conductivity to improve nutrient management. Computers and Electronics in Agriculture 99: 218-226.

Prado, H. 2016. Easy Pedology: Application in Tropical Soils = Pedologia Fácil: Aplicação em Solos Tropicais. STAB, Piracicaba, SP, Brazil (in Portuguese).

Reedy, R.C.; Scanlon, B.R. 2003. Soil water content monitoring using electromagnetic induction. Journal of Geotechnical and Geoenvironmental Engineering 129: 1028-1039. Rhoades, D.A.; Dowrick, D.J. 1999. Variability of damage

ratios for property in earthquakes. Earthquake Spectra 15: 297-316.

(8)

Salton, J.C.; Tomazi, M.; Comunello, E.; Zanatta, J.A.; Rabello, L.M. 2011. Electrical conductivity and physical and chemical attributes of an Oxisol after 15 years in management systems in Mato Grosso do Sul state. p. 254-260. In: Inamasu, R.Y.; Naime, J.M.; Resende, A.V.; Bassoi, L.H.; Bernardi, A.C.C., eds. Precision Agriculture: a new look = Agricultura de Precisão: um novo olhar. Embrapa Instrumentação, SP, Brazil (in Portuguese, with abstract in English).

Sana, R.S.; Anghinoni, I.; Brandão, Z.N.; Holzschuh, M.J. 2014. Spatial variability of physical-chemical attributes of soil and its effects on cotton yield. Revista Brasileira de Engenharia Agrícola e Ambiental 18: 994-1002 (in Portuguese, with abstract in English).

Serrano, J.M.; Shahidian, S.; Silva, J.R.M. 2012. Apparent electrical conductivity in dry versus wet soil conditions in a shallow soil. Precision Agriculture 14: 99-114.

Silva, C.B.; Moraes, M.A.F.D.; Molin, J.P. 2011. Adoption and use of precision agriculture technologies in the sugarcane industry

of São Paulo state, Brazil.Precision Agriculture 12: 67-81.

Siqueira, G.M.; Silva, E.F.F.; DaFonte, D.J. 2014. Spatial distribution of soil apparent electrical conductivity measured by electromagnetic induction and sugarcane yield. Bragantia 74: 215-223.

Soil Survey Staff. 2014. Keys to Soil Taxonomy. USDA-Natural Resources Conservation Service, Washington, DC, USA. Sudduth, K.A.; Drummond, S.T.; Kitchen, N.R. 2001. Accuracy

issues in electromagnetic induction sensing of soil electrical conductivity for precision agriculture. Computers and Electronics in Agriculture 31: 239-264.

Sudduth, K.A.; Kitchen, N.R.; Wiebold, W.J.; Batchelor, W.D.; Bollero, G.A.; Bullock, D.G.; Clay, D.E.; Palm, H.L.; Pierce, F.J.; Schuler, R.T.; Thelen, K.D. 2005. Relating apparent electrical conductivity to soil properties across the north-central USA. Computers and Electronics in Agriculture 46: 263-283.

Tarr, A.B.; Moore, J.K.; Bullock, D.G.; Dixon, P.M.; Burras, C.L. 2005. Improving map accuracy of soil variables using soil electrical conductivity as a covariate. Precision Agriculture 6: 255-270.

Valente, D.S.M.; Queiroz, D.M.; Pinto, F.A.C.; Santos, N.T.; Santos, F.L. 2012. The relationship between apparent soil electrical conductivity and soil properties. Revista Ciência Agronômica 43: 683-690.

Imagem

Table 1 – Studies used in the assessment of the ECa potential (in  chronological order) that contemplate the correlation of the soil  apparent electrical conductivity (ECa) with soil attributes and the  equipment used.
Table 2 – Descriptive statistics of soil clay content and apparent  electrical conductivity (ECa) for experimental fields 1 and 2.
Table 3 – Pearson’s correlation coefficient ( r ) between soil attributes and soil apparent electrical conductivity (ECa) for fields 1 and 2.
Figure 4 – Current soil maps pedological classification provided by Mill database (A and B) and the new classification by a targeted sampling (C  and D) according Brazilian Soil Classification System (SiBCS) (Prado, 2016) with USDA Soil Taxonomy (Soil Surv

Referências

Documentos relacionados

Isto pode ser verificado se repararmos que: (a) esta situa as suas componentes e processos no nível individual (i.e. Identidade individual de cada cônjuge), relacional (e.g. papel

A segunda dissertação, defendida por Gerlinde Merklein Weber, em agosto de 1998, intitula-se A Escolarização entre Descendentes Pomeranos em Domingos Martins. Weber

Neste caso particular, foi possível detectar: um sinal de instabilidade (evolução crescente de uma componente de deslocamento de um ponto de referência), identificar a causa

In Brazil, there is a range of methods used for calculating the lime requirement, with emphasis on three methods: i) SMP buffer (Shoemaker et al., 1961), which is based

A motivação de um peregrino para empreender uma viagem de peregrinação é ver e venerar uma relíquia num dado local, uma vez que não há lugar de peregrinação onde não haja

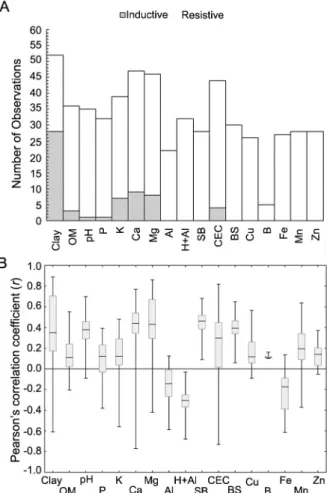
Consequently, the aims of this study are to determine and map the micronutrient content (Cu, Fe, Mn and Zn) of soils in the interior of the State of Ceará; to evaluate soil

The probability of attending school four our group of interest in this region increased by 6.5 percentage points after the expansion of the Bolsa Família program in 2007 and

Foi possível, através deste estudo, traçar o perfil dos estudantes avaliados e identificar diversas questões, como escolha do curso, desistências, transferência para outros