ISSN 1678-992X
ABSTRACT: The knowledge on spatial and temporal variations of soil water storage in the root zone of crops is essential to guide the studies to determine soil water balance, verify the ef-fective zone of water extraction in the soil and indicate the correct region for the management of water, fertilizers and pesticides. The objectives of this study were: (i) to indicate the zones of highest root activity for banana in different development stages; (ii) to determine, inside the zone of highest root activity, the adequate position for the installation of soil moisture sensors. A 5.0 m3 drainage lysimeter was installed in the center of an experimental area of 320 m2. Water extraction was quantified inside the lysimeter using a 72 TDR probe. The concept of time stability was applied to indicate the position for sensor installation within the limits of effective water extraction. There are two patterns of water extraction distribution during the development of banana and the point of installation of sensors for irrigation management inside the zone of highest root activity is not constant along the crop development.
Keywords: soil water storage, irrigation management, water balance
Water extraction and implications on soil moisture sensor placement in
Alisson Jadavi Pereira da Silva1*, Eugênio Ferreira Coelho2, Maurício Antônio Coelho Filho2, José Leonaldo de Souza3
1Federal Institute of Education, Science and Technology of Baiano, Est. da Igara, s/n – 48970-000 – Senhor do Bonfim, BA – Brazil.
2Embrapa Cassava & Tropical Fruits, R. Embrapa, s/n – 44380-000 – Cruz das Almas, BA – Brazil.
3Federal University of Alagoas/Institute of Atmospheric Sciences,Av. Lourival Melo Mota, s/n – 57072-970 – Maceió, AL – Brazil.
*Corresponding author <[email protected]> Edited by: Lincoln Zotarelli
Received August 26, 2016 Accepted January 31, 2017
Introduction
Detailed knowledge on the variation of water stor-age in the volume of soil explored by plant roots is of great importance to guide soil water balance, verify the effective zone of soil water extraction and indicate the soil moisture sensors positioning for irrigation schedule. Soil moisture sensors should be placed in zones of representative root activity, which is dependent upon root water extraction. However, root water extraction may vary in space and time regardless of root concen-tration (Clothier and Green, 1994; Silva et al., 2009; Javaux et al., 2008; Raza et al., 2013). This variability has been studied by Silva et al. (2015) for banana crop and the authors reported that it is necessary at least 16 time domain reflectometry (TDR) probes to be installed at a minimum distance from plant of 0.9 m and a mini-mum soil depth of 0.7 m to prevent an overestimation of banana crop evapotranspiration. Soulis et al. (2015) used several numerical experiments and investigated the effect of soil moisture sensors positioning on irriga-tion efficiency, revealing that irrigairriga-tion efficiency var-ied considerably among the different sensor positions investigated. Thus, the knowledge on variability in wa-ter extraction can decrease reliability of soil wawa-ter bal-ance; therefore, it is necessary to define the placement of soil water sensors in the root zone for reliable mea-surements of soil moisture, even under variable root water extraction variations. In a recent study, Soulis and Elmaloglou (2016) introduced the concept of time stable representative positions (TSRPs) and indicated a considerable variability in the representativeness of sensor readings according to their placement as well as their representativeness system configuration and me-teorological conditions.
the root zone of banana
This work aims to improve sensor placement rec-ommendations for irrigation scheduling purposes, even under spatial and temporal soil water extraction vari-ability during a crop cycle. The proposed approach is based upon water extraction from soil profile. The ef-forts related to field studies on the characterization of water extraction by banana are justified because this crop is an important agricultural commodity for many developing countries (Ding et al., 2013) and is highly de-manding of water (Akinro et al., 2012) and fertilization (Nomura et al., 2016).
Materials and Methods
The experiment was carried out in the field, in the municipality of Cruz das Almas, BA, Brazil (12°48’ S; 39°06’ W; 225 m asl). The data were obtained from the same experiment in study of Silva et al. (2015). Thus, edaphoclimatic conditions, lysimeter installation and assembly, construction and installation of TDR probes, soil water content monitoring, irrigation system and management, planting and cultivation practices of the banana crop, and experimental period are the same as those used in the study previously mentioned.
A 5.0 m3 drainage lysimeter (2.0 m wide; 2.5 m
long; 1.0 m deep) was installed in the center of an ex-perimental area of 320 m2. In order to induce a
free-drainage system in the lysimeter, the last 0.2 m of the profile was divided into two layers of 0.1 m. The lower layer was composed of a drainage system, using per-forated PVC tubes with 50 mm of diameter and gravel (nº 0), while the upper layer was composed of washed sand. Banana seedlings were transplanted to the ex-perimental area and one was cultivated in the drainage lysimeter.
Agricultural Engineering
|
Resear
ch Ar
Soil moisture was monitored inside the lysimeter using a 72 TDR probe and distributed into four profiles (Pi) inside the lysimeter, identified as P1, P2, P3 and P4 (Figure 1). In each profile, monitoring positions in relation to the distance from the plant (Ri) and to the soil depth (Zi) were assigned. The Ri positions were: 0.3 m, 0.5 m, 0.7 m, 0.9 m and 1.1 m. The Zi positions were: 0.1 m, 0.3 m, 0.5 m and 0.7 m. For two of the four profiles, the values of the last position (R = 1.1 m) were obtained through the Krig-ing process, usKrig-ing the data obtained in the entire profile.
Water extraction (WE) in the banana root zone was quantified using Equation 1, applied to a region of inter-est in the profile (Ri,Zi):
WE
z dz z dz
i
i t i t
z z z z i n n = − + =
∫
∫
∑
θ( ) 1 θ( )21 5
0
0 (1)
where: WE is the value of soil water extraction in a re-gion of interest in the profile (Ri,Zi) – cm3 cm–3 (for
in-stance, when i = 1 until 2, soil moisture data of two monitoring positions were used: R = 0.3 m and 0.5 m; but when i = 1 until 5, soil moisture data of five moni-toring positions were used: R = 0.3 m, 0.5 m, 0.7 m, 0.9 m and 1.1 m); θt+1 is the volumetric water content 8 h after irrigation started, at one monitoring point of the profile (Ri,Zi); θt2 is the volumetric water content imme-diately before the next irrigation at one monitoring point in the profile (Ri,Zi); R and Z are the limits of distance and depth, respectively.
The relationship between water extraction and available water content was determined. For that, the percentage of water available in the soil (AW(RiZi)) 8 h af-ter the irrigation was deaf-termined for each monitoring point, based on the soil moisture value at soil field ca-pacity (θfc), permanent wilting point (θpwp) and at the mo-ment of the reading (θ (RiZi)), using Equation 2:
AWR Z
R Z pwp
fc pwp i i i i ( ) ( ) , , = − − θ θ
θ θ (2)
The normalized AW data obtained in each moni-toring position in relation to the total water extraction in the four profiles was verified according to the methodol-ogy proposed by Jones (1969). In order to verify differ-ences between the water extraction percentages at the different monitoring points of the profiles, the Kruskal-Wallis test was used when the data did not follow nor-mal distribution and the F test (Fisher) was used when the data followed normal distribution, in the four pheno-logical stages of banana.
The differences (Δ(RiZi)j) between an individual deter-mination of water extraction WE at location RiZi at time j
(crop development stage) and the mean water extraction
WEj at the same time, were determined as follows:
∆(RiZi j) =WE(RiZi)−WE (3)
where:
WE N WERiZi
i N =
(
)
=∑
1 1/ ( ) (4)
Ntotal = 24 and N at each development stage = 6. Therefore, as proposed by Vachaud et al. (1985), it was possible to calculate the relative differences (δ(RiZi)j) for the mean value of the entire profile and the specific values of water extraction of each monitoring point:
δ( )
( ) R Z ji i
RiZi j
WE
= ∆
(5)
After the effective limits of water extraction in the root zone were defined, the recommendation for sensor positioning, within these limits, was based on the δ(R Z ji i)
values. The δ(R Zi i)values obtained in each development
stage are ranked from the smallest to the largest. For instance, if δ(R Zi i)> 0, it overestimates and if δ(R Zi i)< 0,
it underestimates WE.
Results and Discussion
Definition of the effective water extraction zones for the banana crop
The percent distribution of water extraction of ba-nana in relation to the distance (R) was equal in the four monitoring profiles, at 5 % of significance (Table 1). The equality was confirmed in the four development stages and the means obtained in the four profiles were pre-sented in Figures 2A and B. Low deviations around the
Figure 1 – Distribution of TDR probes inside the lysimeter. Source:
mean values of the monitoring points were observed in the four crop development stages, which confirms the similarity between the water extraction values in the four monitored profiles.
The percent distribution of water extraction at dis-tances (R) in the profiles showed the same behavior in the first two development stages of the banana crop (Figure 2B). The relationship between the percent fractions of soil water extraction and the different distances (R) was also similar for the last two development stages. These similari-ties allowed establishing two patterns of soil water extrac-tion distribuextrac-tion in relaextrac-tion to the distance (R) for the entire development of the banana crop. The first pattern charac-terizes the initial and vegetative growth stages, when the effective water extraction occurs up to the distance of 0.7 m from the plant, and the second pattern characterizes the stages of flowering and fruit growth, when the effective extraction occurs up to 0.9 m from the plant (Figure 2B).
The percent fractions of soil water extraction in re-lation to depth (Z) were not different due to the different profiles of soil moisture monitoring (Table 1). The only exception was observed in the vegetative growth stage, in one of the four soil profiles, and only for depths z = 0.1 m and z = 0.5 m, where the highest mean deviations were also observed (Figure 2A). This fact should be re-lated to a higher growth rate of banana roots at this stage (Silva et al., 2015).
Table 1 – Means of percent water extraction obtained at different monitoring points of four profiles in the root zone of the banana crop.
R x̅P1 x̅P2 x̅P3 x̅P4 Z x̅P1 x̅P2 x̅P3 x̅P4
m m
Initial
0.3 37.83 27.59 40.05 28.04 0.1 57.51 50.05 48.90 46.87
0.5 30.14 24.96 21.34 34.30 0.3 31.39 30.95 38.74 29.59
0.7 22.36 28.75 20.33 25.43 0.5 10.56 13.14 11.39 22.36
0.9 7.29 14.66 12.57 15.55 0.7 0.48 5.84 0.95 1.15
1.1 2.33 5.51 5.69 4.64
Vegetative Growth
0.3 30.35 24.77 34.79 32.85 0.1 80.48 b 68.23 ab 73.37 b 50.39 a
0.5 28.21 24.77 27.36 25.60 0.3 12.98 13.35 8.15 22.94
0.7 25.19 26.51 19.20 15.49 0.5 6.47 a 11.22 ab 14.72 ab 21.55 b
0.9 8.42 14.36 11.01 12.97 0.7 0.04 7.18 3.75 5.10
1.1 7.80 9.58 7.62 13.06
Flowering
0.3 21.23 22.92 28.64 27.44 0.1 39.14 32.71 40.76 48.76
0.5 25.13 30.02 24.01 22.58 0.3 36.32 33.42 29.68 30.11
0.7 15.67 18.81 14.35 14.39 0.5 20.62 19.80 15.80 15.39
0.9 26.59 14.29 18.21 17.91 0.7 3.90 14.05 14.07 5.72
1.1 11.36 13.92 14.77 17.65
Fruit Growth
0.3 35.52 32.28 30.73 20.08 0.1 40.88 37.33 28.29 46.62
0.5 15.84 19.55 19.25 14.28 0.3 29.51 30.45 36.50 28.34
0.7 20.97 17.40 18.05 21.07 0.5 19.39 23.00 19.22 21.44
0.9 13.89 14.82 16.70 20.27 0.7 10.19 9.20 13.47 11.07
1.1 13.76 15.92 15.24 24.28
Values followed by different letters in the rows differ significantly by Kruskal-Wallis test, p = 0.05; x̅P1 Means of percent water extraction obtained at profile 1; x̅P2
Means of percent water extraction obtained at profile 2; x̅P3 Means of percent water extraction obtained at profile 3; x̅P4 Means of percent water extraction obtained
at profile 4.
Figure 2 – Cumulative percentages of water extraction of banana
roots (Steudle and Frensch, 1996; Barrowclough et al., 2000; Watt et al., 2008; Draye et al., 2010).
The association between the variability of water extraction in the root zone of banana and the variabil-ity in soil water availabilvariabil-ity is shown in Figure 3. It is observed that, for the case of banana, there was not a well-defined relationship between the variabilities in the distribution of available water and in water extraction in the soil region explored by the roots. Even with low vari-ability in soil water distribution, the varivari-ability in water extraction of the banana crop was high.
The existence of variability in water extraction within the limits of maximum distance and depth of ef-fective water extraction for the banana crop makes it difficult to recommend precisely the position for the in-stallation of soil moisture sensors within the limits of effective water extraction. As reported by Soulis and El-maoglou (2016), there was a considerable variability in the representativeness of the sensor readings according to their placement in the root zone. Therefore, to indi-cate precisely the position for sensor installation within the limits of effective distance and depth shown in Table 2, the relative differences of water extraction values ob-tained at each specific monitoring point in relation to the mean value for the entire profile were calculated. The results are shown in Figures 4A, B, C and D, where relative differences (δij) were arranged in the ascending order. The deviations associated with each isolated posi-tion (RiZi) showed that temporal variations were lower than spatial variations.
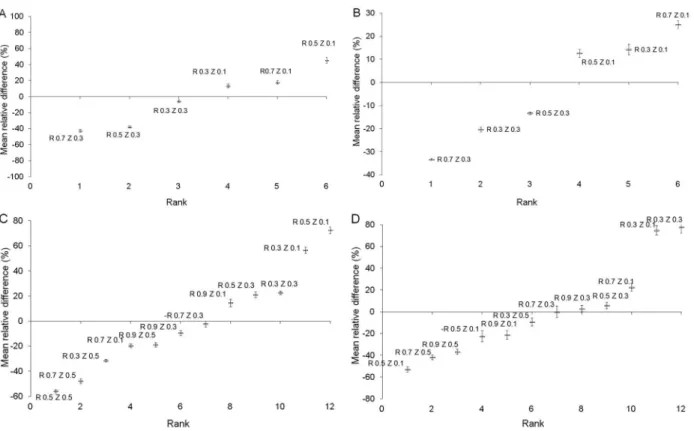
In the initial crop stage, the water extraction ob-tained at point R0.3Z0.3 was 6 % lower than the mean for the entire profile (Figure 4A), while the water extraction obtained at point R0.7Z0.3 for the same stage was 43 % lower than the mean for the profile. Therefore, R0.7Z0.3
was not adequate for the installation of soil moisture sensors for the initial stage of the banana crop. The dif-ferences in the deviations of each specific point (RiZi) indicated a great variation in irrigation depth required when the calculation was performed based on soil mois-ture data obtained from the different soil moismois-ture sen-Regarding the percent distribution of water
ex-traction relative to soil depth, two patterns of soil water extraction distribution were also observed during the de-velopment of the banana crop. The first pattern charac-terizes the initial and vegetative growth stages, when the effective water extraction occurs up to depth of 0.3 m. The second pattern characterizes the stages of flowering and fruit growth, when the effective water extraction reaches the depth of 0.4 m (Figure 2A).
The effective depths and distances of water extrac-tion in the different development stages of banana are shown in Table 2. Silva et al. (2012) reported that ef-fective water extraction of banana occurred up to the distance of 0.7 m, 0.8 m and 1 m, when plants were ir-rigated with one sprinkler of 32 L h–1 for four plants, one
sprinkler of 60 L h–1 for four plants and one sprinkler of
60 L h–1 for two plants, respectively. For all the systems,
the limit of effective depth was 0.25 m.
Recommendations for sensor positioning within the effective water extraction zones of the banana crop
In the attempt to explain the causes of variation in soil water extraction by plants, there are many hy-potheses in the literature. For instance, Atkinson (1981) claimed that the distribution of thin roots reflects the water extraction potential of a crop. On the other hand, Nnyamah and Black (1977) claimed that the water ex-traction pattern of a crop was similar to the distribu-tion of thin roots when the soil water was not limiting. However, Green and Clothier (1995) studied water ex-traction of kiwifruit vines and observed that root water uptake was more dependent on soil water availability than of thin roots distribution. Yet, there are other stud-ies indicating that the diameter of lateral roots was also a highly variable factor in the soil (Yorke and Sagar, 1970; Cahn et al., 1989; Varney et al., 1993; Jordan et al., 1993; Thaler and Pagès, 1996). In addition, Lecompte et al. (2005) report that this variability was a consequence of factors like soil heterogeneity, root system structure, and availability and partitioning of carbon in the roots, but the relative contribution of each of these factors remain largely unknown. Other factors have been shown to in-fluence water extraction by roots, such as differences in xylem maturation and in the number and diameter of xylem vessels, as well as differences in the formation of endodermis and exodermis with the development of
Table 2 – Limits of maximum distance and depth of effective water
extraction in different development stages of the banana crop. Development
stages
Maximum distance from
the pseudostem Maximum depth --- m
---Initial 0.7 0.3
Vegetative Growth 0.7 0.3
Flowering 0.9 0.4
Fruit Growth 0.9 0.4
Figure 3 – Relationships between the variations in soil water
sors positions. The results obtained by Soulis et al. (2015) indicated that irrigation efficiency variation among the different soil moisture sensors positions was greater than the variation among the various irrigation system configurations.
For practical purposes, there are specific points for soil moisture sensor installation within the limits of effective water extraction at which soil moisture sensors can be installed. However, these points are not constant along the development of the banana crop. Following the criterion of minimizing the relative differences be-tween the water extraction obtained at a specific point and the mean value for the entire profile, the minimum value of δij was obtained at R0.5Z0.3 for the vegetative growth stage (Figure 4B). For the flowering and fruit growth stages, the obtained values of δij, indicating that the sensors should be installed at the position R0.7Z0.3
(Figures 4C and D).
Figure 5 shows the comparison of the cumulative deviation between soil water storage values measured at isolated points within the limits of water extraction. The daily mean error in the calculation of soil water storage variation in the effective zone of water extrac-tion of the banana crop can vary from ± 2.38 mm to ± 6.09 mm, depending on the position of installation of soil moisture sensors. Thus, it is proposed that the mod-ification of soil moisture sensor position based on the
Figure 4 – Order of relative differences δ(RnZn)j, (%), between each individual value of water extraction calculated for one specific point WE(RiZi) and the mean of water extraction values obtained in the entire profile. The deviations refer to the time (j). Initial – A; Vegetative Growth – B; Flowering – C; Fruit Growth – D.
Figure 5 – Cumulative distribution of absolute errors in the
calculation of storage variation (Δh) at different points (RnZn) of installation of sensors within the limits of effective water extraction of the banana crop.
ap-proaches proposed here require a substantial number of sensors installed at the root zone and depends upon sufficient field observation. However, it is the purpose of this paper to introduce a method to reduce the num-ber of sensors installed to characterize the behavior to root water extraction.
Conclusions
The results of this study indicated the existence of a great variability in soil water extraction by the banana crop in different development stages, which requires the development of recommendations for the soil moisture sensor probe positioning to determine adequate irriga-tion scheduling. The concept of time stability has been applied in order to indicate the position for sensor instal-lation within the limits of effective water extraction.
Two patterns of soil water extraction during the development of banana were identified. The first one characterized the initial and vegetative growth stages, when the effective water extraction occurred within a 0.7 m radius from the plant at a soil depth of 0.3 m. The second pattern was characterized for crop stages of flowering and fruit growth, when the effective water extraction occurred within 0.9 m from the plant and at soil depth of 0.4 m. Therefore, for banana crop, the posi-tion of installaposi-tion of sensors for irrigaposi-tion management within the zone of highest root activity should be vari-able throughout the development of the banana crop.
This recommendation is a step towards a meth-odology to reduce a large measurement network previ-ously required to few representative locations of mean root water extraction. Similar studies considering a vari-able placement of soil moisture sensors for other soil conditions, crops, climates, irrigation systems and soil moisture sensor devices are needed to completely vali-date the concept applied.
Acknowledgments
To editor and three anonymous reviewers for their constructive comments and suggestions, allowing us to improve the final version of the paper.
References
Akinro, A.O.; Olufayo, A.A.; Oguntunde, P.G. 2012. Crop water productivity of plantain (Musa sp.) in a humid tropical environment. Journal of Engineering Science and Technology Review 5: 19-25.
Atkinson, D. 1981. The distribution and effectiveness of the roots of tree crops. Horticultural Reviews 2: 424-490.
Barrowclough, D.E.; Peterson C.A.; Steudle, E. 2000. Radial hydraulic conductivity along developing onion roots. Journal of Experimental Botany 51: 547-557.
Cahn, M.D.; Zobel, R.W.; Bouldin, D.R. 1989. Relationship between root elongation rate and diameter and duration of growth of lateral roots of maize. Plant and Soil 119: 271-279.
Clothier, B.E.; Green, S.R. 1994. Rootzone processes and the efficient use of irrigation water. Agricultural Water Management 25: 1-12.
Coelho, E.F.; Or, D. 1996. A parametric model for two-dimensional water uptake intensity by corn roots under drip irrigation. Soil Science Society America Journal 60: 1039-1049.
Ding, Z.; Wen, Z.; Wu, R.; Li, Z.; Zhu, J.; Li, W.; Jian, M. 2013. Surface energy balance measurements over a banana plantation in South China. Theoretical Applied Climatology 114: 349-363.
Draye, X.; Kim, Y.; Lobet, G.; Javaux, M. 2010. Model-assisted integration of physiological and environmental constraints affecting the dynamic and spatial patterns of root water uptake from soils. Journal of Experimental Botany 61: 2145-2155. Gao, Y.; Duan, A.; Qiu, X.; Liu, Z.; Sun, J.; Zhang, J.; Wang,
H. 2010. Distribution of roots and root length density in a maize/soybean strip intercropping system. Agricultural Water Management 98: 199-212.
Green, S.R.; Clothier, B.E. 1995. Root water uptake by kiwifruit vines following partial wetting of the root zone. Plant and Soil 173: 317-328.
Javaux, M.; Schroder, T.; Vanderborght, J.; Vereecken, H. 2008. Use of a three-dimensional detailed modeling approach for predicting root water uptake. Vadose Zone Journal 7: 1079-1088.
Jones, T.A. 1969. Skewness and kurtosis as criteria of normality in observed frequency distribuitions. Journal Sedimentary Petrology 39: 1622-1627.
Jordan, M.O.; Harada, J.; Bruchou, C.; Yamazaki, K. 1993. Maize nodal root ramification: absence of dormant primordia, root classification using histological parameters and consequences on sap conduction. Plant and Soil 153: 125-143.
Lecompte, F.; Pagès, L.; Lafontaine, H.O. 2005. Patterns of variability in the diameter of lateral roots in the banana root system. New Phytologist 167: 841- 850.
Nnyamah, J.U.; Black, T.A. 1977. Rates and patterns of water uptake in a Douglas fir forest. Soil Science Society of America 41: 972-979.
Nomura, E.S.; Cuquel, F.L.; Damatto Junior, E.R.; Fuzitani, E.J.; Borges, A.L.; Saes, L.A. 2016. Nitrogen and potassium fertilization on ‘Caipira’ and ‘BRS Princesa’ bananas in the Ribeira Valley. Revista Brasileira de Engenharia Agrícola e Ambiental 20: 702-708.
Raza, A.; Friedel, J.K.; Moghaddam, A.; Ardakani, M.R.; Loiskandl, W.; Himmelbauer, M.; Bodner, G. 2013. Modeling growth of different lucerne cultivars and their effect on soil water dynamics. Agricultural Water Management 119: 100-110.
Silva, A.J.P.; Coelho, E.F.; Miranda, J.H.; Workman, S.R. 2009. Estimating water application efficiency for drip irrigation emitter patterns on banana. Pesquisa Agropecuária Brasileira 44: 730- 737.
Silva, A.J.P.; Coelho, E.F.; Miranda, J.H. 2012. Sensor placement for irrigation scheduling in banana using micro-sprinkler system. Water Resources and Irrigation Management 1: 15-23. Silva, A.J.P.; Coelho, E.F.; Coelho Filho, M.A. 2015. Water
Sokalska, D.I.; Haman, D.Z.; Szewczuk, A.; Sobota, J.; Deren, D. 2009. Spatial root distribution of mature Apple trees under drip irrigation system. Agricultural Water Management 96: 917-924.
Soulis, K.X.; Elmaloglou, S.; Dercas, N. 2015. Investigating the effects of soil moisture sensors positioning and accuracy on soil moisture based drip irrigation scheduling system. Agricultural Water Management 148: 258-268.
Soulis, K.X.; Elmaloglou, S. 2016. Optimum soil water content sensors placement in drip irrigation scheduling systems: concept of time stable representative positions. Journal Irrigation and Drainage Engineering 142: DOI: 10.1061/(ASCE) IR.1943-4774.0001093
Steudle, E.; Frensch, J. 1996. Water transport in plants: role of the apoplast. Plant and Soil 187: 67-79.
Thaler, P.; Pagès, L. 1996. Periodicity in the development of the root system of young rubber trees (Hevea brasiliensis Müell. Arg.): relationship with shoot development. Plant, Cell & Environment 19: 59-64.
Vachaud, G.; Silans, A.P.; Balabanis, P.; Vauclin, M. 1985. Temporal stability of spatial measured soil water probability density function. Soil Science Society American Journal 49: 822-828.
Varney, G.T.; Canny, M.J. 1993. Rates of water uptake into the mature root system of maize plants. New Phytologist 123: 775-786.
Watt, M.; Magee, L.J.; Mccully, M.E. 2008. Types, structure and potential for axial water flow in the deepest roots of field-grown cereals. New Phytologist 178: 135-146.
Yorke, J.S.; Sagar, G.R. 1970. Distribution of secondary root growth potential in the root system of Pisum sativum. Canadian Journal of Botany 48: 699-704.
Zarebanadkouki, M.; Kim, Y.X.; Moradi, A.B.; Vogel, H.J.; Kaesther, A.; Carminati, A. 2012. Quantification and modeling of local root water uptake using neutron radiography and deuterated water. Vadose Zone Journal. DOI: 10.2136/ vzj2011.0196