Spreading depression is facilitated
in adult rats previously submitted to
short episodes of malnutrition during
the lactation period
Departamento de Nutrição, Universidade Federal de Pernambuco, 50670-901 Recife, PE, Brasil
A.P. Rocha-de-Melo and R.C.A. Guedes
Abstract
Lactating rat dams were submitted to short episodes (1, 2 or 3 weeks) of nutritional restriction by receiving the “regional basic diet” (RBD, with 8% protein) of low-income human populations of Northeast Brazil. Their pups were then studied regarding the developmental effects on body and brain weights. When the rats reached adulthood, cortical susceptibility to the phenomenon of spreading depression (SD) was evaluated by performing electrophysiological recordings on the surface of the cerebral cortex. SD was elicited at 20-min intervals by applying 2% KCl for 1 min to a site on the frontal cortex and its occurrence was monitored at 2 sites in the parietal region by recording the electrocorticogram and the slow potential change of SD. When compared to control rats fed a commercial diet with 23% protein, early malnourished rats showed deficits in body and brain weights (10% to 60% and 3% to 15%, respectively), as well as increases in velocity of SD propagation (10% to 20%). These effects were directly related to the duration of maternal dietary restriction, with pups malnourished for 2 or 3 weeks presenting more intense weight and SD changes than those malnourished for 1 week. The effects of 1-week restrictions on SD were less evident in the pups malnourished during the second week of lactation and were more evident in pups receiving the RBD during the third week. The results indicate that short episodes of early malnutrition during the suckling period can affect body and brain development, as well as the cortical susceptibility to SD during adulthood. The data also suggest that the third week of lactation is the period during which the brain is most sensitive to malnutrition, concern-ing the effects on SD.
Correspondence R.C.A. Guedes
Departamento de Nutrição Universidade Federal de Pernambuco 50670-901 Recife, PE
Brasil
Research supported by CAPES and FACEPE (No. 0782-4.05/93). R.C.A. Guedes is the recipient of a CNPq fellowship (No. 52.1706/94). This work is part of a Masters thesis presented by A.P. Rocha-de-Melo to the Departamento de Nutrição, Universidade Federal de Pernambuco.
Received February 22, 1996 Accepted February 14, 1997
Key words
•Early protein malnutrition •Spreading depression •Brain growth spurt period
Introduction
Several effects of malnutrition on neural structure and function have been described in human beings, as well as in laboratory animals (1-3). These effects are more severe when nutritional deficiency occurs during
this critical period of intense development of the nervous system occurs at different time points early in life. In the rat, this period corresponds to the first 3 weeks of postnatal life, i.e., the lactation period (4). An inad-equate diet imposed on the dams throughout this period can cause nutritional deficiency in the offspring and the effects of this condi-tion on the nervous system will depend on the severity and duration of malnutrition (5). Like other conditions that change brain excitability, early malnutrition also influ-ences the phenomenon of spreading depres-sion (SD) of cerebral electrical activity in adult rats (6,7). SD has been initially charac-terized as a decrease of spontaneous electri-cal activity of the cerebral cortex in response to electrical, chemical or mechanical stimu-lation of one point on the surface of the tissue (8). The “wave” of depression of elec-trical activity spreads concenelec-trically from the stimulated point, while the originally depressed region starts to recover. Usually, a depressed area takes about 5-10 min to re-cover completely (8-10). Previous data from our laboratory have shown a facilitatory ef-fect on brain susceptibility to SD in adult rats submitted to malnutrition during the gesta-tion + suckling period (7,11-13).
During the brain growth spurt period, however, distinct developmental processes (for example, neurogenesis, gliogenesis and myelination) present peaks of maximal in-tensity at different time points, depending on the brain region to be considered. Thus, it is possible that short episodes of malnutrition acting at a certain time point during the lactation period may affect some neural struc-tures and processes more effectively than others (3,5,14). Since, to our knowledge, there are no systematic studies investigating this possibility concerning the SD phenome-non, the present study was undertaken to address this issue. Our data show that short episodes of maternal malnutrition (1 or 2 weeks) during the lactation period followed by nutritional rehabilitation can induce
changes in body and brain development in the pups, as well as long-lasting alterations in the cortical susceptibility to SD, evaluated when the pups become adults.
Material and Methods
The experiments were performed on 166 Wistar rat pups of both sexes, obtained from 33 litters (6-8 pups per litter). Short episodes of malnutrition during the lactation period were provoked by feeding the dams a diet prepared with the foodstuffs that constitute the daily fare of low-income human popula-tions in the Northeast of Brazil, the so-called “regional basic diet” (RBD), containing 8% protein and 315.6 kcal% (i.e., 100 g of the diet provides 315.6 kcal) (11,12,15). Ac-cording to the weeks of lactation during which malnutrition was imposed on the dams, 5 groups of pups were obtained, as follows: 3 groups of pups whose dams received the RBD for one week during the lactation pe-riod: during the first (group 1; N = 13; 6 males), second (group 2; N = 17; 8 males) or third (group 3; N = 15; 7 males) week of lactation; 2 groups of pups whose dams re-ceived the RBD for two weeks during the lactation period: either during the first plus second (group 1+2; N = 12; 7 males) or second plus third (group 2+3; N = 8; 4 males) week of lactation. After weaning, pups were fed a commercial diet (Anderson Clayton do Brasil) with 23% protein and 299.5 kcal% until adulthood.
During treatment with the RBD, half of the pups in each group were separated (S) daily from the mother for 2 to 8 h according to age, as described by Abel (2), to provoke a more severe restriction of food intake in these new-borns at that respective time point. These pups were used to form five additional groups called 1S (N = 18; 8 males), 2S (N = 16; 7 males), 3S (N = 12; 8 males), 1+2S (N = 9; 3 males) and 2+3S (N = 10; 8 males), respectively.
separated from the mothers: control group (N = 19; 9 males) consisting of pups whose dams received the commercial diet, and LP group (N = 17; 9 males) consisting of pups whose dams were fed the RBD throughout the lactation period. The animals were weighed on postnatal days 3, 7, 10, 14, 17, 21, 30, 60 and 90.
When the pups became adults (90-110 days) the phenomenon of SD was recorded continuously for 3 h according to the follow-ing protocol: under anesthesia with 1g/kg urethane plus 40 mg/kg chloralose, ip, two trephine holes (3 mm in diameter) were drilled into the right parietal bone. The spon-taneous cortical electrical activity (ECoG) and the slow potential change accompany-ing SD were recorded simultaneously at these 2 points on the cortical surface using Ag-AgCl agar-Ringer electrodes (1 mm tip di-ameter; one electrode in each hole). A com-mon reference electrode of the same type was placed on the nasal bones. SD was elic-ited at 20-min intervals through a third hole (2 mm in diameter) drilled into the right frontal bone by applying a small cotton pledget (1-2 mm in diameter) soaked in 2% KCl solution for 1 min. The three holes were aligned in the anteroposterior direction and parallel to the midline. The velocity of SD propagation was calculated based on the time required for an SD wave to cross the distance (range: 3.8 to 4.2 mm) between the 2 recording electrodes. During the re-cording session, which lasted 3 h, rectal temperature was maintained at 37 ± 1oC by
means of a heating blanket. At the end of the session, the animal was killed with an overdose of anesthetic and the brain (includ-ing the cerebellum and exclud(includ-ing the olfac-tory bulb) was immediately removed and weighed (wet weight). The brain was then kept at 100oC and weighed daily until it
reached a constant weight (dry weight). Sta-tistical analysis was performed using ANOVA followed by post hoc tests when indicated.
Results
Body and brain weights
The pups submitted to short episodes of early nutritional restriction gained less weight than the controls. From the respective re-striction period up to 30 days of life, the body weights of all malnourished groups were significantly lower than those of the control group. At 90 days, the differences in body weights were still significant in groups 2, 2S, 1+2, 1+2S, 2+3, 2+3S and LP as compared to the control. The following S-groups (which suffered separation from the dams during the lactation period) displayed significant reductions in body weight, as compared to the corresponding group which was not separated from the respective dams: group 1S differed from group 1 from day 7 to day 17 of life; group 2S differed from group 2 from day 10 to 30; group 3S differed from group 3 from day 17 to 21; group 1+2S differed from group 1+2 from day 10 to 30, and group 2+3S differed from group 2+3 from day 14 to 30. ANOVA provided the following F(11,154) values: 2.25 at day 3; 21.52 at day 7; 30.71 at day 10; 76.05 at day 14; 70.99 at day 21; 26.47 at day 30; 4.70 at day 60 and 2.97 at day 90. Data on body weights are shown in Table 1.
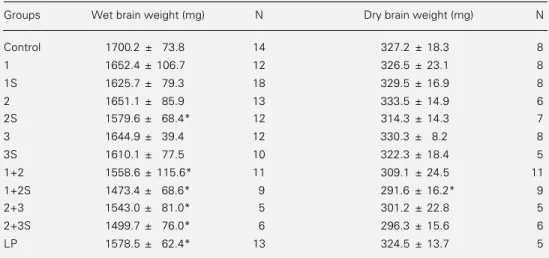
At 90-110 days, the wet brain weights of the following early malnourished groups were significantly lower than the control: 2S, 1+2, 1+2S, 2+3, 2+3S and LP (F(11,124) = 6.98, P<0.05). The dry brain weights were signif-icantly lower in group 1+2S (F(11,73) = 4.58, P<0.05). Mean values for brain weights are shown in Table 2.
Velocity of SD propagation
Table 1 - Effect of short episodes of malnutrition early in life on body weight (g) of rats at different ages.
Data are reported as mean ± SD with the number of measurements given in parentheses. Malnutrition was produced by feeding the dams the regional basic diet (RBD) of low-income human populations of Northeast Brazil (containing 8% protein) during the first (group 1), second (group 2), third (group 3), first+second (group 1+2) or second+third (group 2+3) week of lactation or throughout the lactation period (group LP). Groups marked with the letter S had suffered an additional restriction consisting of daily separation from the dams during the week when the dams received the protein-deficient diet. A control group (C) fed a commercial diet with 23% protein was used for comparison. *P<0.05 compared to the respective control values (ANOVA followed by the Dunnett test). aP<0.05 compared to the corresponding group which did not suffer separation from the dam (ANOVA followed by the Duncan test).
Group Body weight (g)
3 days 7 days 10 days 14 days 17 days 21 days 30 days 60 days 90 days
C (19) 9.04 ± 1.26 14.52 ± 2.16 19.51 ± 2.98 26.01 ± 3.65 29.96 ± 3.65 40.21 ± 5.30 74.09 ± 10.68 184.75 ± 35.87 247.64 ± 55.62
1 (13) 8.28 ± 0.85* 10.86 ± 1.02* 15.07 ± 2.07* 20.60 ± 1.34* 26.08 ± 1.93* 36.35 ± 2.97* 60.30 ± 7.50* 156.78 ± 34.94* 231.68 ± 7.54
1S (18) 8.03 ± 0.85* 9.32 ± 0.93*a 13.49 ± 1.64*a 18.74 ± 1.63*a 24.16 ± 2.36*a 34.28 ± 3.85* 58.64 ± 9.50* 157.59 ± 43.59* 225.68 ± 58.61
2 (17) 8.25 ± 0.77 12.28 ± 1.61 15.65 ± 1.84* 17.16 ± 1.87* 20.03 ± 1.91* 27.31 ± 3.05* 56.58 ± 6.03* 164.91 ± 24.33* 217.57 ± 47.14*
2S (16) 8.43 ± 0.92 12.86 ± 1.64 13.86 ± 1.76*a 14.44 ± 2.01*a 16.65 ± 2.10*a 23.42 ± 3.66*a 49.99 ± 7.09*a 158.06 ± 23.78* 207.21 ± 46.29*
3 (15) 8.32 ± 0.64 12.90 ± 1.38 17.09 ± 1.75 23.16 ± 1.87 25.63 ± 2.22* 29.73 ± 3.61* 60.77 ± 5.83* 171.66 ± 24.10 220.95 ± 39.44
3S (12) 8.13 ± 0.95 12.74 ± 1.42 17.32 ± 1.32 23.16 ± 1.93 23.56 ± 1.68*a 26.86 ± 2.12*a 58.41 ± 4.66* 177.62 ± 25.70 223.85 ± 33.47
1+2 (12) 7.92 ± 1.08* 9.98 ± 1.43* 11.36 ± 1.76* 12.93 ± 1.67* 15.51 ± 1.88* 22.86 ± 2.63* 50.11 ± 5.20* 151.33 ± 21.62* 208.92 ± 38.46*
1+2S (9) 7.77 ± 0.77* 9.06 ± 0.95* 9.44 ± 1.26*a 10.22 ± 1.42*a 12.46 ± 2.33*a 18.18 ± 3.16*a 41.83 ± 8.25*a 127.81 ± 15.53* 174.66 ± 37.54*
2+3 (8) 8.66 ± 0.62 12.94 ± 1.55 15.55 ± 1.59* 17.64 ± 1.66* 19.04 ± 1.93* 23.08 ± 2.50* 51.21 ± 1.93* 151.68 ± 25.81* 181.79 ± 40.11*
2+3S (10) 8.79 ± 1.02 14.44 ± 1.70 15.38 ± 1.24* 15.15 ± 1.24*a 15.32 ± 1.10*a 18.27 ± 2.05*a 43.39 ± 3.37*a 151.00 ± 19.09* 192.04 ± 27.97*
LP (17) 8.08 ± 0.85* 10.68 ± 1.18* 12.24 ± 1.30* 13.80 ± 1.66* 14.14 ± 2.22* 17.11 ± 2.68* 42.58 ± 5.35* 134.99 ± 8.51* 191.25 ± 24.26*
Table 2 - Effect of short episodes of malnutrition early in life on brain weight (mg) of adult rats.
Data are reported as mean ± SD. Malnutrition was produced by feeding the dams the regional basic diet (RBD) of low-income human populations of Northeast Brazil (containing 8% protein) during the first (group 1), second (group 2), third (group 3), the first+second (group 1+2) or the second+third (group 2+3) week of the lactation period, or throughout lactation (group LP). Groups marked with the letter S had suffered an additional restriction consisting of daily separation of the pups from the dams during the week when the dams received the protein-deficient diet. A control group fed a commercial diet with 23% protein was used for comparison. N = Number of measurements. *P<0.05 compared to the respective control values (ANOVA followed by the Tukey test).
Groups Wet brain weight (mg) N Dry brain weight (mg) N
Control 1700.2 ± 73.8 14 327.2 ± 18.3 8
1 1652.4 ± 106.7 12 326.5 ± 23.1 8
1S 1625.7 ± 79.3 18 329.5 ± 16.9 8
2 1651.1 ± 85.9 13 333.5 ± 14.9 6
2S 1579.6 ± 68.4* 12 314.3 ± 14.3 7
3 1644.9 ± 39.4 12 330.3 ± 8.2 8
3S 1610.1 ± 77.5 10 322.3 ± 18.4 5
1+2 1558.6 ± 115.6* 11 309.1 ± 24.5 11
1+2S 1473.4 ± 68.6* 9 291.6 ± 16.2* 9
2+3 1543.0 ± 81.0* 5 301.2 ± 22.8 5
2+3S 1499.7 ± 76.0* 6 296.3 ± 15.6 6
C 1 2 3
P
ECoG
P
ECoG
R KCl
P+ECoG
1+2 2+3 LP
10 mV
1 min 1
2
1
2
1
2
1
2
1 2
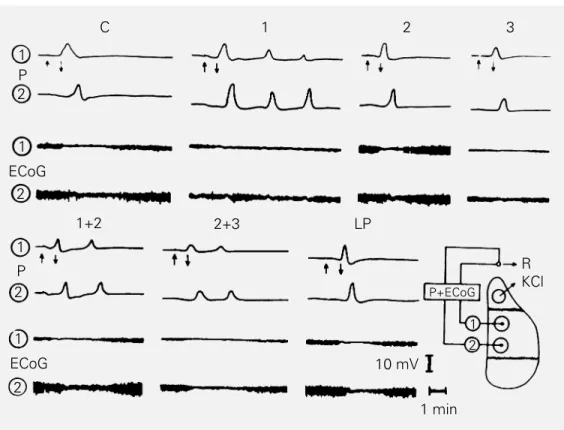
Figure 1 - Examples of electrocorticogram (ECoG) and slow potential change (P) of SD in adult rats. C = Control rats fed a commercial diet with 23% protein. Short episodes of malnutrition were provoked by feeding the dams a protein-deficient diet (RBD, with 8% protein; see Methods) during the first, second, or third week of the lactation period, or during the first+second and second+third weeks. LP = Rats submitted to malnutrition throughout the lactation period. The right inset shows the recording positions 1 and 2 and the position of the reference electrode (R). SD was elicited with 2% KCl applied to the frontal cortex at the times indicated by the arrows. The vertical calibration bar, which indicates 10 mV for the P recordings, also equals 1 mV for the ECoG recordings. A 1-min application of KCl usually elicited a single wave of SD as seen in the control rat. In some previously malnourished rats (e.g., groups 1, 1+2 and 2+3), the same stimulus elicited more than one SD wave. This fact is considered to be an indication of increased susceptibility of the cortical tissue to SD, in addition to the significantly higher velocities of SD propagation shown in Table 3.
2% KCl. Animals malnourished early in life presented higher velocities of SD propaga-tion when compared to control rats. The mean SD velocities per hour ranged as fol-lows: control group, from 3.15 to 3.30 mm/ min; group 1, from 3.47 to 3.60 mm/min; group 1S, from 3.63 to 3.69 mm/min; group 2, from 3.26 to 3.42 mm/min; group 2S, from 3.27 to 3.36 mm/min; group 3, from 3.58 to 3.78 mm/min; group 3S, from 3.70 to 3.81 mm/min; group 1+2, from 3.54 to 3.69 mm/ min; group 1+2S, from 3.64 to 3.85 mm/ min; group 2+3, from 3.59 to 3.77 mm/min; group 2+3S, from 3.69 to 3.80 mm/min and group LP, from 3.84 to 4.06 mm/min. As
ously malnourished and control rats for two main reasons: 1) most weight differences occurred between 7 and 30 days of life, a period during which body weight is not much influenced by gender, and 2) except for groups 1+2S (which contained only 33.33% males) and 1+2, 3S and 2+3S (containing 58.33%, 66.67% and 80% males, respec-tively), the remaining 8 groups contained an approximately equal number of males and females (see Material and Methods). There-fore, it is pertinent to note that even in the malnourished groups with a predominance of males the effect of early malnutrition on body weight was easily recognizable. Let us consider, for example, the mean body weights at 90 days of age of the groups 1+2 (208.92 ± 38.46 g), 2+3 (181.79 ± 40.11 g) and 2+3S (192.04 ± 27.97 g). These groups contained 58.33%, 50% and 80% males, respectively, in contrast to the control group (only 47.4% males). Furthermore, these groups displayed significant decreases in mean body weights compared to control (247.64 ± 55.62 g).
The short episodes of early malnutrition facilitated SD propagation when the rats be-came adults, as evaluated by the higher SD velocities compared to the control group. These effects were qualitatively similar to those previously observed in rats submitted to early malnutrition for longer periods of time (gestation + lactation or until adult-hood; 7,12) and can be attributed to the nutritional deficiency imposed early in life, since protein-deficient diets administered during adulthood do not influence SD (12). The mechanisms responsible for these effects still need to be identified. However, early malnutrition is known to reduce brain myelination, to increase brain cell packing density and to alter synaptic neurotransmit-ters (5). All of these changes have been postulated to participate in the effects of malnutrition on SD (6,7,12,13). Stern et al. (16) reported significantly higher brain nor-epinephrine and serotonin concentrations in early malnourished rats compared to
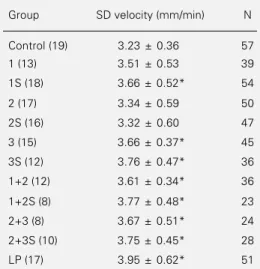
con-Table 3 - Effect of short episodes of malnutrition early in life on velocities of SD propagation (mm/ min) measured when the pups became adults (90-110 days of life).
Data are reported as mean ± SD for a 3-h period with the number of animals given in parentheses. Malnutrition was produced by feeding the dams the regional basic diet (RBD) of low-income human populations of Northeast Brazil (containing 8% protein) during the first (group 1), the second (group 2), the third (group 3), the first+second (group 1+2) or the second+third (group 2+3) week of the lactation period or throughout lactation (group LP). Groups marked with the letter S had suffered an additional restriction consisting of daily separation from the dams during the week when the dams received the protein-deficient diet. A control group fed a commercial diet with 23% protein was used for comparison. N = Number of measurements. *P<0.05 compared to the respec-tive control values (F(11,478) = 8.42; ANOVA fol-lowed by the Tukey test).
Group SD velocity (mm/min) N
Control (19) 3.23 ± 0.36 57
1 (13) 3.51 ± 0.53 39
1S (18) 3.66 ± 0.52* 54
2 (17) 3.34 ± 0.59 50
2S (16) 3.32 ± 0.60 47
3 (15) 3.66 ± 0.37* 45
3S (12) 3.76 ± 0.47* 36
1+2 (12) 3.61 ± 0.34* 36
1+2S (8) 3.77 ± 0.48* 23
2+3 (8) 3.67 ± 0.51* 24
2+3S (10) 3.75 ± 0.45* 28
LP (17) 3.95 ± 0.62* 51
Discussion
previ-trols, which could be considered as an indi-cator of increased brain packing density, occurring with different intensities at dis-tinct time points during the rat “brain growth spurt period” (3,5,14). Concerning the ef-fects on SD observed in the present study, it seems reasonable to consider the involve-ment of the above postulated alterations. Furthermore, it is known that the processes responsible for gliogenesis and myelination largely occur during early postnatal life and can be affected by malnutrition (14). This fact is of relevance for the present results, since the participation of glial cells and my-elin in SD has been considered by some authors on the basis of experimental data
(13,17-19). Interestingly, in rats, both pro-cesses present their peak of development at the beginning of the third week of lactation and, according to the present results, rats malnourished during this week were found to be more affected than those malnourished during the first or second week of the lacta-tion period.
Based on the present data, we emphasize the view that pediatricians and nutrition re-searchers should become more aware of situ-ations in which short episodes of early mal-nutrition could occur in children, since the possibility exists that these episodes, some-times almost unnoticed, produce lasting im-pairment of brain structure and function.
References
1. Ballabriga A (1989). Some aspects of clini-cal and biochemiclini-cal changes related to nutrition during brain development in hu-mans. In: Evrard P & Minkowski A (Edi-tors), Developmental Neurobiology. Raven Press, New York, 271-286. 2. Abel EL (1990). Effects of patternal and
maternal undernutrition on growth of off-spring in rats. Growth, Development, and Aging, 54: 125-129.
3. Morgane PJ, Austin-Lafrance RJ, Bronzino JD, Tonkiss J & Galler JR (1992). Malnutrition and developing central ner-vous system. In: Isaacson RL & Jensen KF (Editors), The Vulnerable Brain and En-vironmental Risks. Plenum Press, New York, 2-42.
4. Dobbing J (1968). Vulnerable periods in developing brain. In: Davison AN & Dobbing J (Editors), Applied Neurochem-istry. Blackwell, Oxford, 287-316. 5. Morgane PJ, Miller M, Kemper T, Stern
W, Forbes W, Hall R, Bronzino J, Kissane J, Hawrylewicz E & Resnick O (1978). The effects of protein malnutrition on the de-veloping central nervous system in the rat. Neuroscience and Biobehavioral Re-views, 2: 137-230.
6. De Luca B, Cioffi LA & Bures J (1977). Cortical and caudate spreading depres-sion as an indicator of neural changes induced by early malnutrition in rats. Activitas Nervosa Superior, 19: 130-131.
7. Guedes RCA (1984). On some conditions that influence cortical spreading depres-sion. Anais da Academia Brasileira de Ciências, 56: 446-453.
8. Leão AAP (1944). Spreading depression of activity in the cerebral cortex. Journal of Neurophysiology, 7: 359-390. 9. Leão AAP (1972). Spreading depression.
In: Purpura DP, Penry K, Tower DB, Woodbury DM & Walter RD (Editors), Ex-perimental Models of Epilepsy. Raven Press, New York, 173-195.
10. Martins-Ferreira H (1983). Spreading de-pression in chicken retina. In: Ookawa T (Editor), The Brain and Behavior of the Fowl. Japan Scientific Society Press, To-kyo, 317-333.
11. Andrade AFD, Guedes RCA & Teodósio NR (1990). Enhanced rate of cortical spreading depression due to malnutrition: prevention by dietary protein supplemen-tation. Brazilian Journal of Medical and Biological Research, 23: 889-893. 12. Guedes RCA, Andrade AFD & Cabral-Filho
JE (1987). Propagation of cortical spread-ing depression in malnourished rats: fa-cilitatory effect of dietary protein defi-ciency. Brazilian Journal of Medical and Biological Research, 20: 639-642. 13. Guedes RCA, Cabral-Filho JE & Teodósio
NR (1992). GABAergic mechanisms in-volved in cortical spreading depression in normal and early malnourished rats. In: Do Carmo RJ (Editor), Spreading Depres-sion. Experimental Brain Research Series, 23: 17-26.
14. Morgane PJ, Austin-Lafrance R, Bronzino J, Tonkiss J, Díaz-Cintra S, Cintra L, Kemper T & Galler JR (1993). Prenatal malnutrition and development of the brain. Neuroscience and Biobehavioral Reviews, 17: 91-128.
15. Teodósio NR, Lago ES, Romani SAM & Guedes RCA (1990). A regional basic diet from northeast Brazil as a dietary model of experimental malnutrition. Archivos Latinoamericanos de Nutricion, 40: 533-547.
16. Stern WC, Forbes WB, Resinick O & Morgane PJ (1974). Seizure susceptibility and brain amine levels following protein malnutrition during development in the rat. Brain Research, 79: 375-384. 17. Sugaya E, Takato M & Noda Y (1975).
Neuronal and glial activity during spread-ing depression in cerebral cortex of cat. Journal of Neurophysiology, 38: 822-841. 18. Szerb JC (1991). Glutamate release and spreading depression in the fascia dentata in response to microdialysis with high K+: