Regina Fernandes FlauzinoI Reinaldo Souza-SantosII Christovam BarcelllosIII Renata GracieIII
Mônica de Avelar Figueiredo Mafra MagalhãesIII
Rosely Magalhães de OliveiraII
I Departamento de Epidemiologia e
Bioestatística. Instituto de Saúde da Comunidade. Universidade Federal Fluminense. Rio de Janeiro, RJ, Brasil
II Departamento de Endemias Samuel Pessoa.
Escola Nacional de Saúde Pública Sergio Arouca. Fundação Osvaldo Cruz (Fiocruz). Rio de Janeiro, RJ, Brasil
III Laboratório de Informações em Saúde.
Instituto de Comunicação e Informação Científica e Tecnológica em Saúde. Fiocruz. Rio de Janeiro, RJ, Brasil
Correspondence: Regina Fernandes Flauzino Departamento de Epidemiologia e Bioestatística
Instituto de Saúde da Comunidade Universidade Federal Fluminense Av. Marquês de Paraná, 303- 3º andar Prédio Anexo - Centro
24030-900 - Niterói, RJ - Brasil E-mail: [email protected] Received: 1/16/2009 Revised: 5/19/2009 Approved: 6/2/2009
Spatial heterogeneity of dengue
fever in local studies, City of
Niterói, Southeastern Brazil
ABSTRACT
OBJECTIVE: To analyze the spatial and temporal occurrence of dengue fever and its association with the heterogeneity of urban environment characteristics.
METHODS: A total of 1,212 dengue cases, recorded in the Information System for Notiiable Diseases (Sinan) between 1998 and 2006, in the city of Niterói, Southeastern Brazil, were georeferenced according to census tracts. These tracts were classiied into homogeneous areas for the occurrence of the disease: slum, shipyard and urban area. Cases were grouped into ive periods – two inter-epidemic periods (1998-2000 and 2003-2005) and three epidemic periods (2001, 2002 and 2006) – and analyzed using operations between layers in a geographic information system (GIS) environment. The kernel method was used to identify clusters of cases. Kulldorff’s spatial scan statistic was used to conirm these clusters statistically.
RESULTS: Of all cases, 57% were females. Age groups with the highest number of cases were 20-29-years (20.5%) and 30-39-years (17.7%). The hill slum sector showed only 11% of households covered by garbage collection service, the highest percentage of illiterate individuals (8.7%) and head of families with income lower than one monthly minimum wage (29.5%). Cases remained in the slum sectors. In the irst epidemic year and in the inter-epidemic periods, the highest number of cases was found in the hill and latland slum sectors; in the second and third epidemic years, in the latland slum sector.
CONCLUSIONS: The economically active portion of the population was that most affected in the study area. Census tracts show spatial heterogeneity in relation to life conditions. In addition, in some tracts, there are differences in spatial and temporal distribution of the risk of occurrence of dengue fever.
DESCRIPTORS: Dengue, epidemiology. Residence Characteristics. Geographic Information Systems, utilization. Urban Zones. Brazil.
INTRODUCTION
Studies on the association between the occurrence of dengue fever and socio-economic and environmental conditions, aiming to clarify the complexity of disease occurrence, do not always obtain results that are expected and in agre-ement. Several authors indicate an inversely proportional relationship between disease incidence level and life conditions,15,19 while others indicate a positive relationship between them.2,22 Different associations found in research results
can be related to the type of spatial unit used, once the grasp of reality may not be the ideal one, depending on the level of aggregation.a
a Alcoforado MV. Dengue 2001-2002, município de Niterói: um estudo ecológico utilizando
The way variables are aggregated can inluence the varia -tion in results. This problem may become worse when there are socioeconomic and infrastructure inequalities and when the aggregation increases: information from covariables can cause regions to be less distinguished from one another and, consequently, lead to misleading results.a Thus, to know the effect of different forms of
data aggregation in time and space is relevant for studies on the distribution of risks of a disease.1
As a result, some studies on these associations identi-ied the occurrence of dengue fever in heterogeneous areas in terms of socioeconomic and environmental indicators.3,5
The present study aimed to analyze the spatial and temporal distribution of dengue fever and its asso-ciation with the heterogeneity of urban environment characteristics.
METHODS
The area studied, the district of Ilha da Conceição
(Conceição Island), in the north of the city of Niterói, Southeastern Brazil, is densely populated and has been inhabited for a long time. Its area has approximately 1 km² and a population of about 6,400 inhabitants,b
comprising 1.4% of the city’s population.
Since the beginning of the 20th century, the naval
industry has been the main activity of this region, esta-blished during the construction of the port of Niterói in 1927. The local population is comprised of ishermen, and naval and train operators. As regards the urban environment, the district is characterized by horizontal occupation of space, with almost exclusively isolated houses (99.2% of the total), in contrast with the few apartments and other types of homes comprising 0.8% of the total. Although the 2000 Censusc did not
record homes in slums, a minor area of the district is becoming a slum, especially in Morro do Mic, as observed while performing the study. There is another area in the north of the island with precarious homes, locally known as Biboca. With the reduction of the naval industry and the closure of major shipyards, only some small and medium-size companies, which outsourced their services for the major shipyards of this area, continue to exist. Businesses in this district sell essential products and include some stores specialized in naval industry and ishing products, one bank and ice manufacturers that supply ishing boats.
Since 2000, there has been a revitalization of the naval industry with the return of the shipyards. In addition,
a Alcoforado MV. Dengue 2001-2002, município de Niterói: um estudo ecológico utilizando modelos hierárquicos bayesianos [dissertação de
mestrado]. Rio de Janeiro: Núcleo de Estudos em Saúde Coletiva da UFRJ; 2005.
b Ferreira GS. Análise espaço-temporal da distribuição dos casos de dengue na cidade do Rio de Janeiro no período de 1986 a 2002
[dissertação de mestrado]. Rio de Janeiro: UFRJ; 2004.
c Instituto Brasileiro de Geografia e Estatística. Censo brasileiro 2000. Rio de Janeiro; 2001.
the demand for personnel to maintain the Rio-Niterói bridge has promoted the migration low in the district, thus causing the local population to luctuate in certain periods of the year.a
Ilha da Conceição was selected for this study because it was one of the districts in Northern Niterói where dengue cases occurred between 1998 and 2006. Records of dengue cases between 1998 and 2006 were provided by the Health Surveillance Coordination Ofice of the Niterói Municipal Health Foundation. According to the Information System for Notiiable Diseases, 1,256 notiied cases in the district were identiied.
The cartographic base of the district of Ilha da Conceição with street axes was provided by the Niterói City Hall Department of City Planning and Urban Control. An online road map service was used as an update to prevent streets without names from inluen -cing the address georeferen-cing process. If something remained unclear, the Global Positioning System (GPS) was used in the ield.
Georeferencing of cases was performed in the
Laboratório de Geoprocessamento do Instituto de
Comunicação e Informação Cientíica e Tecnológica
em Saúde (ICICT/Fiocruz – Institute of Health Technological and Scientific Information and Communication Laboratory of Geoprocessing), using the ArcGis 9.0 software, while spatial analysis was made with the Terraview 3.2 software.
Of all the 1,256 notiied cases, 1,212 were georefe -renced. The remaining 44 addresses did not belong to Ilha da Conceição and for this reason were excluded from the study.
Dengue cases were stratiied according to age group and sex. Socioeconomic and service coverage data, such as years of education, income of head of family, water supply and garbage collection, were obtained from the
Instituto Brasileiro de Geograia e Estatística (IBGE – Brazilian Institute of Geography and Statistics)b and
grouped according to census tracts.
The population in 2000 was considered in the calculation of incidence for the entire district. Mean annual inci-dence was calculated for the inter-epidemic periods.
The use of census tracts as level of aggregation to assess dengue transmission is a strategy employed by authors such as Almeida et al1 (2007), Barcellos et al2 (2005),
Mondini et al10 (2005) and Paulino et al15 (1998). Census tracts were also selected because they were the smallest spatial units with data aggregation that enabled the identiication of occurrence of dengue transmission in homogeneous or not homogeneous district areas during different annual periods.
Sectors were classiied into: hill slum census tract (where Morro do Mic is located), latland slum census tract (where Biboca is located), shipyard census tract, and urban area census tract. This classiication aimed to identify homogeneous areas for disease occurrence. Slum census tracts have common characteristics, described by the IBGEc as sub-normal clusters, deined
as groups of at least 51 households, occupying or having occupied private property until recently, usually arranged close together and in a disorganized way, and lacking essential public services.c Census tracts
included larger naval shipyards. Urban area census tracts showed the best service coverage indicators, according to the IBGE census. The digital set of census tracts was obtained from the IBGE.
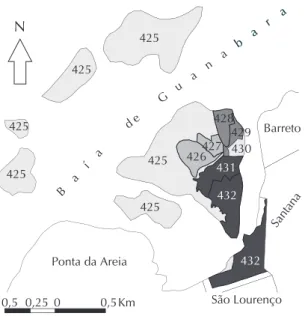
The IBGE considers census tract 425 to be the western and northern sides of Ilha da Conceição (Conceição
island), in addition to Ilhas de Santa Cruz, Caju,
Mocanguê Grande, Mocanguê Pequeno, do Viana and
Manoel João (Santa Cruz, Caju, Mocanguê Grande,
Mocanguê Pequeno, do Viana and Manoel João islands) and the Praça do Pedágio. Census tract 432 is comprised of part of the continent, corresponding to the beginning of Avenida do Contorno (Contorno Avenue) and the access to Ponte Rio Niterói (Rio Niterói bridge). To facilitate the reproduction of reality of census tracts, census tract 425 was divided into six polygons and 432 into two polygons (Figure 1).
Census tracts were analyzed according to the type of water supply, garbage collection, population by sex, lite-racy rate of those aged more than ive years, percentage of heads of family by income ranges and percentage of heads of family by years of education ranges.
Cases were grouped into ive periods, two of which were inter-epidemic (1998-2000 and 2003-2005) and three epidemic (2001, 2002 and 2006).
The kernel estimation method was used to identify clusters with a higher proportion of cases.4 A kernel map with a set of 100 columns over the events and with a quartic function algorithm with adaptive radius was selected for this study. The adaptive radius automati-cally estimates a bandwidth, considering the number of events and the total extension of the area analyzed.4
The digital set of census tracts, streets and geographical coordinates corresponding to the cases were overlaid
on the kernel map to enable the visual analysis of distribution of cases in relation to the clusters identiied on this map.
Kulldorff’s spatial scan statistic8 was used to identify statistically signiicant spatial clusters. This method identiies the most probable spatial cluster that poten -tially violates the null hypothesis of non-cluster. To achieve this, the method imposes a circular window on the map and allows its center to move across the study area, searching for an excess of cases in a certain section of this map.
Kulldorff’s method assesses a Z group of distinct circles, corresponding to all the circles centered on the centroids of different map areas and with random r radii varying between zero and a speciied upper
limit, each representing a potential cluster. For each circle, the method calculates verisimilitude to observe the number of cases inside and outside the circle, assu-ming that cases originated from a Poisson or Bernoulli probability model.8
The hypothesis to be tested was whether all individuals in the population had the same probability of becoming a case or whether there was a certain study area where individuals had a higher probability of becoming a case than individuals outside this area. The test was conditioned to the total number of cases observed and was deined as the ratio of maximum verisimilitude about all possible clusters in the group of cases. The signiicance of the cluster detected was tested using the p value, obtained through Monte Carlo simulations. The maximum percentage of the total population that the detected cluster could have was deined as 20% to implement scan statistic. The number of Monte Carlo simulations selected was 99 simulations and the p value was 0.05 for the creation of the test under the null hypothesis.
There was a particular interest in testing whether there was evidence of one or more areas having a signiicantly higher risk than the mean value observed in the total area and also in identifying the census tracts that were included in these clusters.
RESULTS
Of all cases, 57% were females (692 cases). The age group with the highest number of cases was the 20-to-29-year age group, followed by the 30-to-39-year age group, with respectively 20.5% and 17.7% of all cases (248 and 215 cases). This pattern did not change in the years considered in this study.
In the 1998-2000 inter-epidemic period, it was observed that the mean incidence was 18.3/1,000 inhabitants; in the 2003-2005 inter-epidemic period, 9.4/1,000 inhabit -ants; in the 2001 epidemic year, 48.6/1,000 inhabit-ants; in 2002, 69.2/1,000 inhabitants; and in 2006, 42.5/1,000 inhabitants.
Based on the analysis of cases and census tracts over-laid on the kernel map, census tracts 427, 428 and 429 were found to concentrate cases in all years, on speciic streets (Table) and in the slum census tracts.
The investigation of distribution of cases in each census tract, shown in Figures 2, 3 and 4, indicated that in the irst epidemic year (2001), the streets that concen -trated the highest number of cases were located in the hill slum (Morro do Mic) and latland slum (Biboca) census tracts.
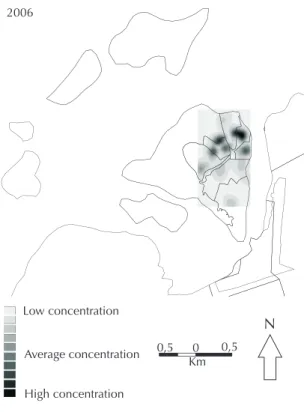
In the second and third epidemic years (2002 and 2006), the streets with the highest number of cases were in the latland slum census tract, all located in Biboca.
As regards the 1998-2000 inter-epidemic period, the streets with the highest number of cases belonged to the hill and latland slum census tracts, located in Morro do Mic and Biboca. In the 2003-2005 inter-epidemic period, the streets with the highest number of cases also belonged to the hill and latland slum census tracts and were mainly located in Morro do Mic.
It was observed that the latland slum census tract had the lowest coverage of water supply service. Of all homes in this tract with water supply, 76.6% had indoor plumbing in at least one room and 23.0% were supplied by water from a well or spring in the land, without indoor distribution.
As regards garbage collection in the hill slum census tract, 11% of homes were covered by public or private garbage collection services, 74.4% disposed of their garbage in dumpsters and 13.6% disposed of it on an empty lot or public area.
In terms of the population aged more than ive years and literate, the hill slum census tract showed the highest percentage of (8.7%) of illiterate individuals, the highest percentage (29.5%) of heads of family with incomes lower than one minimum wage and with incomes between one and two minimum wages (57.8%). In addition, it was the second census tract with the highest percentage (68.3%) of heads of household with one to four years of education and similar to the latland slum census tract, with the highest percentage (70%) of heads of family with one to four years of education.
Kuldorff’s spatial scan statistic conirmed the spatial clusters identiied by kernel. When the entire study period is analyzed, the results shown were not signii -cant (p value=1). The result of analysis by periods showed that, in the 1998-2000 inter-epidemic period, a
Table. Distribution of streets, census tracts, absolute cases and dengue incidence, according to the epidemic period in the
district of Ilha da Conceição. Municipality of Niterói, Southeastern Brazil, 1999-2006.
Cluster Year Streets Census
tracts Type of tracts
Number of cases
Incidence/1,000 inhabitants
Inter-epidemic period 1998- 2000
Rua do Cruzeiro 429 Flatland slum
Travessa Manoel Pedro 427 Hill slum Travessa José de Souza 427 Hill slum Rua Nossa Senhora da
Conceição 429 Flatland slum
Rua Professora Zuleika 429 Flatland slum 118 18.3
Ano epidêmico 2001
Rua Mário Neves: 428 Flatland slum Travessa José de Souza: 427 Hill slum
Travessa Manoel Pedro: 427 Hill slum 313 48.6
Ano epidêmico 2002
Rua Nossa Senhora da
Conceição 429 Flatland slum
Rua Professora Zuleika 429 Flatland slum 446 69.2
Período Interepidêmico 2003 - 2005
Travessa Manuel Pedro 427 Hill slum Rua Nossa Senhora da
Conceição 429 Flatland slum
Rua Mário Neves 428 Flatland slum 61 9.4
Ano epidêmico 2006
Rua Nossa Senhora da
Conceição 429 Flatland slum
primary cluster and a secondary cluster were both iden-tiied in the hill and latland slum census tracts (p<0.05). In the 2003-2005 inter-epidemic period, clusters were identiied in the hill slum census tract (p<0.05). In 2001, an epidemic year, the cluster was identiied in the hill slum and shipyard census tracts, also covering areas of the latland slum census tract (p<0.05). In 2002 and 2006, signiicant clusters were observed in the latland slum census tract exclusively (p<0.05).
DISCUSSION
The occurrence of a higher number of dengue cases in females in this study is a pattern that has been reported by Torres20 (2005), once this group is more affected due to the vector’s indoor characteristics. Studies that used districts as the spatial unit of analysis and secondary data corroborate the predominance of female cases.17 The same has been shown by Vasconcelos et al21 (1993).
The higher number of cases in women could also have resulted from the greater use of health services, leading to possible notiication bias.
As regards the age group, it was observed that 38.2% of cases occurred in the economically active range. Ilha da Conceição is characterized by a predominantly adult population, mostly aged between 20 and 29 years (21.1% of the population). Thus, a great portion of the economically active population was affected by the disease, which could have harmed the local economy. According to Nobre et al11 (1994), dengue
fever has important socioeconomic implications, as it
Figure 2. Kernel estimation of dengue cases distribution
according to periods and census tracts in the district of Ilha da Conceição. Municipality of Niterói, Southeastern Brazil, 1998-2001.
1998 - 2000
2001
Low concentration
High concentration
Average concentration 0,5 0 0,5
Km
N
Digitalização dos mapas: IBGE e Labgeo/Fiocruz Fonte de dados: IBGE e PMF-Niterói
Estruturação dos mapas: Labgeo/Fiocruz
Figure 1. Classification, situation and type of census tracts
in the district of Ilha da Conceição. Municipality of Niterói, Southeastern Brazil.
B
a
í
a
d e G u
a n a
Ponta da Areia
b a r a
S b a
r a
Barreto
Santana 425
425 425
425
425
425
426427 428
429
431
432
432 430 N
São Lourenço
Classificação, situação e tipo da Ilha da Conceição
Other districts of Niterói Shipyard
Hill slum Flatland slum Urban area
0 0,5Km
affects major urban centers, causes work absenteeism, reduces tourist low, increases health service demand and requires great amounts of financial resources to be spent. Gonçalves Neto & Rebelo6 (2004) and Vasconcelos et al22 (1993), who used the city as the
spatial unit of analysis, indicated greater risk of being infected by dengue in individuals from the economi-cally active range. Studies that used districts3,17,21 and census tracts7 as spatial units of analysis indicated the same risk, revealing the disease’s major negative effect on the economy of the affected area. In addition, the high percentage of cases recorded should be consid-ered to be associated with the need to obtain a medical certiicate to justify work absences, thus resulting in further notiication bias.
Studies by Botinelli et ala and Pérez Martinez et al16
(2003) indicate clusters of blocks for tourist accommo -dation and hotels and areas with a heavy low of people as high-risk areas for dengue fever. This fact could have occurred in the area of the present study.
As regards viral circulation, in the beginning of the study in 1998, the circulating virus was DEN2, which remained until 2001, when DEN1 was reintroduced, causing an epidemic throughout the city, affecting city districts with particularities. In 2002, DEN3 was introduced. The circulation of the three viruses was concomitant in the entire city until the end of the study period.b
a Bottinelli OR, Marder G, Ulón SN, Ramírez L, Sario, HR. Estratificación de áreas de riesgo-dengue en la ciudad de corrientes mediante el
uso de los (SIG) Sistemas de Información Geográfico. Corrientes: Universidad Nacional del Nordeste; 2002.
b Fundação Municipal de Saúde de Niterói. Relatório Técnico da Coordenação de Vigilância em Saúde. Niterói; 2007.
Figura 4. Kernel estimation of dengue cases distribution
according to periods and census tracts in the district of Ilha da Conceição. Municipality of Niterói, Southeastern Brazil, 2006.
2006
0,5 0 0,5
Km
N Low concentration
High concentration Average concentration
Figure 3. Kernel estimation of dengue cases distribution
according to periods and census tracts in the district of Ilha da Conceição. Municipality of Niterói, Southeastern Brazil, 2002-2005.
2002
2003-2005
Low concentration
High concentration
Average concentration 0,5 0 0,5
Km
In epidemic years, the highest incidence rate occurred in 2002, with 69.2 cases/1,000 inhabitants. As the island population has low population growth, when compared to the means of the remaining city districts, this increase in incidence rate could be associated with the introduction of a new type of virus of the disease in the susceptible population.12,13 This incidence could also be associated with population luctuations due to the availability of jobs in shipyards, once a great portion of this population are not included in the IBGE statistics, although they seek health services in the area for medical care.
The persistence of cases in Morro do Mic and Biboca, both located in slum census tracts, causes concern. In Morro do Mic, the majority of cases occurred on the higher part of the hill, an area of dificult access, reached by long lights of steps. It is an area that includes 77.7% of the households with garbage disposed of in dump-sters and 98% with public water supply. However, the local population has the highest percentage of illiterate individuals aged more than ive years (8.7%), the highest percentage of heads of family with the lowest number of years of education (68.3%), 57.8% of whom receive less than two minimum wages. This socioeco-nomic and service coverage pattern was observed in studies by Almeida et al1 (2007) and Paulino et al15 (1998), who analyzed the risk of dengue fever using stratiication of census tracts and found an incidence level inversely proportional to life conditions. Areas at a higher risk were clustered in densely-populated census tracts, including population with lower income and level of education, living in simple dwellings and lacking basic services.
Biboca had been considered a slum in previous censuses and is currently an urban census tract. However, it remained a slum in this study. It is an area with a concentration of precarious homes and disorganized occupation, with a great concentration of temporary workers, most of who were in naval construction. There was a large uncovered water container (water tank) close to this area, which was probably linked to the proliferation of vectors and virus transmission. In an observation made in the ield, this container was found to be abandoned and its bottom had been occupied and turned into home for community residents. The hypothesis is that this particular location played a role
in maintaining dengue on Ilha da Conceição. In fact, in all periods studied, streets belonging to this loca-tion and those located around it showed cases in the clusters identiied by the kernel method and conirmed by Kulldorff. According to Lagrota et al9 (2008), medium-size and large water containers are found to be more productive for Aedes aegpypti and play an important role in the spread of dengue. These must be key breeding sites for control actions, because large breeding sites have a major importance in maintaining high vector densities in all seasons of the year. Areas with irregularity in water supply and the presence of homes with precarious structure favored the mainte-nance of vector breeding sites,9 a factor also indicated by Oliveira & Valla14 (2001).
As regards the methods for spatial analysis used, Kulldorff’s spatial scan statistic was found to be useful, because it conirmed that the kernel method can be suitable for a local-level study, once it is a subjective and exploratory method, depending on the researcher’s perception to deine its parameters.
By classifying census tracts for the analysis of point pattern of dengue cases, their spatial heterogeneity in relation to life conditions was observed. Spatial heterogeneity is deined as a certain geographical space where populations in different socioeconomic strata are found. This space can be a cluster of spatial units, such as census tracts, districts and/or sanitary districts.5
According to Sabroza et al18 (1992), heterogeneity of incidence and/or distribution of cases is associated with different life conditions of the distinct social strata occupying the space. The way spaces are occupied by populations of different socioeconomic strata can cause these spaces to become vulnerable and create conditions that favor disease production and reproduction.
1. Almeida MCM, Caiaffa WT, Assunção RM, Proietti FA. Spatial vulnerability to dengue in a Brazilian urban area during a 7-year surveillance. J Urban Health. 2007;84(3):334-45. DOI:10.1007/s11524-006-9154-2
2. Barcellos C, Pustai AK, Weber MA, Brito MRV. Identificação de locais com potencial de transmissão de dengue em Porto Alegre através de técnicas de geoprocessamento. Rev Soc Bras Med Trop. 2005;38(3):246-50. DOI:10.1590/S0037-86822005000300008
3. Barrera R, Delgado N, Jiménez M, Villalobos I, Romero Y. Estratificación de una ciudad hiperendémica en dengue hemorrágico. Rev Panam Salud Publica. 2000;8(4):225-33. DOI:10.1590/S1020-49892000000900001
4. Bailey TC, Gatrell AC. Interactive spatial data analysis. Essex: Longman Scientific & Technical; 1995.
5. Flauzino RF, Souza-Santos R, Oliveira RM. Dengue, geoprocessamento e indicadores socioeconômicos e ambientais: um estudo de revisão. Rev Panam Salud Publica. 2009;25(5):456–61.
6. Gonçalves Neto VS, Rebelo JM. Aspectos epidemiológicos do dengue no Município de São Luís, Maranhão, Brasil, 1997-2002. Cad Saude Publica. 2004;20(5):1427-31. DOI:10.1590/S0102-311X2004000500039
7. Heukelbach J, Oliveira FAZ, Kerr-Pontesand LRS, Feldmeier H. Risk factors associated with an outbreak of dengue fever in a favela in Fortaleza, north-east Brazil. Trop Med Int Health. 2001;6(8):635-42. DOI:10.1046/j.1365-3156.2001.00762.x
8. Kulldorff MA. A spatial scan statistic. Commun
Stat Theory Methods. 1997;26(6):1481-96. DOI:10.1080/03610929708831995
9. Lagrotta MTF, Silva WC, Souza-Santos R. Identification of key areas for Aedes aegypti control through geoprocessing in Nova Iguaçu, Rio de Janeiro State, Brazil. Cad Saude Publica. 2008;24(1):70-80. DOI:10.1590/S0102-311X2008000100007
10. Mondini A, Chiaravalloti Neto F, Sanches MG, Lopes JCC. Análise espacial da transmissão de dengue em uma cidade de porte médio do interior paulista. Rev Saude Publica. 2005;39(3):444-51. DOI:10.1590/ S0034-89102005000300016
11. Nobre FF, Braga AL, Pinheiro RS, Lopes JAS. SIGEPI: Um sistema básico de informação geográfica para apoio à vigilância epidemiológica. Inf Epidemiol SUS. 1996;5(3):59-72.
12. Nogueira RMR, Miagostovich MP, Schatzmayr HG, Santos FB, Araújo ES, Filippis AM, et al. Dengue in the State of Rio de Janeiro, Brazil, 1986-1998. Mem Inst
Oswaldo Cruz. 1999;94(3):297-304. DOI:10.1590/ S0074-02761999000300004
13. Nogueira RMR, Miagostovich MP, Filippis AM, Pereira MA, Schatzmayr HG. Dengue virus type 3 in Rio de Janeiro, Brazil. Mem Inst Oswaldo Cruz. 2001;96(7):925-6. DOI:10.1590/S0074-02762001000700007
14. Oliveira RM, Valla VV. As condições e as experiências de vida de grupos populares no Rio de Janeiro: repensando a mobilização popular e controle do dengue. Cad Saude Publica. 2001;17(Supl):77-88. DOI:10.1590/S0102-311X2001000700016
15. Paulino AIC, Natal D. Distribuição espacial da dengue e determinantes sócio-econômicos em uma localidade urbana no sudeste do Brasil. Rev Saude Publica. 1998;32(3):232-36. DOI:10.1590/S0034-89101998000300005
16. Pérez Martinez TT, Iñiguez Rojas L, Sánchez Valdés L, Remond Noa R. Vulnerabilidad espacial al dengue. Una aplicación de los sistemas de información geográfica en el municipio Playa de Ciudad de La Habana. Rev Cuba Salud Publica. 2003;29(4):353-65.
17. Ribeiro AF, Marquesi GRAM. Associação entre incidência de dengue e variáveis climáticas. Rev Saude Publica. 2006;40(4):671-6. DOI:10.1590/S0034-89102006000500017
18. Sabroza PC, Toledo, LM, Osanai CH. A Organização do espaço e processos endêmicos-epidêmmicos. In: Leal MC, Sabroza PC, Rodrigues RH, Bus PM, editores. Saúde, Ambiente e Desenvolvimento. São Paulo: Hucitec /Rio de Janeiro: Abrasco; 1992. v.2, p.57-77.
19. Siqueira Jr. JB, Martelli CMT, Maciel IJM, Oliveira RM, Ribeiro MG, Amorim FP, et al. Household survey of dengue infection in Central Brazil: spatial point pattern analysis and risk factors assessment. Am J Trop Med Hyg. 2004;71(5):646-51.
20. Torres EM. Dengue. Rio de Janeiro: Editora FIOCRUZ; 2005.
21. Vasconcelos PFC, Travassos da Rosa JFS, Freitas RB, Degallier N, Rodrigues SG, Travassos da Rosa APA. Epidemia de febre clássica de dengue causada pelo tipo 2 em Araguaína, Tocantins, Brasil. Rev Inst Med Trop São Paulo. 1993;35(2):145-8. DOI:10.1590/ S0036-46651993000200005
22. Vasconcelos PFC, Lima JWO, Rosa APAT, Timbó MJ, Rosa EST, Lima HR, et al. Epidemia de dengue em Fortaleza, Ceará: inquérito soro-epidemiológico aleatório. Rev Saude Publica. 1998;32(5):447-54. DOI:10.1590/S0034-89101998000500007