Copyright © 2008 by Sociedade Brasileira de Pediatria
O
RIGINALA
RTICLEAssessment of anthropometric indexes of children and
adolescents with Down syndrome
Taís de S. Lopes,1 Daniele M. Ferreira,2 Rosangela A. Pereira,3 Gloria V. da Veiga,4 Vania M. R. de Marins5
Abstract
Objective:To compare the agreement in the classification of the weight-for-age (W/A) and height-for-age (HA) indexes for children and adolescents with Down syndrome (DS) according to selected international reference distributions.
Methods:A cross-sectional study was carried out in children (2 to 9.9 years old) and adolescents (10 to 17.9 years old) with DS from cities in the state of Rio de Janeiro, Brazil, in 2005. The W/A and H/A indexes were classified according to the percentiles of two curves developed for individuals with DS and one distribution developed for healthy subjects. The cut-off limits applied for categorization were: below the 5th percentile (< P5) and above the 95th percentile (> 95). The weighted Kappa index was estimated to assess agreement between the classifications (p < 0.05).
Results:Information was obtained on 98 children and 40 adolescents. From 1.0 to 18.4% of the children were < P5 for W/A, and the agreement for this index was considered weak (Kappa = 0.16; 95%CI -0.03-0.34; p < 0.01); no agreement was observed between the H/A classifications. For adolescents, W/A < P5 varied from 2.5 to 5.0%; once more there was no agreement for this classification (Kappa = 0.16; 95%CI -0.15-0.48; p > 0.05). There was good agreement for the H/A index (Kappa = 1.00; 95%CI 0.23-1.00; p < 0.01).
Conclusion:There was weak agreement between classifications of anthropometric indexes according to three different distributions. The data indicated that the construction of specific curves for individuals with DS would facilitate the identification of overweight, which is often observed among these patients.
J Pediatr (Rio J). 2008;84(4):350-356:Nutritional assessment, children, adolescents, Down syndrome, anthropometry, weight-for-age, height-for-age.
Introduction
Down syndrome (DS) is a genetic anomaly in the 21st pair of chromosomes which has an extra chromosome (trisomy 21). This abnormality causes physical and mental impair-ment, such as muscular hypotonia (in particular oral), con-genital heart disease, reduced immunity, gastrointestinal disorders, obesity, delayed psychomotor development and neurological problems, and hearing and sight deficiencies.1,2
Growth occurs in a different way among children with DS and it is characterized by earlier onset of the growth spurt and
reduced linear growth velocity, which results in shorter stat-ure than general population.3-13There is also a predisposi-tion to overweight, particularly among adolescents and adults7,14,15that may itself be related to the growth defi-ciency since it reduces energy requirements. In addition to being a risk factor for metabolic disorders, overweight is an aggravating factor for other conditions that affect this group, such as heart diseases and muscular hypotonia. Therefore, nutritional assessment of children and adolescents with DS is
1. Mestre. Programa de Pós-Graduação em Nutrição, Universidade Federal do Rio de Janeiro (UFRJ), Rio de Janeiro, RJ, Brazil. 2. Doutora. Professora adjunta, Faculdade de Nutrição, Universidade Federal Fluminense (UFF), Niterói, RJ, Brazil.
3. Doutora. Professora adjunta, Instituto de Nutrição Josué de Castro (INJC), UFRJ, Rio de Janeiro, RJ, Brazil. 4. Doutora. Professora associada, INJC, UFRJ, Rio de Janeiro, RJ, Brazil.
5. Doutora. Coordenadora, Curso de Nutrição, Faculdade Arthur Sá Earp Neto, Petrópolis, RJ, Brazil.
No conflicts of interest declared concerning the publication of this article.
Suggested citation:Lopes TS, Ferreira DM, Pereira RA, da Veiga GV, de Marins VM. Assessment of anthropometric indexes of children and adolescents with Down syndrome. J Pediatr (Rio J). 2008;84(4):350-356.
Manuscript received Dec 27 2007, accepted for publication May 28 2008.
doi:10.2223/JPED.1818
important to enable the diagnosis and monitoring their nutri-tional conditions.
Percentile distributions of anthropometric indexes, such as weight-for-age (W/A), weight-for-height (W/A) and height-for-age (H/A) specific for children and adolescents with DS have been developed reflecting the lower growth velocity and the restricted height observed in this group. The distribu-tion compiled in the United States6is one of the most often cited in the literature4,5,10-12,16,17and has distributions for weight, height and head circumference by age (HC/A), according to sex and covering the age group from 2 to 18 years.
In Spain,8,9distributions have been established for chil-dren and adolescents with DS from 3 months to 17 years of age including the same indexes covered by the United States distribution.7In Sweden4and in the United Kingdom and Ire-land,5specific distributions have been compiled for weight, height/length and head circumference, by age group and sex, from birth to 18 years of age.
In Italy, Piro et al.13developed curves for weight, length/ height and head circumference for children with DS from 0 to 5 years of age. In Saudi Arabia, Al Husain18also compiled curves by age group and sex, for weight, length/height, head circumference and weight for length/height for children from 0 to 5 years of age with DS and compared them with curves developed for children of the same group but without this condition.
In Brazil, Mustacchi19carried out a longitudinal study with 174 children from 0 to 8 years of age with DS, in the urban zone of São Paulo, between 1980 and 2000. The author assessed weight, height and head circumference and com-piled distributions for the indexes H/A, W/A and HC/A, accord-ing to age group and sex. In this country there studies investigating assessment of anthropometric indexes in chil-dren and adolescents with DS are scarce. There is also no record of studies investigating the use of specific distribu-tions for people with DS. The objective of this study is to assess the agreement between three different classifications of the W/A and H/A indexes of children and adolescents of both sexes with DS: two developed specifically for individuals with DS (in the United States6and in Spain8,9) plus the reference distri-bution recommended by the World Health Organization (WHO).20,21
Methods
A cross-sectional study was carrried out in children (aged 2 to 9.9 years) and adolescents (aged 10 to 17.9) with DS from both sexes, assisted at selected philanthropic institu-tions and selected from four cities in the state of Rio de Jan-eiro, Brazil: Niterói, São Gonçalo, Duque de Caxias and Rio de Janeiro. Pretest and pilot studies were carried out for all field-work procedures at similar institutions in the same state (Petrópolis, RJ).
All children and adolescents registered at these institu-tions that met the inclusion criteria were examined: clinical or genetic (karyotype) diagnosis of DS and no physical dis-ability that could prevent anthropometric assessment.
The sample was characterized according to data on fam-ily income and parents’ educational level obtained by a struc-tured questionnaire. Monthlyper capitafamily income was calculated by dividing the total family income by the number of people living in household and then categorized into mul-tiples (or fractions) of the monthly minimum wage that was effective at the collecting data period (R$ 300.00/US$ 125.00). The parents’ educational level was recorded as the highest grade concluded with approving.
Measurements were taken with the children and adoles-cents wearing minimum clothing, no shoes, and no orna-ments or jewelry. They were weighed using a Kratos-Cas portable electronic scale with 150 kg capacity and 50 g preci-sion. Height was measured twice using a Seca®(model 206) stadiometer accurate to 0.1 cm, if the difference between measurements was greater than 0.5 cm the mesurements were repeated. The mean of the two measurements was used in the analysis.
The statistic analysis included the estimation of absolute and relative frequencies for the variables describing the sample characteristics as well weight and height means (and respective 95% confidence interval – 95%CI).
The indexes analysed were W/A and H/A, since the refer-ence distributions specific for individuals with DS from the United States6and from Spain8,9only presented data for these indexes. The same indexes were also estimated according to the distributions proposed by the WHO,20,21which are the ref-erences used by the Brazilian Ministry of Health to assess the growth of children and adolescents in the general population.22
The distributions were compared taking into account the following cutoff points: for the W/A index, below the 5th per-centile (P5), between P5 and the 95th perper-centile (P95) and above P95; for the H/A index the cutoff was above or below P5. These cutoff points were chosen since they are provided by the adopted distributions and are used as indicators of pos-sible underweight (P5, W/A), overweight (P95, W/A), and stunting (P5, H/A). It is expected that 5% of the children and adolescents would be classified below P5 and 5% above P95 according to each distribution.
The weighted Kappa (and 95%CI) was estimated in order to evaluate agreement between the classifications of W/A and H/A indexes according to the three distributions. The Kappa values were interpreted according to following: Kappa < 0.40, weak agreement; Kappa 0.40 - 0.75, good agreement; Kappa > 0.75, excellent agreement. If Kappa is zero, any agree-ment observed can be explained by chance. Negative values for Kappa means that the observed agreement is less than would be obtained by chance. Finally, Kappa value equal to one means that the agreement is excellent.24Statistical sig-nificance was considered for p < 0.05.
This project is in compliance with Ministry of Health reso-lution 196/9625and has been approved by the Research Eth-ics Committee at the Hospital Universitário Antônio Pedro/ Medical Faculty/Universidade Federal Fluminense (hearing number 142/04). The children and adolescents were autho-rized to participate by parents or guardians, who signed free and informed consent forms after receiving information on all of the procedures used in the investigation.
Results
The philanthropic institutions studied had a total of 157 children and adolescents with DS enrolled (83 boys and 74 girls) in the age group of interest. It was not possible to obtain
information on19 (12.1%) subjects either because their par-ents or guardians refused permission or because they were not able to undergo anthropometric measurement. A total of 138 individuals were examined (72 boys, 52.2%; 66 girls, 47.8%), of whom 98 (71.0%) were children aged 2 to 9.9 years (46 boys and 52 girls) and 40 were adolescents (26 boys and 14 girls) (Table 1).
The median monthly family incomeper capita was 0.5 minimum wage. Educational level of the fathers showed that 74% studied up to the fourth grade of elementary school. In contrast, 24% of the mothers had 4 years or less at school and 28% had completed the high school (11 years’ study) (Table 1).
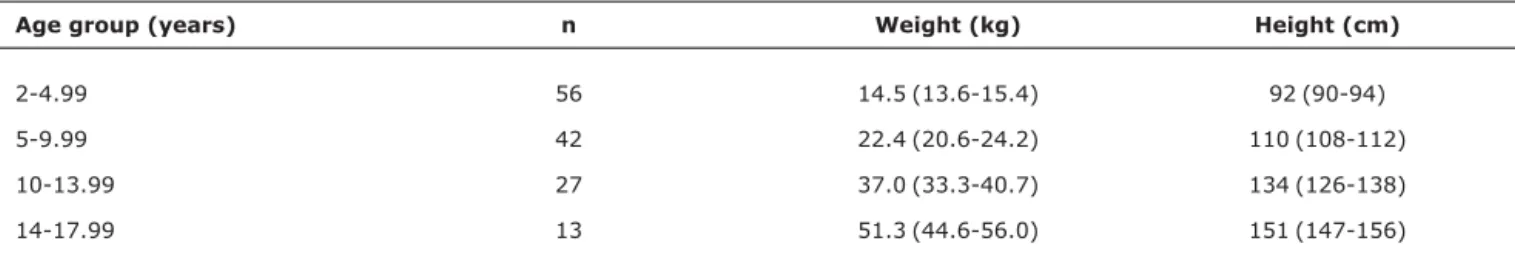
Table 2 lists the characteristics of the group investigated in terms of weight and height (means and 95%CI) broken down by age group.
The proportion of children below P5 for the W/A index var-ied from 1.0%, according to the distribution from the United States,6to 18.4%, according to the Spanish distribution.8,9 The Spanish8,9and the WHO distributions20classified 4.1% of the children above P95 for W/A, whereas, according to the distribution from the United States,616.3% were above this limit and none of the children were below P5 for H/A. How-ever, according to the Spanish distribution8,9and to the
Table 1- Characteristics of the children and adolescents with Down syndrome (Rio de Janeiro, 2005)
Variables Frequency %
Sex (n = 138)
Male 72 52.2
Female 66 47.8
Age (n = 138)
2.0-9.9 years 98 71.0
10.0-17.9 years 40 29.0
Family incomeper capita*†(n = 130)
< 0.5 minimum wage 63 48.5
> 0.5 minimum wage 67 51.5
Educational level of fathers‡(n = 116)
Up to 4th grade of elementary school 86 74.1
From 5th to 8th grades of elementary school 30 25.9
Educational level of mothers§(n = 132)
Up to 4th grade of elementary school 32 24.2
From 5th to 8th grades of elementary school 63 47.8
High school 37 28.0
*Expressed as fractions or multiples of the minimum wage prevailing at the time of data collection, which was R$ 300.00 (three hundred reais) or about US$ 125.00 (one hundred and twenty five dollars).
WHO,2020.4 and 55.1%, respectively, were considered to be below the P5 for the H/A index (Table 3).
According to the distribution from the United States,6 5.0% of the adolescents were classified as below P5 for W/A, whereas the Spanish8,9distribution defined 2.5% as below this level. Adolescents were only classified above P95 for W/A in relation to the distribution from Spain8,9(17.5%). The H/A index analyzed according to the DS-specific distributions revealed that 2.5% of the adolescents were classified as below P5. On the other hand, the WHO distribution,21classified 60.0% of the adolescents below the P5 for the H/A index.
For the children, there was little agreement (Kappa = 0.29; 95%CI 0.20-0.37; p < 0.01) between W/A classifica-tions according to the three distribuclassifica-tions. The same degree of agreement was observed between the classifications based on the distributions from the United States6and Spain8,9 (Kappa = 0.16; 95%CI -0.03-0.34; p < 0.01). The same was also observed with relation to the comparison of the W/A clas-sification according to the distribution from the United States6 and the WHO20(Kappa = 0.26; 95%CI 0.04-0.48; p < 0.01). Good agreement was observed between the W/A classifica-tion according to the distribuclassifica-tion from Spain8,9and the WHO
classification20(Kappa = 0.50; 95%CI 0.29-0.72; p < 0.01) (Table 4).
The H/A classifications according to all three distributions taken together had agreement close to zero (Kappa = 0.02; 95%CI -0.09-0.13; p > 0.05). When the distributions were compared in pairs, no agreement whatsoever was detected (United States6vs. Spain8,9and United States6vs. WHO:20 Kappa = 0.00; p > 0.05; Spain8,9vs. WHO: Kappa = 0.00; 95%CI -0.15-0.05; p > 0.05) (Table 4).
For the adolescents, weak agreement was observed in the comparison of the W/A classified according to the DS-specific distributions (Kappa = 0.16; 95%CI -0.15-0.48; p > 0.05). Similarly, no agreement was observed for the H/A index when all three distributions were considered (Kappa = -0.13; 95%CI -0.30-0.04; p > 0.05). For H/A, excellent agreement was observed (despite a wide confidence interval) for the classifi-cations by the DS-specific distributions (Kappa = 1.00; 95%CI 0.23-1.00; p < 0.01) and no agreement when these classifi-cations were compared with that estimated according to the distribution adopted by the WHO21(Table 4).
Discussion
The results demonstrate high proportion of children clas-sified below P5 for W/A according to the distribution from
Table 2- Means (95%CI) of the anthropometric measurements of children and adolescents with Down Syndrome, by age group (Rio de Janeiro, 2005)
Age group (years) n Weight (kg) Height (cm)
2-4.99 56 14.5 (13.6-15.4) 92 (90-94)
5-9.99 42 22.4 (20.6-24.2) 110 (108-112)
10-13.99 27 37.0 (33.3-40.7) 134 (126-138)
14-17.99 13 51.3 (44.6-56.0) 151 (147-156)
Table 3- Weight-for-age and height-for-age indexes of children and adolescents with Down syndrome classified according to three different reference distributions (Rio de Janeiro, 2005)
Children (2 to 9.99 years) (n = 98)* Adolescents (10 to 17.9 years) (n = 40)†
Index United States Spain WHO‡ United States Spain WHO§
W/A index
< P5 (%) 1.0 18.4 9.2 5.0 2.5
-Between P5 and P95 (%) 83.7 77.6 86.7 95.0 80.0
-> P95 (%) 16.3 4.1 4.1 0.0 17.5
-H/A index
< P5 (%) 0.0 20.4 55.1 2.5 2.5 60.0
H/A = height for age; WHO = World Health Organization; W/A = weight for age.
* Weighted Kappa for weight-for-age = 0.29 (95%CI 0.20-0.37); p = 0.000; Weighted Kappa for height-for-age = 0.02; (95%CI -0.09-0.13); p = 0.33.
†Weighted Kappa for height-for-age = -0.13; (95%CI -0.30-0.04); p = 0.92. ‡WHO, 2006.
Spain8,9and the distribution developed for healthy individu-als.20Conversely, the distribution from the United States6 resulted in an elevated proportion of children categorized above P95. In contrast with the results for the children, the Spanish distribution8,9classified a higher proportion of the adolescents above P95 than did the distribution from the United States,6indicating that the Spanish distribution pos-sibly has greater sensitivity in the detection of overweight among adolescents with DS. These data suggest that the ado-lescents studied here possibly do not present underweight.
Analysis of the H/A index showed divergent results for chil-dren according to the three reference distributions. Whereas for the adolescents the data analyzed according to the spe-cific distributions indicated that their growth did not differ sub-stantially from that of adolescents with DS originating from other population groups (Spain and United States).
Despite recognizing the elevated prevalence of heart dis-eases among people with DS and their repercussions for nutri-tional status, in this study the effect of these conditions was not considered in analyses, since the study intended purely to compare how the individuals would be categorized by the different distribution references. Another limitation of this study is the reduced number of individuals in the age and sex categories, particularly among the adolescents.
These findings indicate the need to carefully evaluate the nutritional situation of adolescents with DS. If the adoles-cents in this study had been assessed solely using the distri-bution from the United States,6it would not have been possible to identify overweight among them. Assessment using the Spanish distribution,8,9in contrast, makes it pos-sible to implement interventions to reduce the weight of those categorized above P95 for W/A, which could reduce the devel-opment of possible metabolic disturbances which would be caused by excess body fat.
Furthermore, the use of H/A distributions developed for healthy individuals is inappropriate for assessing the growth of people with DS; therefore, it is recommended the develop-ment of specific reference distributions to monitor the growht of individuals with the DS.
The weight-for-height and BMI-for-age indexes, which assess the harmony between the dimensions body mass and height, were not investigated in this article based on the fact that the two distributions developed for individuals with DS6,8,9do not provide data for these indexes.
The distribution published by Mustacchi et al.,19which was compiled in Brazil, was not used in this study because it only covers the age group from 1 to 8 years of age. Furthermore, for operational reasons, two other distributions4,5developed for individuals with DS were also not used in the analysis. A distribution developed in Sweden4does not present the curves in percentiles, whereas a distribution developed in the United Kingdom and Ireland5does not provide the 5th and 95th percentiles.
Myrelid et al.5also compared anthropometric data from Swedish children and adolescents with DS with the DS-specific distribution from the United States.6The authors observed discrepancies such as, for example, the mean height of the Swedish DS subjects at 18 years of age was greater than that of the individuals from the United States. In terms of weight, the authors observed the inverse relationship: the mean weight of the Swedish adolescents with DS at 18 years corre-sponded to the 50th percentile for boys and the 25th percen-tile for girls on the distribution from the United States.6The authors attributed these differences to ethnic diversity and the different sample sizes.
In Portugal, Fernandes et al.10examined 196 children aged 0 to 48 months with DS and 96 siblings of these children who did not have DS. When they compared their results with the DS-specific distribution from the United States.6The authors observed that the Portuguese children had a similar growth to those in the United States up to 24 months of age, but, from 24 to 48 months, they exhibited higher values for length and weight.
In a study carried out in Chile, Pinheiro et al.16conducted research with 116 children and adolescents with DS, aged from 3 months to 18 years. These authors assess agreement between diagnoses of W/A and H/A indexes according to the DS-specific distributions from the United States6and Spain8,9
Table 4- Agreement between classifications of the W/A and H/A indexes of children and adolescents with Down Syndrome according to three different reference distributions (Rio de Janeiro, 2005)
Kappa (95%CI)
Weight-for-age Height-for-age
Distributions Children Adolescents Children Adolescents
United States/Spain 0.16 (-0.03-0.34) 0.16 (-0.15-0.48) - 1.00 (0.23-1.00)
United States/WHO 2006/07 0.26 (0.04-0.48) - - 0.00* (-0.15-0.05)
Spain/WHO 2006/07 0.50 (0.29-0.72) - 0.00 (-0.15-0.15) 0.00* (-0.15-0.05)
and also with the National Center for Health and Statistics (NCHS) curves.26The authors observed that there was very little agreement between the distributions in terms of the indexes analyzed; nevertheless, they indicated that the dis-tribution from Spain was more appropriate for assessing nutri-tional disorders among these children.
There is no consensus related to reference distributions and classification criteria to be used for assessing the nutri-tional status of children and adolescents with DS. Although specific distributions have already been developed in some countries,3-6,8-10,12,13,18there are no records of studies car-ried out in Brazil which have compiled weight and height dis-tributions from a representative sample of individuals with DS. The need to use distributions produced specifically for this group is based on the recognition that their growth and devel-opment is different.
The weak agreement observed between the distributions analysed indicates that carrying out longitudinal studies with representative samples of individuals with DS in Brazil would be of great utility to understanding the process of growth and development in these children and adolescents and would allow the development of reference distributions specific to this population group. Such studies would make it possible to construct specific curves, which would be an aid in the identi-fication of the weight alteration, primarily overweight, which are often observed in this group.
Acknowledgements
The authors would like to thank Professor Luzia Giannini Cruz for her help with fieldwork and Professor Renan Moritz Varnier de Almeida for help analyzing the data. The authors are also grateful to the students Anna Caroline Mendes Car-doso, Letícia Ferreira and Thais Fernandes.
References
1. Granzotti JA, Paneto IL, Amaral FT, Nunes MA.Incidência de cardiopatias congênitas na Síndrome de Down.J Pediatr (Rio J). 1995;71:28-30.
2. Nisihara RM, Kotze LM, Utiyama SR, Oliveira NP, Fiedler PT, Messias-Reason IT.Doença celíaca em crianças e adolescentes com síndrome de Down.J Pediatr (Rio J). 2005;81:373-6.
3. Farkas LG, Katic MJ, Forrest CR. Age-related changes in anthropometrics measurements in the craniofacial reginos and in height in Down’s syndrome.J Craniofac Surg. 2002;13: 614-22.
4. Myrelid A, Gustafsson J, Ollars B, Anneren G.Growth charts for Down’s syndrome from birth to 18 years of age.Arch Dis Child. 2002;87:97-103.
5. Styles ME, Cole TJ, Dennis J, Preece MA.New cross sectional stature, weight and head circumference references for Down’s syndrome in the UK and Republic of Ireland.Arch Dis Child. 2002; 87:104-8.
6. Cronk C, Crocker AC, Pueschel SM, Shea AM, Zackai E, Pickens G, et al.Growth charts for children with Down syndrome: 1 month to 18 years of age.Pediatrics. 1988;81:102-10.
7. Chumlea WC, Cronk CE.Overweight among children with trisomy.J Ment Defic Res. 1981;25:275-80.
8. Pastor X, Corretger M, Gassio R, Seres A, Corretger JM. Parámetros somatométricos de referencia de niños y niñas con síndrome de Down visitados en el CMD (Centro Médico Down de la Fundació Catalana Síndrome de Down). SD-DS Revista Médica Internacional sobre el síndrome de Down. 1998;3:9-11.
9. Pastor X, Corretger M, Gassio R, Seres A, Corretger JM. Parámetros somatométricos de referencia de niños y niñas con síndrome de Down visitados en el CMD (Centro Médico Down de la Fundació Catalana Síndrome de Down). SD-DS Revista Médica Internacional sobre el síndrome de Down. 1998;4:9-12.
10. Fernandes A, Mourato AP, Xavier MJ, Andrade D, Fernandes C, Palha M. Characterisation of the somatic evolution of Portuguese children with Trisomy 21 - preliminary results. Downs Synd Res Pract. 2001;6:134-8.
11. Arnell H, Gustafsson J, Ivarsson SA, Anneren G. Growth and puberal development in Down syndrome. Acta Pediatr. 1996;85: 1102-6.
12. Piro E, Pennino C, Cammarata M, Corsello G, Grenci A, Lo Giudice, et al.Growth charts of Down syndrome in Sicily: evaluation of 382 children 0-14 years of age. Am J Med Genet Suppl. 1990;7: 66-70.
13. Cremers MJ, Tweel I, Boersma B, Wit JM, Zonderland M.Growth curves of Dutch children with Down’s syndrome.J Intellect Disabil Res. 1996;40:412-20.
14. Luke A, Sutton M, Schoeller DA, Roizen NJ.Nutrient intake and obesity in prepubescent children with Down syndrome.J Am Diet Assoc. 1996;96:1262-7.
15. Prasher VP.Overweight and obesity amongst Down’s syndrome adults.J Intellect Disabil Res. 1995;39:437-41.
16. Pinheiro FA, Urteaga RC, Canete SG, Atalah SE.Evaluación del estado nutricional en niños con síndrome de Down según diferentes referencias antropométricas.Rev Chil Pediatr. 2003; 74:585-9.
17. Dalpicolo F, Viebig RF, Nacif MA. Avaliação do estado nutricional de crianças com Síndrome de Down. Nutrição Brasil. 2004;3: 336-40.
18. Al Husain M.Growth charts for children with Down’s syndrome in Saudi Arabia: birth to 5 years.Int J Clin Pract. 2003;57: 170-4.
19. Mustacchi Z. Curvas padrão pôndero-estatural de portadores de Síndrome de Down procedentes da região urbana da cidade de São Paulo [Tese]. São Paulo: Universidade de São Paulo; 2002.
20. World Health Organization (WHO). WHO child growth standards: length/height-for-age, weight-for-age, weight-for-length, weight-for-height and body mass index-for-age. Methods and development. WHO (nonserial publication). Geneva: WHO; 2006.
21. de Onis M, Onyango AW, Borghi E, Siyam A, Nishida C, Siekmann J.Development of a WHO growth reference for school-aged children and adolescents.Bull World Health Organ. 2007;85:660-7.
23. World Health Organization (WHO). Physical status: the use and interpretation of anthropometry. WHO Technical Report Series n. 854. Geneva: WHO; 1995.
24. Fraile, BB. Epidemiología clínica aplicada a la toma de decisiones en medicina. Gobierno de Navarra. Departamento de Salud, 2008.http://cfnavarra.es/publicaciones. Access: 12/02/2008. 25. Conselho Nacional de Saúde. Normas envolvendo seres
humanos. Res CNS 196/96. Bioética. 1996;4:7-27.
26. National Center for Health Statistics (NCHS). NCHS growth curves for children birth-18 years, United States. Washington DC: US Department of Health Education and Welfare; 1977.
Correspondence: Rosangela Alves Pereira
Universidade Federal do Rio de Janeiro Instituto de Nutrição Josué de Castro Departamento de Nutrição Social Aplicada
Av. Brigadeiro Trompowsky, s/nº - CCS - BLOCO J - 2º ANDAR - Ilha do Fundão