ORIGINAL
RES
EAR
CH
Correspondence to: Lídia Miranda Barreto – Avenida Alfredo Balena, 190, 2º andar, sala 202 – CEP: 30130-100 – Belo Horizonte (MG), Brasil – E-mail: [email protected] Presentation: Nov. 2012 – Accepted for publication: Aug. 2013 – Financing source: none – Conflict of interests: nothing to declare – Approval at the Ethics Committee n. 0063.0.203.000-10.
ABSTRACT | Respiratory Muscle Strength is an
impor-tant tool to diagnose different disorders. Reference equa-tions considered different populaequa-tions and methodologies. However, there is no agreement on what is the ideal equa-tion to use. The aim of this study was to compare and cor-relate the measured values of maximal respiratory pres-sures with those demonstrated by equations described in literature. The sample consisted of 90 healthy individuals aged from 6 to 12 years old. Anthropometric, spiromet-ric and manometspiromet-ric measurements were performed. The comparison between measured and predicted val-ues was significantly different, showing the mean male maximum inspiratory pressure (MIP) (80.65±26.78) to be higher than that predicted by Wilson et al. (67.40±5.65, p<0.001) and Schmidt et al. (70.69±21.70, p<0.05). The mean male maximum expiratory pressure (MEP) (84.35±23.16) was lower than the one predicted by Domènech-Clar et al. (92.25±16.90, p<0.01) and higher than the one predicted by Schmidt et al. (72.78±13.62 p<0.001). The mean of female individuals’ MIP (76.14±26.08) was higher than that pre-dicted by Wilson et al. (57.96±6.04, p<0.001), Schmidt et al. (68.54±7.08, p<0.01), and Domènech-Clar et al. (67.61±11.17, p<0.01). The mean female MEP (74.55±20.05) was higher than the ones predicted by Wilson et al. (66.65±9.55, p<0.001) and lower than the one predicted by
Comparison of measured and predicted values for
maximum respiratory pressures in healthy students
Comparação dos valores medidos e previstos de
pressões respiratórias máximas em escolares saudáveis
Comparación de los valores medidos y previstos de presiones
respiratorias máximas en escolares sanos.
Lídia Miranda Barreto1, Marco Antônio Duarte1, Sarah Costa Drumond de Oliveira Moura1,
Betânia Luiza Alexandre1, Leonardo Silva Augusto1, Maria Jussara Fernandes Fontes1
Study conducted at the Department of Pediatrics in the Medical School of Universidade Federal de Minas Gerais(UFMG) –
Belo Horizonte (MG), Brazil.
1Department of Pediatrics in the Medical School of UFMG – Belo Horizonte (MG), Brazil.
Domènech-Clar et al. (81.16±14.37, p<0.01). The correlations between measured and predicted values were from low to medium magnitude (range r=0.1 to 0.5) being significant for males when MIP was correlated with that predicted by Wilson et al. (p<0.01) and Domènech-Clar et al. (p<0.05). For females, both correlations were significant (MIP p<0.01; MEP p<0.05). It was concluded that the equations failed to predict the values of maximum respiratory pressures, reinforcing the need for new equations of respiratory muscle strength.
Keywords | muscle strength; reference values; respiratory muscles.
RESUMO | A Força Muscular Respiratória é uma
INTRODUCTION
Respiratory Muscle Strength is deined as the maxi-mum respiratory pressure measured orally and attrib-uted to an efort to generate pressure alterations1,2. It is
measured by assessing the pressure after forced inspira-tion and expirainspira-tion, thus characterizing the maximum inspiratory pressure (MIP) and maximum expiratory pressure (MEP), which indicates the strength of inspi-ratory and expiinspi-ratory muscles, respectively.
he use of a manuvacuometer was described by Black e Hyatt in 1969 as a simple, inexpensive and non-invasive method3,4. his is a diagnostic method5 which
provides guidance to execute the respiratory muscle en-durance training protocol6.
When pressures are diferent from their predicted values, there is possibly a weakness associated with me-chanical disadvantage, thus generating endurance deicit,
7
In order to obtain respiratory pressure values, it is neces-sary to compare the measured values with those predicted for a population, considering the age group. Several factors inluence these values, such as age, gender, nutritional status, and anthropometric and spirometric variables. However, there is great diversity between the reference values found in literature, and this is due to the diferent sample selection criteria, equipment, techniques and population8,9.
According to the review published by Freitas et al., a few studies provide reference equations to predict respiratory muscle strength for healthy children and adolescents10. Among the ones that provide predictive
equations, there are: Wilson et al.11, who used weight
and age as variables in MIP and MEP equations, re-spectively, for both genders11, who used weight, height
and age12. Besides these ones, which are described in
literature, Schmidt et al.13 published an equation for the
Brazilian population which uses variables such as age
13 inspiratória máxima (PImáx) média (80,65±26,78), no sexo
mas-culino, maior que a prevista por Wilson et al. (67,40±5,65; p<0,001) e Schmidt et al. (70,69±21,70; p<0,05). Pressão expiratória máxima (PEmáx) masculina média (84,35±23,16) foi menor que a prevista por Domènech-Clar et al. (92,25±16,90; p<0,01) e maior que a pre-vista por Schmidt et al. (72,78±13,62; p<0,001). Pressão inspiratória máxima feminina média (76,14±26,08) foi maior que a prevista por Wilson et al. (57,96±6,04; p<0,001), Schmidt et al. (68,54±7,08; p<0,01) e Domènech-Clar et al. (67,61±11,17; p<0,01). Pressão expira-tória máxima feminina média (74,55±20,05) foi maior que a pre-vista por Wilson et al. (66,65±9,55; p<0,001) e menor que a prevista por Domènech-Clar et al. (81,16±14,37; p<0,01). As correlações entre valores medidos e previstos foram de baixa a média magnitude (variação entre r=0,1 e 0,5), sendo significativas para o sexo mascu-lino quando a PImáx foi correlacionada à prevista por Wilson et al. (p<0,01) e Domènech-Clar et al. (p<0,05). Já para o sexo feminino, ambas as correlações foram significativas (PImáx p<0,01; PEmáx p<0,05). Concluiu-se que as equações não conseguiram predizer os valores de pressões respiratórias máximas, reforçando a necessida-de necessida-de novas equações necessida-de força muscular respiratória.
Descritores | força muscular; valores de referência; músculos respiratórios.
RESUMEN | La Fuerza Muscular Respiratoria es una herramienta
capaz de diagnosticar diferentes desórdenes. Las ecuaciones de referencia hasta hoy descritas consideran diferentes poblaciones y metodologías. Entre tanto, no hay consenso en cuanto a que ecua-ción es ideal para utilizar. El objetivo de este estudio fue comparar
y correlacionar valores medidos de presiones respiratorias máxi-mas con aquellos previstos por las ecuaciones descritas en la li-teratura. La muestra fue de 90 individuos sanos de 6 a 12 años. Fueron realizadas antropometría, espirometría y manovacuome-tría. La comparación de los valores medidos y previstos difirió sig-nificativamente, presentando presión inspiratoria máxima (PImáx) media (80,65±26,78) , en el sexo masculino, mayor que la prevista por Wilson et al. (67,40±5,65; p<0,001) y Schmidt et al. (70,69±21,70; p<0,05). Presión expiratoria máxima (PEmáx) masculina media (84,35±23,16) menor que la prevista por Domènech-Clar et al. (92,25±16,90; p<0,01) y mayor que Schmidt et al. (72,78±13,62; p<0,001). Presión inspiratoria máxima femenina media (76,14±26,08) mayor que la prevista por Wilson et al. (57,96±6,04; p<0,001), Schmidt et al. (68,54±7,08; p<0,01) y Domènech-Clar et al. (67,61±11,17; p<0,01). Presión expiratoria máxima femenina media (74,55±20,05) mayor que la prevista por Wilson et al. (66,65±9,55; p<0,001) y menor que Domènech-Clar et al. (81,16±14,37; p<0,01). Las correlaciones entre valores medidos y previstos fueron de baja a media magnitud (variación entre r=0,1 y 0,5) siendo significativas para el sexo masculino cuando la PImáx fue correlacionada a la prevista por Wilson et al. (p<0,01) y Domènech-Clar et al. (p<0,05). Para el sexo femenino, ambas correlaciones fueron significativas (PImáx p<0,01; PEmáx p<0,05). Se concluyó que las ecuaciones no consiguieron predecir los valores de presiones respiratorias máxi-mas, reforzando la necesidad de nuevas ecuaciones de fuerza muscular respiratoria.
herefore, considering there is no consensus concern-ing the use of predictive equations of respiratory strength, the objective of this study was to test the eicacy of the equations mentioned in literature, such as the ones es-tablished by Wilson et al.11, Domènech-Clar et al.12 and
Schmidt et al.13, by comparing and correlating their
pre-dictive values with values measured in a population of healthy children and adolescents.
METHODOLOGY
he sample consisted of 90 students aged between 6 and 12 years old, who practiced regular physical ac-tivities, with eutrophic body mass index, non-smokers, without chest wall deformities or pulmonary disease, and normal pulmonary function. he informed con-sent form was signed by parents or adults in charge. Individuals with chronic diseases, cognitive deicit, rheumatic or cardiovascular disorders, chronic pneu-mopathies, acute exacerbation and controlled medica-tion were excluded.
All of the volunteers were enlightened as to the study according to resolution n. 196/96 of the National Health Council. he study was approved by the Research Ethics Committee of Universidade Federal de Minas Gerais (UFMG), protocol n. 0063.0.203.000-10, and data collection began after the protocol was approved and the informed consent form was signed. Afterwards, adults in charge and participants were scheduled for an interview, when anamnesis was conducted. At the end of the study, adults in charge returned to the school for a feedback regarding the results.
Aiming to characterize the studied population, all of the participants were submitted to an evaluation of the respiratory system, anthropometric measurement (weight, height14, arm circumference and triceps
skin-fold15,16), analysis of pulmonary function17,18, and
respi-ratory muscle strength.
For spirometry, a spirometer of the VITATRACE VT 130 brand was used, which traced forced ex-piratory curves and basal resex-piratory cycles, from which values regarding pulmonary functions were determined according to the standardization by the American horacic Society (ATS). he considered acceptance criteria of forced vital capacity (FVC) and reproducibility were: satisfactory beginning of
the test, with retro-extrapolation volume lower than 5% of the FVC or 150 mL17.
In order to measure muscle strength, a porta-ble manovacuometer was used (GER-AR), graded from -300 to +300 cmH20, in the sitting position, with the trunk placed 90º in relation to the hips, supported upper limbs and nose clip. For MIP, the participant performed maximum inspiration from the residual volume (RV), and, to measure MEP, maximum ex-piration starting from the total pulmonary capacity (TPC). here were ive maneuvers, with the registra-tion of peak pressure values, without leakage, with ef-fort sustained for two seconds. An interval of thirty seconds took place between maneuvers, and there were two minute intervals between MIP and MEP. he dif-ference between maneuvers could not surpass 5%. Out of the ive maneuvers, the irst and the last ones were ruled out, so there was an average of the three remain-ing maneuvers3.
he distribution of samples was veriied by the Kolmogorov-Smirnov and/or Shapiro Wilk test. According to distribution, at irst the unpaired t-test was used to compare genders in relation to mean values of variables. In order to compare the means of measured manometric values and those predicted in literature, the post-hoc Student Newman Keuls (SNK) analysis of variance (ANOVA) was used. Pearson’s correlation co-eicient was used to measure the correlation between measured and predicted values by the reference equa-tions. he considered signiicance level was 5%.
RESULTS
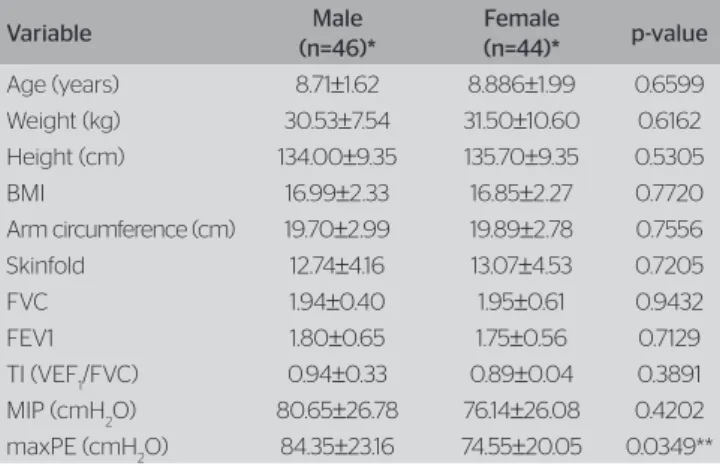
Out of the 90 students, 51.1% (n=46) were males and 48.9% (n=44) were females, with mean age of 8.71±1.62 for the male gender; and 8.88±1.99 for the female gen-der, so there were no diferences in general age, not even among the variables when genders were compared, ex-cept for MEP (p=0.0349) (Table 1).
Table 2 compares the methodology used in this study with that from the authors Wilson et al.11,
Schmidt et al., and Domènech-Clar et al.12
Wilson et al.11 are the only ones who did not use
a nose clip. Besides, the age group was similar to the one used by Domènech-Clar et al.12 he methodology
since it worked with a larger sample and conducted the longest time of sustaining efort (two seconds). Domènech-Clar et al.12 Obtained the highest number
of maneuvers and correlated more independent vari-ables, except when compared to this study.
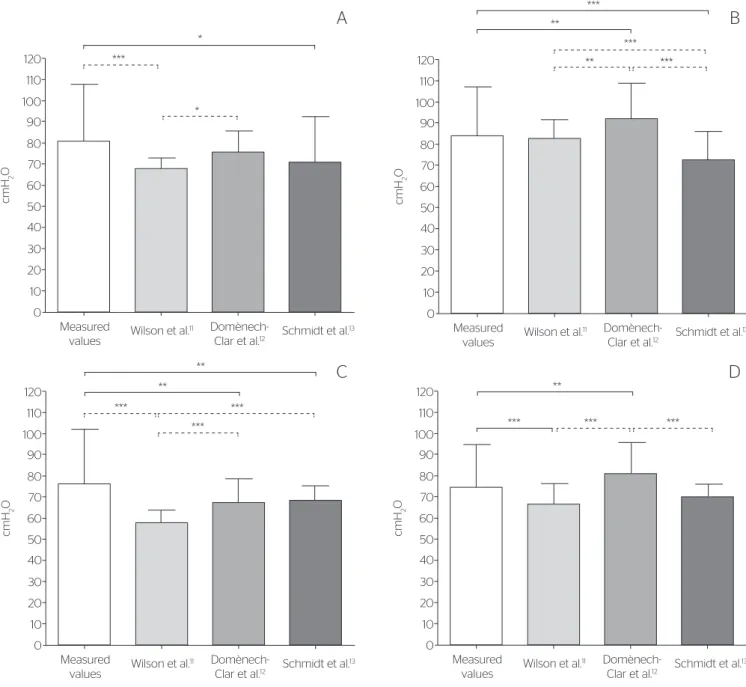
Figure 1 illustrates the comparisons between measured and predicted valus of MIP and MEP among males, represented by Figures 1A and B, and, for females, represented by Figures 1C and D.
In the male gender (Figure 1A), MIP measured values were diferent from the predicted values, and
the measured ones (p<0.0001), as well as those by Domènech-Clar et al.12 (p<0.05) were superior to the
values found by Wilson et al.11; the measured values were
higher than those measured by Schmidt et al.13 (p<0.05).
he MEP was also diferent in the male gender (Figure 1B). Domènech-Clar et al.12 presented values
that were higher than all the others; and measured val-ues (p<0.0001 and those by Wilson et al.11 (p<0.0001)
were higher than the ones by Schmidt et al.13.
As to MIP for the female gender (Figure 1C), the measured and predicted values were also diferent from each other. Measured values were higher to all of the predicted values. he values by Schmidt et al.13
(p<0.0001) and Domènech-Clar et al.12 (p<0.0001)
were higher than the values by Wilson et al.11.
In MEP, also in the female gender (Figure 1D), Domènech-Clar et al.12 presented higher values in
re-lation to all of the others. Besides, measured values (p<0.0001) were higher to those found by Wilson et al.11.
Figure 2 presents dispersion diagrams in the male gender with MIP and MEP measured and predicted by the equations of Wilson et al.11, Domènech-Clar et al.
and Schmidt et al.13, respectively. he MIP values
mea-sured in the male gender presented moderate and sig-niicant association with the values predicted by Wilson et al.11 (r=0.3137 and p=0.00337) and Domènech-Clar Table 1. Comparison between the studied variables according to gender
Variable Male
(n=46)*
Female
(n=44)* p-value
Age (years) 8.71±1.62 8.886±1.99 0.6599
Weight (kg) 30.53±7.54 31.50±10.60 0.6162
Height (cm) 134.00±9.35 135.70±9.35 0.5305
BMI 16.99±2.33 16.85±2.27 0.7720
Arm circumference (cm) 19.70±2.99 19.89±2.78 0.7556
Skinfold 12.74±4.16 13.07±4.53 0.7205
FVC 1.94±0.40 1.95±0.61 0.9432
FEV1 1.80±0.65 1.75±0.56 0.7129
TI (VEF1/FVC) 0.94±0.33 0.89±0.04 0.3891
MIP (cmH2O) 80.65±26.78 76.14±26.08 0.4202
maxPE (cmH2O) 84.35±23.16 74.55±20.05 0.0349**
*Mean±standard deviation;**p<0.05, by the unpaired t test.
BMI: body mass index; FVC: Forced vital capacity; FEV1: forced expiratory volume in the 1st second; IT: Tifeneau Index ;MIP: maximum inspiratory pressure;MEP: maximum expiratory pressure
Table 2. Methodological comparison of the equations proposed by Wilson et al.11, Schmidt et al.13 and Domènech-Clar et al.12 and the methodology used
in this study
A
uthor
A
ge gr
oup
S
ample Body
po
sition
U
se of
no
se clip
V
olume
s
and c
apacitie
s
Number of maneuv
ers
Sus
taining
ef
or
t time
Pr
edic
ted
E
quations
Wilson
et al.11 7–17
235
(137 boys and 98 girls) Sitting No
MIP from RV and
MEP from TPC 3 1 s
Male: PImáx= 44.5+ (0.75 x weight (kg)) e PEmáx=35+ (5.5 x age (years)) Female: PImáx =40+(0.57 x weight (kg)) e
PEmáx=24+(4.8 x age (years))
Schmidt
et al.13 6–14
672
(343 boys and 329 girls) Sitting Yes
MIP from RV and
MEP from TPC 5 2 s
Male: PImáx= -324.296+ -21.833 x age (years)+4.368 x height (cm) e PEmáx= -1.261+
-9.698 x age (years) +2.579 x height (cm) Female: PImáx= 12.989+1.059 x age
(years)+0.34 x height (cm) e PEmáx=53.732+3.702 x age (years)+ -0.122 x
height (cm)
Domènech-Clar
et al.12 8–17
392
(185 boys and 207 girls) Sitting Yes
MIP from RV and
MEP from TPC 3-9 1 s
Male: PImáx= -27.020-(4.132 x age (years))-(0.003 x height (cm) x weight (kg)) e PEmáx= 7.619+(7.806 x age (years))+(0.004 x
height (cm) x weight (kg)) Female: PImáx= -33.854 - (1.814 x age (years))-(0.004 x height (cm) x weight (kg)) e
PEmáx=17.066+(7.22 x age (years))
et al.12 (r=0.3672 and p=0.0121) (Figures 2A and B,
re-spectively). By comparing these with Schmidt et al.13,
the association with measured values had low magni-tude and was not signiicant (r=-0.07535 and p=0.6187) (Fugure 2C). For MEP, measured values presented low magnitude association and no statistical signiicance for the predicted values proposed by the three equations (Figures 2D to F).
Figure 3 presents the same diagrams from the previous igure, however, considering the female gen-der. Measured values of MIP and MEP presented moderate to signiicant association with the values
predicted by all of the analyzed predictive equations (Figures 3A to F).
DISCUSSION
he choice of a reference equation is based on a stan-dardized technique and on the proper selection of the population. However, the chosen equation may not characterize the sample in relation to the found maxi-mum pressures10.
120
110
100
90
80
70
60
50
40
30
20
10
0
Measured values
cmH
2
O
Wilson et al.11
Domènech-Clar et al.12
Schmidt et al.13
*
*
*** 120
110
100
90
80
70
60
50
40
30
20
10
0
Measured values
cmH
2
O
Wilson et al.11
Domènech-Clar et al.12
Schmidt et al.13
**
** ***
*** ***
120
110
100
90
80
70
60
50
40
30
20
10
0
Measured values
cmH
2
O
Wilson et al.11
Domènech-Clar et al.12
Schmidt et al.13
**
***
*** ***
**
120
110
100
90
80
70
60
50
40
30
20
10
0
Measured values
cmH
2
O
Wilson et al.11
Domènech-Clar et al.12
Schmidt et al.13
**
*** ***
***
A
C
B
D
*p<0.05; **p<0.01; ***p<0.001. n=46 (male gender); n=44 (female gender). Mean±standard deviation compared by the analysis of variance post-hoc Student Newman Keuls
Pearson’s linear correlation. n=46
Figure 2. Dispersion diagrams of maximum inspiratory pressure (A, B and C) and maximum expiratory pressure among males (D, E and F) measured and
predicted by the equations proposed by Wilson et al.11, Domènech-Clar et al.12 and Schmidt et al.13, respectively
120 140 160 180 100 80 60 40 20 0 Me asur ed V alues (cmH 2 O)
120 140 160 180 100 80 60 40 20 0
Predicted Values (cmH2O) - Wilson et al. 11 R=0.3137 p=0.00337 120 140 160 180 100 80 60 40 20 0 M e asur ed V alu es ( cmH 2 O)
120 140 160 180
100 80 60 40 20 0
Predicted Values ( cmH
2O) - Domènech-Clar et al.
12 R=0.3672 p=0.0121 120 140 160 180 100 80 60 40 20 0 Me asur ed V alues (cmH 2 O)
120 140 160 180 100 80 60 40 20 0
Predicted Values (cmH2O) - Schmidt et al. 13 R=0.07535 p=0.6187 120 140 160 180 100 80 60 40 20 0 Me asur ed V alues (cmH 2 O)
120 140 160 180 100 80 60 40 20 0
Predicted Values (cmH2O) - Wilson et al. 11 R=0.2101 p=0.1611 120 140 160 180 100 80 60 40 20 0 Me asur ed V alues (cmH 2 O)
120 140 160 180
100 80 60 40 20 0
Predicted Values (cmH2O) - Domènech-Clar et al.12
R=0.2313 p=0.1219 120 140 160 180 100 80 60 40 20 0 M e asur ed V alues (cmH 2 O)
120 140 160 180 100 80 60 40 20 0
Predicted Values (cmH2O) - Schmidt et al.13
120 140 160 180 100 80 60 40 20 0 Me asur ed V alues (cmH 2 O)
120 140 160 180 100 80 60 40 20 0
Predicted Values (cmH2O) - Wilson et al.11
R=0.4423 p=0.0026 120 140 160 180 100 80 60 40 20 0 Me asur ed V alues (cmH 2 O)
120 140 160 180
100 80 60 40 20 0
Predicted Values (cmH2O) - Domènech-Clar et al.
12 R=0.4617 p=0.0016 120 140 160 180 100 80 60 40 20 0 Me asur ed V alues (cmH 2 O)
120 140 160 180 100 80 60 40 20 0
Predicted Values (cmH2O) - Schmidt et al.13
R=0.4631 p=0.0015 120 140 160 180 100 80 60 40 20 0 Me asur ed V alues (cmH 2 O)
120 140 160 180 100 80 60 40 20 0
Predicted Values (cmH2O) - Wilson et al.11
R=0.3628 p=0.0155 120 140 160 180 100 80 60 40 20 0 Me asur ed V alues (cmH 2 O)
120 140 160 180
100 80 60 40 20 0
Predicted Values (cmH2O) - Domènech-Clar et al.
12 R=0.3628 p=0.0155 120 140 160 180 100 80 60 40 20 0 Me asur ed V alues (cmH 2 O)
120 140 160 180 100 80 60 40 20 0
Predicted Values (cmH2O) - Schmidt et al. 13 R=0.3694 p=0.0136
A
C
E
B
D
F
Pearson’s linear correlation. n=44
Figure 3. Dispersion diagrams of maximum inspiratory pressure (A, B and C) and maximum expiratory pressure among females (D, E and F), measured
Studies describe that the discrepant values predict-ed in literature are causpredict-ed by diferent methodologies, used mouthpiece, maneuvers, location and population19.
Selection, sample, equipment and techniques are also variable factors9.
By comparing the methodology of the mentioned equations and this study, the position of the tests was similar. In Wilson et al.11, predicted values were lower
to the others, which could have been caused by not using the nose clip and aerial escape.
Efort sustaining time ranged from one to three sec-onds, and all of them began MIP from RV, and max EP from TPC, and such measurement is established by the ATS. Literature shows that, when the measurement of MIP and MEP is originated from RV and TPC, re-spectively, and also in the functional residual capacity (FRC), there are diferent results since the elastic gath-ering does not participate in the inal measurement20.
Sample selection also influences the variabil-ity of MIP and MEP final values9. This study
and the equations found in literature presented similar criteria. Besides, the sample was random-ized in Wilson et al.11 and Domènech-Clar et al.12
In Schmidt et al.13, no randomization is described,
which may have interfered with the generalization of results. This study was not randomized.
Sample size varied among the studies. his study and the predictive equations were diferent, and not all of them conducted a previous sample calculation. Another difer-ence in sample selection is the classiication of “healthy” subjects. In Wilson et al.11, Domènech-Clar et al.12 and
in this study, participants underwent spirometry in order to prove the absence of respiratory disorders, which did not happen in Schmidt et al.13.
he number of maneuvers ranged from three to nine, considering the learning efect. Some authors recommend three to ive maneuvers in other to ob-tain three acceptable ones and two reproducible ones, with diference lower than 5%21. his study performed
the measurements according to the guidelines pro-posed by the Brazilian Society of Pneumology and Tisiology (SBPT)18.
As to gender, studies demonstrate that the strength is more present in the male gender12,20,22,23. In the three
equations, as well as in values measured in this study, when analyzing normality values, all of the respiratory pressure equations are higher among boys, and MEP values are higher than MIP values in both genders.
even in studies with diferent populations at diferent age groups20.
As to the correlations between variables, we observed there was some statistical signiicance between mano-metric variables with anthropomano-metric and spiromano-metric variables. From the diferences found in measured and predicted values, the need to create new equations that could better relect respiratory strength in the popula-tion involved came up.
Population is another factor that inluences respira-tory pressure. When we compare the values predicted by Schmidt et al.13 for a sample in Rio Grande do Sul
with the ones measured in this study, there is a dif-ference between them, which leads to the conclusion that these reference values were not able to predict the values obtained for the respiratory pressures of the as-sessed population — which indicates that predictive equations can go through variations between individu-als from diferent ethnic groups24, diferent countries
or even in the same country25. he indings are in
ac-cordance with those by Parreira et al.5, who compared
values of the healthy Brazilian population in the state of Minas Gerais with those predicted by the equation of Neder et al.26, from a sample from São Paulo, and
these values were also diferent.
herefore, in order for measured and predicted values to be similar, it is important that there is cor-relation between measurements, however, without statistically signiicant diferences. So, it is possible to conclude that the reference values proposed by the equations of Wilson et al.11, Domènech-Clar et al.12
and Schmidt et al.13 were not good respiratory
strength predictors in the studied population, thus reinforcing the need to establish normality values for populations of children and adolescents from difer-ent regions in Brazil.
REFERENCES
1. Leith DE, Bradley M. Ventilatory muscle strength and endurance
training. J Appl Physiol. 1976;41(4):508-16.
2. Shafer TH, Wolfson MR, Bhutani VK. Respiratory muscle function, assessment, and training. Phys Ther. 1981;61(12):1711-23.
5. Neder JA, Andreoni S, Castelo-Filho A, Nery LE. Reference values for lung function tests. I. Static volumes. Braz J Med Biol Res. 1999;32(6):703-17.
6. Costa D, Sampaio LM, Lorenzzo VA, Jamami M, Damaso AR. Avaliação da força muscular respiratória e amplitudes torácicas e abdominais após a RFR em indivíduos obesos. Revi Latinoam Enferm. 2003;11(2):156-60.
7. Monteiro JGB, Fernandes LC, Machado O. Atuação Fisioterapêutica no
Comprometimento Cardiorespiratório na Sindrome de Guillain-Barré: Relato de Caso. São Paulo: Hospital Nossa Senhora da Penha; 2003.
8. ATS. Lung function testing: selection of reference values and interpretative strategies. American Thoracic Society. Am Rev Respir Dis. 1991;144(5):1202-18.
9. Pereira CAC. Espirometria. Jornal de Pneumologia. 2002;8 Suppl(3):S1-82.
10. Freitas DA, Borja RO, Ferreira GM, Nogueira PA, Mendonça KM. Equações preditivas e valores de normalidade para pressões respiratórias máximas na infância e adolescência. Rev Paul Pediatr. 2011;29(4):656-62.
11. Wilson SH, Cooke NT, Edwards RH, Spiro SG. Predicted normal values for maximal respiratory pressures in caucasian adults and children. Thorax. 1984;39(7):535-8.
12. Domènech-Clar R, López-Andreu JA, Compte-Torrero L, De Diego-Damiá A, Macián-Gisbert V, Perpiñá-Tordera M, et al. Maximal static respiratory pressures in children and adolescents. Pediatr Pulmonol. 2003;35(2):126-32.
13. Schmidt R, Donato CRF, Valle PHC, Costa D. Avaliação da força muscular respiratória em crianças e adolescentes. Práxis - Rev Fisioter Univers Cruz Alta. 1999;1(1):41-54.
14. Conde WL, Monteiro CA. Valores críticos do índice de massa corporal para classificação do estado nutricional de crianças e adolescentes brasileiros. J Pediatr. 2006;82:266-72.
15. Frisancho AR. Triceps skin fold and upper arm muscle size norms for assessment of nutrition status. Am J Clin Nutr. 1974;27(10):1052-8.
16. Frisancho AR. New norms of upper limb fat and muscle areas for assessment of nutritional status. Am J Clin Nutr. 1981;34(11):2540-5.
17. ATS. Standardization of Spirometry, 1994 Update. American Thoracic Society. Am J Respir Crit Care Med. 1995;152(3):1107-36.
18. SBPT. Sociedade Brasileira de Pneumologia e Tisiologia. Diretrizes para Testes de Função Pulmonar. J Pneumol. 2002;28:1-221.
19. Bruschi C, Cerveri I, Zoia MC, Fanfulla F, Fiorentini M, Casali L, et al. Reference values of maximal respiratory mouth pressures: a population-based study. Am Rev Respir Dis. 1992;146(3):790-3.
20. Gaultier C, Zinman R. Maximal static pressures in healthy children. Respir Physiol. 1983;51(1):45-61.
21. Szeinberg A, Marcotte JE, Roizin H, Mindorf C, England S, Tabachnik E, et al. Normal values of maximal inspiratory and expiratory pressures with a portable apparatus in children, adolescents and young adults. Pediatr Pulmonol. 1987;3(4):255-8
22. Harik-Khan RI, Wise RA, Fozard JL. Determinants of maximal inspiratory pressure. The Baltimore Longitudinal Study of Aging. Am J Respir Crit Care Med. 1998;158(5 Pt 1):1459-64.
23. Matecki S, Prioux J, Jaber S, Hayot M, Prefaut C, Ramonatxo M. Respiratory pressures in boys from 11-17 years old: a semilongitudinal study. Pediatr Pulmonol. 2003;35(5):368-74.
24. Evans JA, Whitelaw WA. The assessment of maximal respiratory mouth pressures in adults. Respir Care. 2009;54(10):1348-59.
25. Leal AH, Hamasaki TA, Jamami M, Di Lorenzo VA, Pessoa BV. Comparação entre valores de força muscular respiratória medidos e previstos por diferentes equações. Fisioter Pesq. 2007;14(3):25-30.