Canthaxanthin biosynthesis by
Dietzia natronolimnaea
HS-1: effects of inoculation
and aeration rate
Forouzan Rostami
1,2, Seyed Hadi Razavi
1,2, Abbas Akhavan Sepahi
3,
Seyed Mohammad Taghi Gharibzahedi
1,21
Bioprocess Engineering Laboratory, Department of Food Science & Engineering, Faculty of Agricultural Engineering and Technology, University of Tehran, Karaj, Iran.
2
Iranian Center of Excellence for Application of Modern Technologies for Producing Functional Foods and Drinks, University of Tehran, Karaj, Iran.3
Iranian Center of Excellence for Application of Modern Technologies for Producing Functional Foods and Drinks, University of Tehran, Karaj, Iran.
Submitted: March 4, 2013; Approved: September 9, 2013.
Abstract
The interest in production of natural colorants by microbial fermentation has been currently in-creased. The effects of D-glucose concentration (3.18-36.82 g/L), inoculum size (12.5 x 10⁹-49.5 x 10⁹ cfu cells/mL) and air-flow rate (1.95-12.05 L/L min) on the biomass, total carotenoid and canthaxanthin (CTX) accumulation of Dietzia natronolimnaeaHS-1 in a batch bioreactor was scru-tinized using a response surface methodology-central composite rotatable design (RSM-CCRD). Second-order polynomial models with highR2values ranging from 0.978 to 0.990 were developed for the studied responses using multiple linear regression analysis. The models showed the maximum cumulative amounts of biomass (7.85 g/L), total carotenoid (5.48 mg/L) and CTX (4.99 mg/L) could be achieved at 23.38 g/L of D-glucose, 31.2 x 10⁹cfu cells/mL of inoculation intensity and air-flow rate of 7.85 L/L min. The predicted values for optimum conditions were in good agreement with ex-perimental data.
Key words: Dietzia, microbial canthaxanthin, batch bioreactor, response surface methodology, modeling.
Introduction
Recently, penetration of the fermentation-derived components into the various industries, especially food in-dustry, is increasing in throughout the world. Carotenoids possess significant biological activities physiological func-tions in the prevention of cancer and heart diseases by quenching free radicals or singlet oxygen, enhancing in vi-tro antibody production, as well as providing visual sys-tems with precursors of vitamin A (Veiga-Crespo et al., 2005; Gharibzahediet al., 2014a, 2014b). They as an im-portant class of bioactive compounds are responsible for bright yellow/orange colors of different plants, microor-ganisms and animals (Asker and Ohta, 1999). Production of carotenoids from microorganisms because of the
selec-tivity of the biological reactions is preferred to those pro-duced by chemical synthesis (Gharibzahediet al., 2013a). Canthaxanthin (CTX,b-b-carotene-4,4-dione) is a ubiqui-tous keto-carotene that is of substantial industrial interest because of its widespread applications in nutraceutical, cosmetic, food and feed industries (Veiga-Crespoet al., 2005). The microbial sources of CTX production has been reviewed by Nasri Nasrabadi and Razavi (2010b). Among the introduced sources such as Corynebacterium michiganense, Micrococcus roseus, Brevibacterium sp. KY-4313, Bradyrhizobium strain ORS278, Gordonia jacobaea, green micro-algae (Chlorococcum sp. strain MA-1,Chlorella zofingiensisandChlorella emersonii) and an extremely halophilic archaeon (Haloferax
Send correspondence to S.H. Razavi. Bioprocess Engineering Laboratory, Department of Food Science & Engineering, Faculty of Agricultural Engi-neering and Technology, University of Tehran, P.O. Box 4111, 31587-77871 Karaj, Iran. E-mail: srazavi@ut.ac.ir.
alexandrinus), theDietzia natronolimnaeaHS-1 is recog-nized as a promising producer of natural CTX (Khodaiyan
et al., 2007; Kumaret al., 2011). This bacterium is Gram positive, catalase positive, and oxidase negative with or-ange colonies that isolated during a routine screening of pigmented microorganisms (Duckworthet al., 1998). This CTX-synthesizing bacterium is aerobe and the aeration rate in the culture is a necessary parameter to assimilate the sub-strate as well as for growth rate, cell mass and carotenoids synthesis (Razaviet al., 2007). Moreover, increasing inoc-ulation rates alleviates fermentation problems caused by limited nitrogen (O’Connor-Cox and Ingledew, 1991). This factor can also increase the bacterial growth rate and can provide high-yield synthesis of carotenoid pigments (O’Connor-Cox and Ingledew, 1991).
Khodaiyanet al.(2007) studied the effects of differ-ent culture parameters including carbon sources, tempera-ture, initial pH of cultempera-ture, NaCl concentration, and light on the growth and CTX production by D. natronolimnaea
HS-1. They reported that numerical optimization of pH, whey-lactose concentration and yeast extract can consider-ably increase CTX production by this bacterium in shake flask cultures (Khodaiyanet al., 2008). To the best of our knowledge, there is no specific study on the effect of vari-ous rates of aeration and inoculation on CTX production by
D. natronolimnaeaHS-1. However, influence of aeration on the production of carotenoid pigments bySporidiobolus salmonicolor (CBS 2636) and Rhodotorula rubra-lactobacillus caseisubsp.caseico-cultures in a bioreactor were previously reported (Simovaet al., 2003; Valdugaet al., 2011).
With response surface methodology (RSM), several variables are examined simultaneously with a minimum number of trials, according to experimental designs, which enables to find interactions between variables (Myers and Montgomery, 2002). RSM also has the advan-tage of being less expensive and time-consuming than the classical methods. This methodology has been generally discussed in the literature for optimizing different fermen-tation processes (Kumaret al., 2011; Yaakobet al., 2011; Leeet al., 2012).
Therefore, the aim of this work was to optimize the effects of air-flow rate, inoculation intensity and glucose concentration on the improvement of biomass, total caro-tenoid, CTX production fromD. natronolimnaeaHS-1 in a batch bioreactor.
Materials and Methods
Reagents and materials
D-glucose, yeast extract, peptone, malt extract, agar, iron as FeCl36H2O, and Antifoam 204 were purchased from Sigma-Aldrich (Sigma-Aldrich Co., United States). The pure ethanol (99.9%, v/v) and CTX standard were provided by the Bidestan Company (Qazvin, Iran) and the
Bio-process Engineering Laboratory (BPEL) (University of Tehran, Iran), respectively. Methanol and acetonitrile (HPLC grade) were supplied from Merck (Darmstadt, Ger-many).
Source microorganism and culture conditions
The strain of bacterium D. natronolimnaea HS-1 (DSM 44860) used in this work was obtained from Bioprocess Engineering Laboratory (BPEL), University of Tehran, Iran. It was kept on yeast/malt agar (YMA) plates containing 10 (g/L) glucose, 5 (g/L) yeast extract, 5 (g/L) peptone, 3 (g/L) malt extract and 15 (g/L) agar at pH 7.2. Every month, single colonies were transferred to a fresh plate, incubated for 4 days, and then maintained under re-frigeration at 0 to 4 °C (Nasri Nasrabadi and Razavi, 2010a).
Inoculum preparation
Pure cultures of the strain ofD. natronolimnaeaHS-1 from the YMA were transferred into 500-mL Erlenmeyer flasks containing 100 mL of a GPY medium (per liter: 10 g glucose, 10 g peptone, 6 g yeast extract) as previously de-scribed by Khodaiyanet al.(2007). The flasks were inocu-lated with a loopful of the bacterium D. natronolimnaea
HS-1 from an agar plate and incubated in an orbital incuba-tor (model Stuart S150; Staffordshire, UK) at 180 rpm and 28±2 °C. After 72 h, they applied to inoculate in a batch fermentation bioreactor.
Cultivation medium
Preliminary investigation demonstrated that the strain ofD.natronolimnaeaHS-1 was able to use D-glucose as an ideal carbon source for the CTX production. 10.0 mL of the prepared inoculum into 500-mL Erlenmeyer flasks contain-ing 100 mL growth medium with 10 g/L pepton, 6 g/L yeast extract, 30 ppm Fe3+and D-glucose as carbon source at var-ious concentration (3.18, 10, 20, 30 and 36.82 g/L) was added. Then, they were incubated in a rotary shaker (180 rpm) under constant illumination (600±50 lux) pro-vided by cool white fluorescent lamps (30W, Resell-Shark, Switzerland) (Razaviet al., 2007). Subsamples were peri-odically harvested during a 7-day period.
three-factor central composite rotatable design (CCRD, Tables 1 and 2). Samples during certain times were withdrawn from the batch fermenter to evaluate the growth rate and level of CTX production.
Analytical methods
Biomass dry weight and glucose content determination
In order to determine biomass dry weight (BDW), a concentrated cell suspension was diluted with a suitable amount of the synthetic mineral medium to give an optical density (OD) ranging from 0.1 to 1.0 when measured at 600 nm. A portion (10 mL) of each dilution was filtered through a marked, dried (at 65 °C for 12 h) and pre-weighed membrane filter (Sigma-Aldrich Co., pore diameter 0.2mm, USA). All filters were then dried at 105 °C to con-stant weight (48 h) and placed in a desiccator to cool down. The biomass dry weight was calculated as the difference of the filter weight before and after the procedure. Finally, the calibration curve was constructed as the dependence of the OD on the BDW concentration (Gharibzahedi et al., 2012b). Glucose concentration was also assayed by the Miller method using 3,5-dinitrosalisylic acid (DNS) on cell-free supernatants filtered through 0.2mm filters (Mil-ler, 1959).
Carotenoid extraction and pigment analysis
Aliquots (10-mL) of cultures at the appropriate times during the fermentation process were taken from the bio-reactor and centrifuged at 7500g(2-4 °C) for 7.5 min. The supernatant to measure the glucose content was collected. Then, the cell pellets were washed twice with physiological water (NaCl; 9 g/L in deionized water) and centrifuged again. These cells were resuspended three times in 3 mL of pure ethanol by vortexing for 5 min and centrifuged again to extract the pigment. A water bath (45 °C) was also used to completely extract the pigments. The carotenoid extracts were subsequently filtered through a 0.2mm hydrophobic fluorophore membrane (Sigma-Aldrich Co., USA). The absorbance of the total carotenoid content was determined using a UV-visible spectrophotometer (U-5100 model, Hitachi, Japan) at 474 nm. Total carotenoid content was calculated by using the formula (Eq. 1) recommended by Nasri Nasrabadi and Razavi (2010b):
Total carotenoid ( g / L)
1 cm 1%
m = ´ ´
´ A V A s 474 9 10 100 (1)
whereA474,Vs andA1 cm 1%
are the absorbance maximum of total carotenoid in ethanol, the volume of sample solution, and the specific absorption coefficient of total carotenoid for a 1% solution in a 1 cm cell (in ethanol,A1 cm
1%
), respec-tively.
A Knauer (Berlin, Germany) HPLC system including a k-1001 HPLC pump, a k-1001 solvent organizer, an on-line degasser, a dynamic mixing chamber and a
UV-visible detector (K-2600, Knauer, Germany) was used for the determination of individual carotenoids according to the modified method of Razaviet al.(2006). The separation was performed on a Lichrospher 100 RP-18 silica column (5.0 mm, 250 x 4 mm) at 35 °C. The isocratic mobile phase used was acetonitrile/methanol (80:20, v/v) at a flow rate of 2 mL/min.
Experimental design and statistical analysis
The Design Expert (Trial Version 7.1.3, Stat-Ease Inc., Minneapolis, MN, USA) was used for regression and graphical analyzes of the data obtained. RSM was chosen as the method for the software to calculate the optimum value in the software. The effects of three parameters of glucose concentration (10-30 g/L,X1), inoculation intensity (20 x 109-42 x 109 cfu cells/mL, X2) and aeration rate (4-10 L/L min,X3) on the biomass (Y1), total carotenoid (Y2) and CTX (Y3) of produced by D. natronolimnaea HS-1 were evaluated. Twenty treatments were conducted based on the central composite rotatable design (CCRD), each at five coded levels -1.68, -1, 0, 1 and 1.68 (Table 1). Experi-ments were randomized in order to minimize the effects of unexplained variability in the actual responses due to extra-neous factors. The center point was repeated six times to calculate the repeatability of the method (Myers and Mont-gomery, 2002; Gharibzahedi et al., 2013c). The applied design was integrated to (i) determine a reasonable rela-tionship between three independent variables and each re-sponse, and (ii) to find the optimum level of the independ-ent variables resulting in the desirable objectives. Multiple regression coefficients were determined by employing the least-squares technique to predict linear and polynomial models for the response variable (Myers and Montgomery, 2002). The behaviour of the response surface was evaluated for the response function (Yi, the predicted response) using the regression polynomial equation. The generalized poly-nomial model proposed for predicting the response vari-ables is given as:
Y k kixi x x x
i
kii i i
kij i j i j
= + + +
= = < =
å
å
å
b 0 b b b
1 4 2 1 4 2 4 (2)
whereYis the predicted response;bk0,bki,bkii andbkij rep-resent regression coefficients; andxi,xjare the coded
inde-pendent factors.
The suitability of the fit of the polynomial model equation was tested by theR2 (coefficient of determina-tion), adjusted-R2(R2-adj), coefficient of variation (CV), the prediction error sum of squares (PRESS) and adequate precision (ADP). ThePRESSstatistic and ADP are calcu-lated as were previously reported by Gharibzahedi et al.
(2013b).
(zero) values to two of the three variables and solving the fitted equations as a quadratic equation in the remaining one variable. Subsequently, five additional experiments were conducted to verify the validity of the statistical ex-perimental strategies.
Results and Discussion
Model fitting
The levels of factors (glucose concentration (X1), in-oculation intensity (X2) and aeration intensity (X3)) and the effect of their interactions on the production of biomass, to-tal carotenoid and CTX were determined through the RSM-CCRD. Twenty experiments were performed at dif-ferent combinations of the factors (Table 2). Regression analysis and ANOVA were applied for fitting the models
and to evaluate the statistical significance of the terms. The estimated regression coefficients of the polynomial models for the response variables, along with the correspondingR2, R2-adj, CV, PRESS and ADP are illustrated in Table 3. The mathematical models for the biomass (Y1), total carotenoid (Y2), and CTX (Y3) levels with the coefficients in actual val-ues were expressed as follows:
Y1= 7.71 + 0.54X1+ 0.33X3- 0.84X12- 0.35X22
-0.87X32+ 0.25X1X2+ 0.29X1X3 (3)
Y2= 5.28 + 0.50X1+ 0.15X2+ 0.12X3- 0.66X12
-0.45X22- 0.33X32- 0.25X2X3 (4)
Y3= 4.91 + 0.38X1+ 0.21X3- 0.70X12- 0.45X22
-0.40X32- 0.13X1X2- 0.11X2X3 (5)
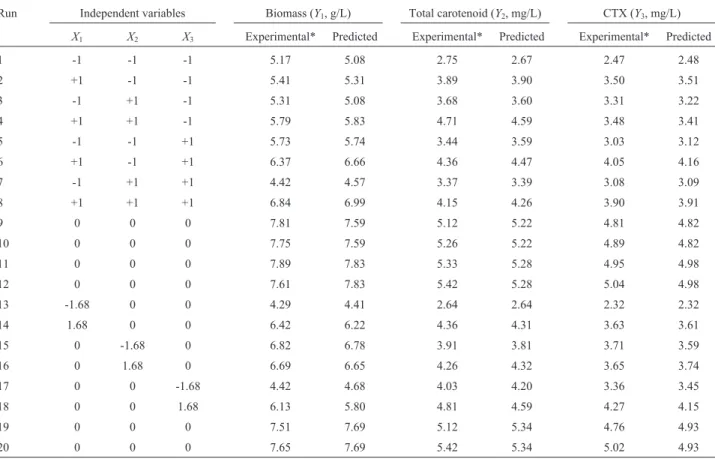
Table 2- Experimental design with the observed responses and predicted values for the production of biomass, carotenoid and CTX using RSM-CCRD.
Run Independent variables Biomass (Y1, g/L) Total carotenoid (Y2, mg/L) CTX (Y3, mg/L)
X1 X2 X3 Experimental* Predicted Experimental* Predicted Experimental* Predicted
1 -1 -1 -1 5.17 5.08 2.75 2.67 2.47 2.48
2 +1 -1 -1 5.41 5.31 3.89 3.90 3.50 3.51
3 -1 +1 -1 5.31 5.08 3.68 3.60 3.31 3.22
4 +1 +1 -1 5.79 5.83 4.71 4.59 3.48 3.41
5 -1 -1 +1 5.73 5.74 3.44 3.59 3.03 3.12
6 +1 -1 +1 6.37 6.66 4.36 4.47 4.05 4.16
7 -1 +1 +1 4.42 4.57 3.37 3.39 3.08 3.09
8 +1 +1 +1 6.84 6.99 4.15 4.26 3.90 3.91
9 0 0 0 7.81 7.59 5.12 5.22 4.81 4.82
10 0 0 0 7.75 7.59 5.26 5.22 4.89 4.82
11 0 0 0 7.89 7.83 5.33 5.28 4.95 4.98
12 0 0 0 7.61 7.83 5.42 5.28 5.04 4.98
13 -1.68 0 0 4.29 4.41 2.64 2.64 2.32 2.32
14 1.68 0 0 6.42 6.22 4.36 4.31 3.63 3.61
15 0 -1.68 0 6.82 6.78 3.91 3.81 3.71 3.59
16 0 1.68 0 6.69 6.65 4.26 4.32 3.65 3.74
17 0 0 -1.68 4.42 4.68 4.03 4.20 3.36 3.45
18 0 0 1.68 6.13 5.80 4.81 4.59 4.27 4.15
19 0 0 0 7.51 7.69 5.12 5.34 4.76 4.93
20 0 0 0 7.65 7.69 5.42 5.34 5.02 4.93
* Mean of triplicate determinations.
Table 1- Experimental domain of central composite rotatable design (CCRD).
Independent variables Unit Symbol Coded variables levels
Uncodified Codified -1.682 (-a) -1 0 +1 +1.682 (+a)
Glucose concentration g/L X1 x1 3.18 10 20 30 36.82
Inoculation intensity x 109cfu cells/mL X2 x2 12.5 20 31 42 49.5
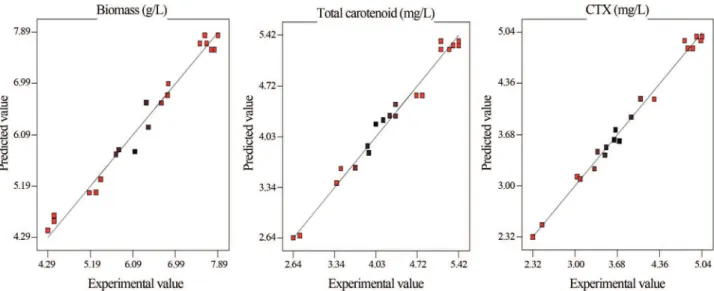
The statistical analysis showed that the polynomial models were adequate (p < 0.0001), showing no significant lack-of-fit (p > 0.05) with very satisfactory values ofR2for all responses. TheR2values for biomass, total carotenoid and CTX were 0.97, 0.98 and 0.99, respectively (Table 3); indicating that a high percentage of response variations were explained by the response surface models. It should be noted that adding a variable to the model will always in-creaseR2, regardless of whether the additional variable is statistically significant or not. A high value ofR2does not always imply the adequacy of the model. Therefore, it is more suitable to apply an adj-R2of over 90% to evaluate the model adequacy (Gharibzahediet al., 2012a, 2012b). The adj-R2values were found to be 0.95, 0.96 and 0.98 for bio-mass, total carotenoid and CTX, respectively (Table 3). The low PRESS (1.27-7.10) values propose for the ade-quacy of the fitted quadratic models for predictive applica-tions (Table 3). The CV values were 4.34, 4.13 and 3.24 for biomass, total carotenoid and CTX, respectively (Table 3). ADP measures the signal-to-noise ratio. A ratio greater than four is desirable (Gharibzahedi et al., 2012b). The ADP amounts for the proposed models were between 16.16 and 27.51. The comparison between the actual response
values obtained from experimental data and the predicted response values based on the quadratic regression models is depicted in Figure 1a-c. This figure demonstrates that the models cover the experimental range of studies suffi-ciently.
Biomass production
The results illustrated in Table 3 show that linear D-glucose concentration and aeration rate had significant effects on the biomass (p < 0.0001; p < 0.01). Quadratic effects of all independent variables were also significant (Table 3). Moreover, the interactions of D-glucose concen-tration-inoculum size and D-glucose concentration-aera-tion rate were significant (Figures 2a and b). Based on the sum of squares, the importance of the independent vari-ables on the biomass production by D. natronolimnaea
HS-1 could be ranked in the following order: aeration rate > D-glucose concentration > inoculation intensity. SinceD. natronolimnaeaHS-1 is a strictly aerobic microorganism, the high aeration supplied better homogeneity in the culture medium during submerged fermentation, and more avail-ability of nutrients and oxygen, leading to higher produc-tion of biomass (Frengova and Beshkova, 2009; Valdugaet
Table 3- ANOVA and regression coefficients of the second-order polynomial models for the response variables.
Source DF Biomass (Y1, g/L) Total carotenoid (Y2, mg/L) CTX (Y2, mg/L)
Coefficient Sum of squares
p-value Coefficient Sum of squares
p-value Coefficient Sum of squares
p-value
Model 9 7.71 26.59 < 0.0001 5.28 13.57 < 0.0001 4.91 13.25 < 0.0001
Linear
b1 1 0.54 3.97 < 0.0001 0.50 3.35 < 0.0001 0.38 2.01 < 0.0001
b2 1 - 0.02 ns 0.15 0.31 0.01 - 0.03 ns
b3 1 0.33 1.52 0.002 0.12 0.19 0.04 0.21 0.59 0.0003
Quadratic
b11 1 -0.84 10.17 < 0.0001 -0.66 6.23 < 0.0001 -0.70 6.97 < 0.0001
b22 1 -0.35 1.72 0.001 -0.45 2.93 < 0.0001 -0.45 2.87 < 0.0001
b33 1 -0.87 10.87 < 0.0001 -0.33 1.59 0.0001 -0.40 2.29 < 0.0001
Interaction
b12 1 0.25 0.51 0.03 - 0.007 ns -0.13 0.14 0.01
b13 1 0.29 0.68 0.01 - 0.02 ns - 0.05 ns
b23 1 - 0.23 ns -0.25 0.52 0.003 -0.11 0.11 0.03
Residual 8 0.60 0.25 0.13
Lack- of-fit 5 0.55 0.077 0.19 0.305 0.08 0.460
Pure error 3 0.05 0.06 0.04
Total 19 27.42 13.84 13.45
R2 0.978 0.981 0.990
Adj-R2 0.953 0.961 0.980
CV (%) 4.34 4.13 3.24
PRESS 7.10 2.68 1.27
al., 2011). The carbon substrate provides the energy neces-sary for product formation through intermediary metabo-lism. Thus, an increase in sugar concentration will result in a proportional increase in biomass (Gharibzahedi et al., 2012a, 2012b). However, the reduction of biomass at con-centrations higher than 23 g/l may be explained by the fact that the substrate inhibition (Figures 2a and b). The individ-ual optimum condition indicated that maximum biomass production (7.85 g/L) by D. natronolimnaea HS-1 in a batch bioreactor would be obtained at D-glucose concen-tartion of 23.67 g/L, inoculation intensity of 31.16 x 10⁹cfu cells/mL and aeration rate of 7.76 L/L min using response surface plots and response optimizer.
Carotenoid production
Table 3 indicates that all linear and quadratic terms of independent variables have significant effect (p < 0.05; p < 0.001; p < 0.0001) on the total carotenoid. As shown in Table 3, the quadratic effect of D-glucose concentartion followed by the linear effect of D-glucose concentartion demonstrateed the most significant (p < 0.05) effect on the changes of total carotenoid value. The bacterium rapidly consumed D-glucose for providing the required ATP for cell growth. The glucose concentration is one of the most important variables in fermentation ofBlakeslea trispora
for the biosynthesis ofb-carotene (Choudari and Singhal, 2008). Aksu and Eren (2007) also reported that an increase in the rates of carotenoids formation byR. glutinis from 14.2 to 69 mg/L by increasing the glucose concentration from 2.5 to 20 g/L. It showed only a significant interaction effect between inoculation intensity and aeration rate at p < 0.01 with a negative effect (Table 3). However, the ca-rotenoids biosynthesis could be improved with an enhance-ment in quantities of these factors up to a specified level (Figure 2c).D.natronolimnaeaHS-1 is a microorganism that depends on oxygen supply, showing that the
creased by increasing inoculum size from 32 x 109to 42 x 109cfu cells/mL. Since glucose was utilized as carbon and energy sources byD. natronolimnaeaHS-1 during the fer-mentation, the consumption rate of glucose is related to the cells concentration. Therefore, the decrease of carotenoid pigments in the high inoculation intensity can be probably attributed to the reduction of glucose concentration. Wuet al.(2003) also stated that a reasonable explanation for the reducing mycelial growth by increasing inoculum size could be the yield limitation by the amount of nutrients available in the medium. According to the analysis by the “Design-expert” software, the optimal values of the three key factors for maximum production of carotenoid (5.39 mg/L) byD.natronolimnaeaHS-1 were D-glucose concentration of 23.69 g/L, inoculum size of 32.41 x 10⁹ cfu cells/mL, and air-flow rate of 7.28 L/L min.
CTX production
The results of ANOVA and response surface plots showed that the linear effect of D-glucose concentration and aeration rate on the CTX produced by D.
natronolimnaea HS-1 was significant (p < 0.0001; p < 0.001). Moreover, the quadratic effects of all parame-ters are significant were highly significant (p < 0.0001). The findings clearly revealed that the mutual interactions of D-glucose content and inoculation intensity and, aeration rate and inoculation intensity were significant on the CTX (Table 3; Figure 2d and e). The variables with the largest ef-fect were the quadratic term of D-glucose concentration followed by the quadratic terms of inoculation intensity and aeration rate. The effect of inoculation intensity and D-glucose concentration on the CTX production is also presented in Figure 1d. It shows a linear effect of these fac-tors. Increasing D-glucose content up to a certain value (23 g/L) increases the CTX yield but which then decreases at increased concentrations. The CTX enhancement is pro-bably due to the stimulation of precursors of the carotenoid pathway, such as mevalonic acid or related substances by the suitable quantities of glucose present in the media which could have enhanced the synthesis and accumulation of polyprenoid-derived carotenoids especially CTX (De Miguelet al., 2000). Khodaiyanet al.(2007) by studying the effects of various carbon sources on cell growth and CTX production observed that glucose as an inexpensive energy source had the highest effect on the total carotenoid and CTX formation byD. natronolimnaeaHS-1. The use of glucose for optimal growth and pigmentation medium for CTX production byGordonia jacobaeamutants asG. jacobaeaMV-1 sp. nov. have previously been reported (De Miguelet al., 2000; De Miguelet al., 2001). Okagbue and Lewis (1985) found that the range of glucose concentration at 10-20 g/L appeared to be critical for high extractability of astaxanthin (AX) in a single stage mixed culture of
Xanthophyllomyces dendrorhous and Bacillus circulans.
Fang and Chiou (1996) also reported that the total
caro-tenoid (mg/mL), total volumetric AX (mg/mL), and BDW (g/L) produced by a mutant of the red yeast namelyPhaffia rhodozymaNCHU-FS501 were increased at concentrations of glucose below 35 g/L. The results of this work indicated a higher glucose concentration than 23 g/L in culture me-dium ofD.natronolimnaeaHS-1 can lead to decrease the pigment production due to the substrate inhibition effect. Fang and Chiou (1996) claimed that the fermentative growth and AX concentration by the mutant strain of P. rhodozymawas reduced with increasing concentrations of glucose from 35 to 45 g/L. It also seems that glucose con-centrations more than 23 g/L by inducing the high viscosity in culture medium most likely limited oxygen transfer, re-sulting in lowered yields of carotenoid pigment (Gharibza-hediet al., 2012b). The increase in aeration from 2 to 8 L/L min caused a significant increase in the dissolved oxygen among high-cell-density cultures, favoring aerobic metab-olism and the substrate consumption (Figure 2e). As con-sidered in Figure 2e, the simultaneous increase of aeration rate and inoculum size up to a certain quantity can lead to enhance CTX by D. natronolimnaea HS-1 in a batch bioreactor. Asker and Ohta (1999) also found that the growth and CTX production by halophilic bacteria were significantly increased with increasing the rate of dissolved oxygen in high-inoculum density.
According to the individual optimization data, when optimum values of independent variables (D-glucose con-tent of 22.95 g/L, inoculum size of 31.2 x 10⁹cfu cells/mL and aeration rate of 7.88 l/l min) were incorporated into the regression equation, 5.00 mg/L CTX concentration was ob-tained.
Optimization and verification of the models
Numerical and graphical optimization procedures were performed for predicting the optimum level of inde-pendent variables to obtain maximum biomass, total caro-tenoid and CTX. The RSM package’s response optimizer determined the overall optimum region to be at 23.38 g/L of D-glucose concentration, 31.2 x 10⁹ cfu cells/mL and 7.85 L/L min of air flow rate (Desirability = 0.98). The cor-responding response values for biomass, total carotenoid and CTX predicted under the recommended optimum con-dition were 7.85 g/L, 5.48 mg/L and 4.99 mg/L, respec-tively. After verifying by five experimental tests with the predicted values, it was demonstrated that no significant (p > 0.05) difference between the experimental and predicted values was observed (Table 4). The findings also revealed a close correspondence between those values. Thus, the ex-perimental values were found to be in agreement with the predicted ones.
Conclusion
influenced by carbon substrate and air flow rate than by inoculum size. However, all quadratic effects of the inde-pendent variables on the production biomass, carotenoid and CTX by this bacterium were highly significant. The op-timum set of the independent variables was predicted graphically in order to obtain the desired levels of biomass (7.85 g/L), total carotenoid (5.48 mg/L) and CTX (4.99 mg/L). The optimal experimental biomass, total carotenoid and CTX were respectively obtained 7.91 mg/L, 5.63 g/l and 5.07 g/L, when the optimum conditions of bioproduction were D-glucose concentration of 23.38 g/L, inoculation intensity of 31.2 x 10⁹cfu cells/mL and air-flow rate of 7.85 L/L min. The obtained results in this work can be seen as an effective contribution to the development of more efficient bioprocesses for industrial synthesis of CTX. The CTX isolated from D. natronolimnaea HS-1 may be used as a natural antioxidant for possible produc-tion of healthy-funcproduc-tional foods in the future. However, the batch cultures applied in this study have some limitations, mainly related to high sugar concentrations and CTX yields. The techniques of fed-batch and continuous cultures are recommended for overcoming these problems.
Acknowledgments
The authors would like to extend their appreciation for the financial support provided by the University of Teh-ran and ITeh-ranian center of excellence for application of mod-ern technologies for producing functional foods and drinks.
References
Aksu Z, Eren AT (2007) Production of carotenoids by isolated yeast ofRhodotorula glutinis. Biochem Eng J 35:107-113. Asker D, Ohta Y (1999) Production of canthaxanthin by
ex-tremely halophilic bacteria. J Biosci Bioeng 88:617-621. Augustin JC, Brouillaud-Delattre A, Rosso L, Carlier V (2000)
Significance of inoculum size in the lag time ofListeria monocytogenes. Appl Environ Microbiol 66:1706-1710. Cho YJ, Wang HJ, Kim SW, Song CH, Yun JW (2002) Effect of
carbon source and aeration rate on broth rheology and fungal morphology during red pigment production by
Paecilomyces sinclairiiin a batch bioreactor. J Biotechnol 95:13-23.
Choudari SM, Singhal R (2008) Media optimization for the pro-duction ofb-carotene byBlakeslea trispora: a statistical ap-proach. Bioresour Technol 99:722-730.
De Miguel T, Sieiro C, Poza M, Villa TG (2000) Isolation and tax-onomic study of a new canthaxanthin-containing bacterium,
Gordonia jacobaeaMV-1sp. nov. Int Microbiol 3:107-111. De Miguel T, Sieiro C, Poza M, Villa TG (2001) Analysis of
canthaxanthin and related pigments from Gordonia jacobaeamutants. J Agric Food Chem 49:1200-1202. Duckworth AW, Grant S, Grant WD, Jones BE, Meijer D (1998)
Dietzia natronolimnaiossp. nov., a new member of the ge-nusDietziaisolated from an east soda lake. Extremophiles 2:359-366.
Fang TJ, Chiou TY (1996) Batch cultivation and astaxanthin pro-duction by a mutant of the red yeast,Phaffia rhodozyma
NCHU-FS501. J Ind Microbiol 16:175-181.
Frengova GI, Beshkova DM (2009) Carotenoids from
RhodotorulaandPhaffia:yeasts of biotechnological impor-tance. J Ind Microbiol Biotechnol 36:163-180.
Gharibzahedi SMT, Mousavi SM, Hamedi M, Khodaiyan F (2013a) Application of response surface modeling to opti-mize critical structural components of walnut-beverage emulsion with respect to analysis of the physicochemical as-pects. Food Bioprocess Technol 6:456-469.
Gharibzahedi SMT, Razavi SH, Mousavi SM (2012a) Developing an emulsion model system containing canthaxanthin biosynthesized byDietzia natronolimnaeaHS-1. Int J Biol Macromol 51:618-626.
Gharibzahedi SMT, Razavi SH, Mousavi SM (2013b) Psyllium husk gum: An attractive carbohydrate biopolymer for the production of stable canthaxanthin emulsions. Carbohydr Polym 92:2002-2011.
Gharibzahedi SMT, Razavi SH, Mousavi SM (2013c) Ultra-sound-assisted formation of the canthaxanthin emulsions stabilized by arabic and xanthan gums. Carbohydr Polym 96:21-30.
Gharibzahedi SMT, Razavi SH, Mousavi SM (2014a) Character-izing the natural canthaxanthin/2-hydroxypropyl-b -cyclo-dextrin inclusion complex. Carbohydr Polym 101:1147-1153.
Gharibzahedi SMT, Razavi SH, Mousavi SM (2014b) Feeding strategies for the improved biosynthesis of canthaxanthin from enzymatic hydrolyzed molasses in the fed-batch fer-mentation of Dietzia natronolimnaea HS-1. Bioresour Technol 154:51-58.
Gharibzahedi SMT, Razavi SH, Mousavi SM, Moayedi V (2012b) High efficiency canthaxanthin production by a novel mutant isolated fromDietzia natronolimnaeaHS-1 using central composite design analysis. Ind Crop Prod 40:345-354.
Khodaiyan F, Razavi SH, Emam-Djomeh Z, Mousavi SMA, Hejazi MA (2007) Effect of culture conditions on Table 4- Predicted and experimental values of the responses obtained at optimum conditions.
Independent variables Optimum condition Response variables Optimum condition
Experimental* Predicted
Glucose concentration 23.38 g/L Biomass yield 7.91±0.23 7.85 g/L
Inoculation intensity 31.2 x 10⁹cfu cells/mL Carotenoid yield 5.63±0.22 5.48 mg/L
Aeration intensity 7.85 L/L min CTX yield 5.07±0.07 4.99 mg/L
canthaxanthin production byDietzia natronolimnaeaHS-1. J Microbiol Biotechnol 17:195-201.
Khodaiyan F, Razavi SH, Mousavi SM (2008) Optimization of canthaxanthin production byDietzia natronolimnaeaHS-1 from cheese whey using statistical experimental methods. Biochem Eng J 40:415-422.
Kumar S, Sharma HK, Sarkar BC (2011) Effect of substrate and fermentation conditions on pectinase and cellulase produc-tion byAspergillus nigerNCIM 548 in submerged (SmF) and solid state fermentation (SSF). Food Sci Biotechnol 20:1289-1298.
Lee YM, Kim JS, Kim WJ (2012) Optimization for the maximum bacteriocin production ofLactobacillus brevisDF01 using response surface methodology. Food Sci Biotechnol 21:653-659.
Malisorn C, Suntornsuk W (2008) Optimization ofb-carotene production byRhodotorula glutinisDM28 in fermented rad-ish brine. Bioresour Technol 99:2281-2287.
Miller GL (1959) Use of dinitrosalicylic acid reagent for determi-nation of reducing sugar. Anal Chem 31:426-428.
Myers RH, Montgomery RC (2002) Response surface methodol-ogy, process and product optimization using design experi-ment. John Wiley & Sons, Inc., New York, USA.
N’Guessan KF, Aka S, Djeni NDT, Dje KM (2008) Effect of tra-ditional starter inoculation rate on sorghum beer quality. J. Food Technol 6:271-277.
Nasri Nasrabadi MR, Razavi SH (2010a) Enhancement of can-thaxanthin production fromDietzia natronolimnaeaHS-1 in a fed-batch process using trace elements and statistical methods. Braz J Chem Eng 27:517-529.
Nasri Nasrabadi MR, Razavi SH (2010b) Use of response surface methodology in a fed-batch process for optimization of tricarboxylic acid cycle intermediates to achieve high levels of canthaxanthin from Dietzia natronolimnaea HS-1. J Biosci Bioeng 109:361-368.
Nasri Nasrabadi MR, Razavi SH (2011) Optimization ofb -caro-tene production by a mutant of the lactose positive yeast
Rhodotorula acheniorumfrom whey ultrafiltrate. Food Sci Biotechnol 20:445-454.
O’Connor-Cox ESC, Ingledew WM (1991) Alleviation of the ef-fects of nitrogen limitation in high gravity worts through in-creased inoculation rates. J Ind Microbiol 7:89-96. Okagbue RN, Lewis MJ (1985) Influence of mixed culture
condi-tions on yeast-wall hydrolytic activity ofBacillus circulans
WL-12 and on extractability of astaxanthin from the yeast
Phaffia rhodozyma. J Appl Bacteriol 59:243-255.
Razavi SH, Blanchard F, Marc I (2006) UV-HPLC/APCI MS method for separation and identification of the carotenoids produced by Sporobolomyces ruberrimus H110. Iran J Chem Chem Eng 25:1-10.
Razavi SH, Mousavi SM, Mehrabani Yeganeh H, Marc I (2007) Fatty acid and carotenoid production by Sporobolomyces ruberrimuswhen using technical glycerol and ammonium sulfate. J Microbiol Biotechnol 17:1591-1597.
Sakaki H, Nochide H, Nakanishi T, Miki W, Fujita T, Komemushi S (1999) Effect of culture condition on the biosynthesis of carotenoids in Rhodotorula glutinis No. 21. Seibutsu-kogaku Kaishi 77:55-59.
Simova ED, Frengova GI, Beshkova DM (2003) Effect of aera-tion on the producaera-tion of carotenoid pigments by
Rhodotorula rubra-lactobacillus casei subsp. casei co-cultures in whey ultrafiltrate. Zeitschrift für Naturforschung C- J Biosci 58:225-229.
Valduga E, Schwartz CRM, Tatsch PO, Tiggemann L, Di Luccio M, Treichel H (2011) Evaluation of aeration and substrate concentration on the production of carotenoids by
Sporidiobolus salmonicolor(CBS 2636) in bioreactor. Eur Food Res Technol 232:453-462.
Veiga-Crespo P, Blasco L, Rosa-Dos-Santos F, Poza M, Villa TG (2005) Influence of culture conditions of Gordonia jacobaea MV-26 on canthaxanthin production. Int Micro-biol 8:55-58.
Wu JZ, Cheung PCK, Wong KH, Huang NL (2003) Studies on submerged fermentation of Pleurotus tuberregium (Fr.) Singer part D physical and chemical factors affecting the rate of mycelia growth and bioconoersion efficiency. Food Chem 81:389-393.
Yaakob H, Abd Malek R, Misson M, Abdul Jalil MF, Sarmidi MR, Aziz R (2011) Optimization of isoflavone production from fermented soybean using response surface methodol-ogy. Food Sci Biotechnol 20:1525-1531.