BAIA MARE MINING AREA.
EFFECTS OF THE POLICY OF DISADVANTAGED AREAS
GABRIELA-ALINA MURE AN
1, RALUCA-MIHAELA ROGOJAN
2ABSTRACT – The policy of the disadvantaged areas was a component of the regional development policy in Romania between 1998 and 2010. It aimed to delineate those areas that underwent serious economic and social issues that were mainly generated by industrial restructuring in order to take specific measures to revive them. Baia Mare mining area is one of the 38 disadvantaged areas that were identified in Romania. The present article aims to emphasize the results of such a policy within Baia Mare mining area, the way in which the status of disadvantaged area had effects on the economic development of the city of Baia Mare and on the other localities included. Therefore, the companies that invested in the area once it was declared a “disadvantaged area” were analyzed, along with the new jobs, the facilities for companies, the total value of investments and the way these influenced (in a positive or negative manner) the decrease in the unemployment rate and the economic revival through activities from new economic domains. The conclusion is that a high number of companies had investments during its existence as a disadvantaged area, yet the effects they had on the economic development are evident particularly in the city of Baia Mare. The poor quality of the transport infrastructure and of the business infrastructure restricts the economic potential of the other localities that are part of the area, therefore they registered few investments.
Keywords: disadvantaged area, economic agents, investor certificate, unemployment, investments, economic revival
INTRODUCTION
The policy of the disadvantaged areas was a component of the regional development policy in Romania between 1998 and 2010. It aimed to delineate those areas that underwent serious economic and social problems that were mainly generated by industrial restructuring in order to take specific measures to revive them. Baia Mare mining area is one of the 38 disadvantaged areas that were identified in Romania, being declared as such by Government Resolution No. 203 issued on March 25, 1999. The Resolution stated that Baia Mare mining area, located in Maramure county, included Cicârlău, TăuŃii-Magherău , Baia Mare, Baia Sprie, BăiuŃ, Cavnic and i e ti, totalizing 75,225 ha (article 2). The mining area was declared a disadvantaged area for a period of 10 years (article 3).
The criteria under which Baia Mare mining area was declared a disadvantaged area were those stated by Emergency Ordinance No. 24 of 1998 (b) and (e) on disadvantaged areas, namely that these areas are mining areas where there were reductions in labour force through collective layoffs, as the industrial restructuring policy was put into practice; they lack communication means and their infrastructure is poorly developed.
The status of a disadvantaged area implied giving some facilities to potential investors in such areas in order to draw investments and, in particular, to generate new jobs aiming at an economic revival, as all these disadvantaged areas were industry focused and had been greatly affected by economic restructuring and unemployment.
1 Lecturer,Ph. D., Babe -Bolyai University, Faculty of Geography, 5-7 Clinicilor Street, Cluj-Napoca, Romania. E-mail: [email protected]
The present paper aims to emphasize the results of such a policy within Baia Mare mining area, the way in which the status of disadvantaged area had effects on the economic development of the city of Baia Mare and the other localities that are part of the area and assess whether the policy of the disadvantaged areas reached its main goal.
In order to better understand the economic and social background of Baia Mare mining area in the moment in which it was declared a disadvantaged area, it has to be mentioned that during 1965-1990, the city of Baia Mare developed and extended, its economy relying entirely on mining and non-ferrous metallurgy, importing labour force from the entire Maramure county and from the neighbouring counties as well. In the 70s, other industrial sub-branches also dominated, namely the manufacture of building materials, the manufacture of wood, the manufacture of textiles, the manufacture of food products. Nevertheless, this dependency determined a large number of layoffs and a high unemployment rate once restructuring began, some of the mines being closed after the ‘90s. A major decrease in industrial activity was registered in the case of metallurgy and manufacture of mining equipment.
In order to emphasize the manner in which the number of employees in industry was affected by the restructuring process, we used data made available by REMIN S.A. Baia Mare - National Company of Valuable and Non-ferrous Metal Ores
,
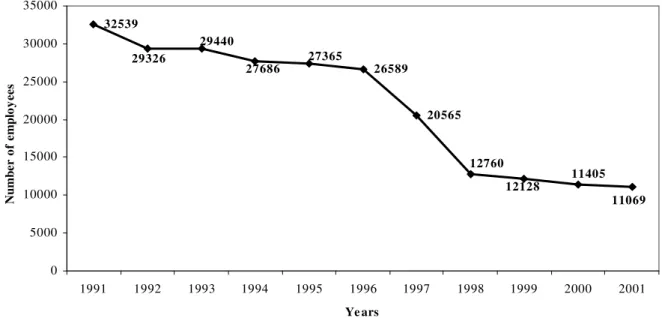
which controlled the mines within Baia Mare area. There is a continuous decrease in the number of employees during 1991-2001, due to the massive layoffs (Table 1, Figure 1). The phenomenon had a peak during 1996-1998, when the number of employees decreased from 26,589 in 1996 to 20,565 in 1997. In 1998, there were by 8,000 employees less compared to the previous year, determining a very rapid decrease in the economic activities within the mining areas. The decrease in the number of employees went over 50% during 1996-1998, while in 2001, the company had by 66% less employees than in 1991.Table 1. The number of employees within REMIN S.A. Baia Mare during 1991-2001
Year 1991 1992 1993 1994 1995 1996 1997 1998 1999 2000 2001 Number of
employees 32539 29326 29440 27686 27365 26589 20565 12760 12128 11405 11069 Source: Compania NaŃională a Metalelor PreŃioase i Neferoase REMIN S.A. Baia Mare [REMIN S.A. Baia Mare - National Company of Valuable and Non-ferrous Metal Ores]
32539
26589
20565 29326
29440
27686
27365
12760
12128
11405
11069
0 5000 10000 15000 20000 25000 30000 35000
1991 1992 1993 1994 1995 1996 1997 1998 1999 2000 2001 Ye ars
N
u
m
b
e
r
o
f
e
m
p
lo
y
e
e
s
BAIA MARE DISADVANTAGED AREA. INDICATORS
Once the area was declared “disadvantaged area”, there were 395 investor certificates issued for economic agents before July 1, 2003. This was one of the conditions required to be exempted from the income tax according to Law No. 507 of 2004 for the passing of the Government Ordinance No. 94 of 2004 on regulating some financial measures. The changes in the disadvantaged areas legislation were represented by a decrease in the number of facilities the investors were to receive, followed by a decrease in the interest the economic agents had to obtain an investor certificate.
The analysis carried out for Baia Mare disadvantaged area took into account several indicators that were instrumental in determining the effects the policy of disadvantaged areas had on the economic development of this area. The following indicators were considered: the number of economic agents that had investor certificates, the number of new jobs that were to cover the labour
force in the area, the value of investments, and the facilities given to the investors. The analysis was
twofold: on the one hand, there was an analysis of each indicator for the localities that are part of the disadvantaged area, on the other hand, there was an analysis on the business object (on economic branches and sub-branches). In this respect, the activities from the Statistical Classification of Economic Activities in Romania - NACE3 2005 was considered as it was operational when the
companies were registered. The typology of the companies with an investor certificate was done at first based on the sections from NACE, which were associated in the analysis with the main economic domains (Manufacturing, Trade, etc.). Then, Manufacturing (section D, NACE 2005) was considered in its sub-branches. For certain cases, such as Other service activities, an association of the NACE
sections was done because of the small number of economic agents from some of the NACE sections4.
The number of economic agents
Out of the total of 395 economic agents that invested in Baia Mare disadvantaged area, only 369 kept their status and the facilities given, the other 26 being in one of the situations that did not allow them to benefit by the investor certificate and all the related facilities, or had an uncertain status. They were companies that did not comply with their obligations towards the North-West Region Development Agency – Maramure branch, having their investor certificate withdrawn, or they did not carry out economic activities in order to develop investments in the area. Others did have economic activities but outside the disadvantaged area, or, in other cases, they suspended their activity temporarily, being proposed for having their investor certificate withdrawn, or they were companies that experienced insolvency. All these cases were not considered in the present analysis.
Out of the 369 companies that were doing businesses within Baia Mare disadvantaged area, 342 had their registered office in the city of Baia Mare, 16 in the town of Baia Sprie, 5 in the town of TăuŃii-Măgherău , 3 in the commune of BăiuŃ, 1 in the commune of Cicârlău, 1 in the commune of
i e ti, and 1 in the town of Cavnic (Figure 2).
3 NACE is the acronym for “Nomenclature statistique des activités économiques dans la Communauté européenne”, that is Statistical Classification of Economic Activities in the European Community.
16 5 3 1 1 1 27 342
Baia-Mare Baia Sprie TăuŃii-Măgherău BăiuŃ Cavnic Cicârlău i e ti
Figure 2. Economic agents and the localities of registration within Baia Mare disadvantaged area
As it can be noticed, the greater part of the companies that invested in the area, namely 92.6%, is grouped in the city of Baia Mare, as the context was favourable for this: there was a suitable market and business infrastructure. Out of all the other localities in the area, only Baia Sprie and TăuŃii Măgherău registered more than 1%, namely 4.3% in Baia-Sprie and 1.3% in TăuŃii Măgherău ; shares that are very low as compared to the 92.6% in Baia Mare.
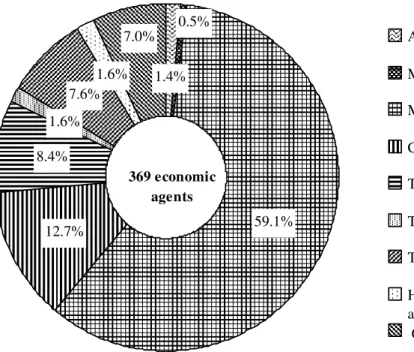
Even though the activity of the companies seems to be quite diverse, in fact there is a certain concentration in specific economic fields. Thus, more than a half of the registered economic agents (218, that is 59.1% out of the total) activated in Manufacturing, followed by the ones in Construction,
represented by 47 economic agents, namely 12.7% out of the total, and in Trade, represented by 31
economic agents, totalizing 8.4%. In the opposite, there is Mining and quarrying, which is already
experiencing a downturn, only 2 economic agents activating in this sector (0.5%). Moreover, the less “sought” economic fields were Tourism, Human Health Care and Agriculture – Fishing, each
accounting low shares of less than 2% out of the total companies in the area (Table 2, Figure 3).
Table 2. Number of economic agents on their business object
E co n o m ic a ct iv it y A g ri cu lt u re a n d f is h in g M in in g a n d q u a rr y in g M a n u fa ct u re C o n st ru ct io n T ra d e T o u ri sm T ra n sp o rt a ti o n a n d st o ra g e H u m a n h ea lt h a n d so ci a l w o rk a ct iv it ie s O th er s er v ic e a ct iv it ie s T o ta l Number of
59.1% 12.7%
8.4% 1.6%
7.6%
1.6% 1.4%
7.0% 0.5% Agriculture and fishing
Mining and quarrying Manufacturing Construction Trade Tourism
Transportation and storage Human health and social work activities
369 economic agents
Other service activities
Figure 3. The share of registered economic agents on activity field
Due to the large number of companies that invested in economic activities that are specific to various sub-branches of Manufacturing, and because of the varied activities that are part of this sector, the analysis was extended in order to analyse the sub-branches of Manufacturing in more detail. Thus, the more in-depth analysis revealed that the major part of the companies (46, namely 21.1%) carried out activities in the Manufacture of textiles, followed by those companies with activities in Metallurgy
(34, namely 15.6%) and the Manufacture of food products (30, namely 13.8%) (Figure 4). The other
sub-branches account for less than 10% as regards the number of economic agents that invested in the respective activity field.
30
46
12 15 15 17 34
17
30
Manufacture of food products
Manufacture of textiles
Manufacture of footwear
Manufacture of wood and wood products
Manufacture of chemicals and chemical products
Manufacture of building materials
Manufacture of basic metals
Manufacture of furniture
218 economic agents
Other activities
We find the analysis of the number of economic agents considering all economic sectors even more interesting. According to Table 2 and Figure 4, most of the companies with investor certificate activated in Construction, then in some sub-branches of Manufacturing, namely the Manufacture of textiles and Metallurgy, while the Manufacture of food products comes immediately after Trade,
which follows Metallurgy. Thus, a certain orientation of economic activities towards activity fields found in booming development after 1990 can be noticed (Construction, Trade), as well as in some industrial branches that were traditional in the area, such as Metallurgy or the Manufacture of textiles.
One of the major aims of the policy for disadvantaged areas was to attract investors to invest in the area and to set up new jobs in order to support the decrease in the unemployment rate, on the one side, and to economically revive these areas lagging behind from an economic and social point of view. Consequently, two other indicators were considered relevant for the present analysis: the number of newly created jobs and the value of investments in the disadvantaged area.
The number of newly created jobs
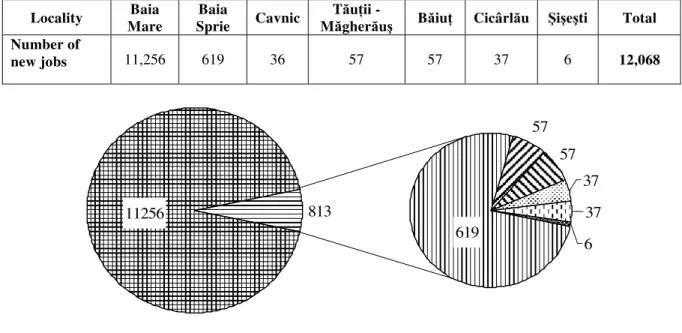
According to the available data, there were 12,068 new jobs in Baia Mare disadvantaged area, yet unevenly distributed both at the level of localities and at the economic sectors and sub-branches. Strongly correlated with the distribution of the economic agents, the most numerous jobs were created in the city of Baia Mare (11,256, representing 93% of the total), emphasizing once more the attraction potential of the city in comparison with the other smaller urban localities or the rural localities of the area (Table 3, Figure 5). The town of Baia-Sprie the is second in this hierarchy, but at a great distance, with 619 newly created jobs (5% out of the total number), followed by the town of TăuŃii-Măgherău and the commune of Cicârlău, with 57 new jobs each, less than 1%. The list continues with the town of Cavnic town (36 jobs) and the commune of i e ti (only 6 new jobs created during the functioning of the disadvantaged area).
Table 3. The number of newly created jobs in the localities of the Baia Mare disadvantaged area
Locality Baia Mare
Baia
Sprie Cavnic
TăuŃii -
Măgherău BăiuŃ Cicârlău i e ti Total Number of
new jobs 11,256 619 36 57 57 37 6 12,068
57 57
37
37
6 813
11256
619
Baia-Mare Baia Sprie TăuŃii - Măgherău BăiuŃ Cavnic Cicârlău i e ti
Figure 5. Representation of the newly created jobs on the component localities of the
As it results from the analysis of Table 4 and Figure 6, the distribution of the newly created jobs on main economic sectors is relatively similar to the distribution of small and medium-sized enterprises (SMEs) that benefited by the investor certificate; namely, the greatest number of jobs (9,613) was created in Manufacturing. It is the sector where most of the SMEs activate, accounting for
almost 80% of the total newly created jobs. It is followed by Construction, with only 7.6% (913 jobs)
and Other service activities (5%), which includes a variety of activities such as Real estate activities,
Rental and leasing activities, Business support activities, Education, Other collective, social, and personal service activities, according to NACE. In all the other economic sectors, few new jobs were created, representing, in each case, less than 5% of the total.
Table 4. The number of newly created jobs on main economic sectorsand branches
E co n o m ic a ct iv it y M a n u fa ct u ri n g C o n st ru ct io n O th er s er v ic e a ct iv it ie s T ra d e T ra n sp o rt a ti o n a n d s to ra g e A g ri cu lt u re a n d fi sh in g T o u ri sm H u m a n h ea lt h a n d s o ci a l w o rk a ct iv it ie s M in in g a n d q u a rr y in g T o ta l Number of
new jobs 9,613 913 606 468 242 100 84 26 16 12,068
79.7% 7.6% 3.9% 2.0% 5.0% 1.8% Manufacturing Construction Trade
Transportation and storage
Other service activities Other activity fields
12068 new jobs
Figure 6. Representation of newly created jobson main economic sectors and branches
A relative symmetry is to be found within Manufacturing, where the Manufacturing of textiles
registers the highest number of newly created jobs (3,017, namely 31% out of the total of newly created jobs in the manufacturing sector), followed by the Manufacturing of furniture (with 1,621 new
employees; 17%), by Metallurgy (1,162 new jobs; 12%) and the Manufacturing of food products
products as compared to the Manufacture of furniture (34 and 30, respectively, as compared to 17), the last sub-branch had economic agents with a higher number of employees, some of the companies actually outran the SMEs category.
Table 5. Number of newly created jobs on Manufacturing sub-branches
E co n o m ic a ct iv it y M a n u fa ct u re o f fo o d p ro d u ct s M a n u fa ct u re o f te x ti le s M a n u fa ct u re o f fo o tw ea r M a n u fa ct u re o f w o o d a n d w o o d p ro d u ct s M a n u fa ct u re o f p u lp a n d p a p er M a n u fa ct u re o f ch em ic a ls M a n u fa ct u re o f b u il d in g m a te ri a ls M a n u fa ct u re o f b a si c m et a ls M a ch in er ie s a n d eq u ip m en t E le ct ri ca l a n d o p ti ca l eq u ip m e n t M a n u fa ct u re o f fu rn it u re W a st e re co v er y Number of new jobs
1053 3017 497 521 263 304 553 1162 59 440 1621 123
Extending the analysis to all economic activities, one conclusion arises, namely that even though most economic agents were carrying out activities in Construction, the highest number of new jobs were created, the first four places of the hierarchy belong to the four activities mentioned within Manufacturing, namely the Manufacturing of textiles, the Manufacturing of furniture, Metallurgy, and the Manufacture of food products. They were followed by Construction and Other service activities.
More than 500 new jobs for the population in the disadvantaged area were created in each of these economic branches or sectors (Figure 7). In the opposite, the lowest number of newly created jobs was registered in the Manufacture of machinery and equipment (59), as well as in Human health and social work activities (26) and Mining and quarrying (only 16 new jobs).
606 913 1162 1621 553 521 1053 3017 0 500 1,000 1,500 2,000 2,500 3,000 3,500 Man ufac ture of foo
d pro ducts
Man ufac
ture o f tex
tiles
Man ufac
ture o f foo
twea r
Man ufac
ture o f buil
ding m ateria
ls
Man ufac
ture of ba
sic m etals
Man ufac
ture o f fur
nitur e Cons truct ion Othe r serv
ice ac tiviti es N um be r of n ew jo bs
Investments
The economic agents that received investor certificates, carried out activities in the
disadvanta
ged area and benefited by facilities from the state, made investments of approximately 335,012,355 RON5 under the form of land purchases, construction of buildings and industrial warehouses, equipment, machines and tools purchases needed for their activities in the area. However, the major part of investments (95.75%) was concentrated in the city of Baia Mare, the other localities benefiting by extremely low investments. Excepting the town of Baia Sprie, where they represent 3.5% of the total, the other localities had less than 1% of the total value of investments.Depending on the activity of the companies that invested in the area, 86% out of the investments were in Manufacturing, followed by Other service activities (4.6%) and Construction
(2.9%) (Figure 8).
86.2% 2.9%
2.1% 4.6%
2.1% 2.0%
Manufacturing Construction Trade Tourism
Other service activities Other activity fields 335 012 355
RON
Figure 8. Value of investments(%) on main economic sectors
Tourism can also be mentioned, with a share of 2.1% out of the total investments, and Trade
with 2.0%. In all the other sectors and branches (Transport, Agriculture, Mining and quarrying, and Human health and social work activities), investments were the smallest, being under 5,000,000 RON, that is less than a 1% for each. A more in-depth analysis of the investments in Manufacturing reveals a different situation compared to the distribution of economic agents or the newly created jobs. For example, even though there were only 17 companies activating in the Manufacture of furniture, this is
the industrial branch in which most of investments were made, totalizing 43.3% out of the total investments within Manufacturing. It was followed by the Manufacture of textiles (11.6%), the Manufacture of building materials (10.8%) and Metallurgy (10.2%). All the other branches benefited
by more modest investments, less than 10% each.
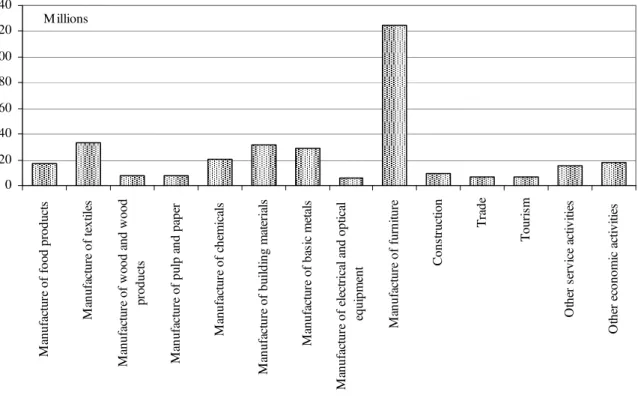
In a hierarchy of all sectors and sub-branches under analysis, the fist ranks belong to
Manufacture of furniture (37% out of all the investments in the disadvantaged area), the Manufacture of textiles (10%), the Manufacture of building materials (9%) and Metallurgy (8%) first. These are
followed by the Manufacture of chemicals and chemical products and the Manufacture of food
products (therefore other sub-branches of Manufacturing) and only afterwards by Other service activities (4.6%) and Construction (2.9%) (Figure 9).
0 20 40 60 80 100 120 140 M an uf ac tu re o f fo od p ro du ct s M an uf ac tu re o f te xt ile s M an uf ac tu re o f w oo d an d w oo d pr od uc ts M an uf ac tu re o f pu lp a nd p ap er M an uf ac tu re o f ch em ic al s M an uf ac tu re o f bu ild in g m at er ia ls M an uf ac tu re o f ba si c m et al s M an uf ac tu re o f el ec tr ic al a nd o pt ic al eq ui pm en t M an uf ac tu re o f fu rn itu re C on st ru ct io n T ra de T ou ri sm O th er s er vi ce a ct iv iti es O th er e co no m ic a ct iv iti es Millions
Figure 9. Value of investments(RON) on economic branches and sub-branches.
Facilities
The status of investor in Baia Mare disadvantaged area offered the beneficiary several
facilities, namely the exemption from paying the customs taxes and the VAT for imports of machines,
equipments, tools, transportation means and other depreciable assetsand raw materials useful for their investments in the area; exemption from VAT for the machines, equipments, tools, transportation means and other depreciable assetsmade in Romania that were to be used for their investments in the area; exemption from the payment of the income tax; exemption from the payment of the taxes charged for land-use changeor for the removal of land from land-use classification of some lands. The companies that invested in the area were granted money from a special fund at Government’s disposal that was to fund special programmes approved by Government Resolution. However, starting from 2002, once the Romanian legislation was harmonized with the European one, there was a decrease in the facilities offered to the investors in the disadvantaged areas, which led to a decrease in the interest to invest in the area. The only facility that remained was the exemption from the payment of income tax due for new investments, during the existence of the disadvantaged area. It affected only those investors, legal persons, that had obtained their permanent investor certificate in Baia Mare disadvantaged area before July 1, 2003. The present analysis took into consideration only this last facility, the exemption from the payment of the income tax, granted for investments in the period 2003-2006. Thus, state support totalized more than 62,000,000 RON, out of which, as expected, the greater part (almost 90%) was taken by Manufacturing, mainly the Manufacture of furniture (40%),
then Metallurgy (14%) and the Manufacture of textiles (12%). The other sectors received small
amounts, Construction and Other service activities received approximately 3%, while the other sectors
CONCLUSIONS
The policy of disadvantaged areas was implemented in Baia Mare mining area, with direct effects on the economic revival of this area. The facilities given by the Government to those that invested in this area were a pull factor for a great number of investors (369 economic agents) that activated in approximately 20 economic branches and sub-branches, which led to a diversification of the economic activities. Approximately 12,000 new jobs were created, yet an insufficient number considering the massive layoffs in the mining sub-sector (almost 14,000 persons were dismissed between 1997 and 1999). As there were new economic branches offering jobs, professional reorientation programs were needed, considering the fact that most part of the unemployed individuals had worked in mining before.
Even if a certain economic revival took place as a consequence of the investments made by the economic agents, a more in-depth analysis reveals a grouping of these investments in several localities, particularly in Baia Mare, and in certain economic branches. Thus, as regards the number of companies with an investor certificate, the newly created jobs and the value of investments, their massive concentration can be noticed in the city of Baia Mare (more than 90%). The poor quality of the transport and the business infrastructure, as well as the lack of the market demand limited the economic potential of the other localities that are part of the disadvantaged area. Modern industries, less dependent on natural resources, had fewer reasons to establish their business in remote places such as Cavnic or BăiuŃ.
Most of the economic agents, most of the new jobs meant for the population in the area and most of the investments, along with most important facilities given to investors, are registered in Manufacturing and Construction, Other service activities and Trade, the last ones at great distance in the list. Even though Manufacturing offers a great variety of sub-branches, the Manufacture of textiles, Metallurgy and the Manufacture of food products register high values taking into account the number of economic agents, the newly created jobs and even investments. The Manufacture of furniture registered the highest value of investments and facilities and offered a significant number of jobs, even though it had fewer economic agents involved. Cumulating all the economic activities, the most important remain, in the case of the newly created jobs, investments, and facilities, the four
sub-branches of the manufacturing industry (Manufacture of textiles, Manufacture of furniture, Metallurgy and Manufacture of food products), followed by Construction and Other service activities. Considering activity object as the main criteria, the greatest number of economic agents activated in Construction, yet with few jobs (e.g. 22 companies out of the 47 had less than 10 employees) and registered a medium level of investments. The least sought sectors were Mining and quarrying, Human health and social work activities and Agriculture and fishing. Tourism was not an
attraction either, even though the area has significant tourist potential. The conclusion is that there was a particular orientation of SMEs either towards sectors found in booming development in the transition economy, such as Construction and Trade, or towards activities that were traditional in the area, such as Manufacture of textiles, Manufacture of food products, Metallurgy, or even Manufacture of furniture.
REFERENCES
CÂNDEA MELINDA, BRAN FLORINA (2006), Organizarea, amenajarea i dezvoltarea durabilă a spaŃiului geografic [Sustainable Spatial Planning and Development of the Geographic Space],
Edit. Universitară, Bucure ti.
*** (2008), AgenŃia de Dezvoltare Regională Nord-Vest, date economice (economic data from the
North-West Region Development Agency).
*** (2000), OrdonanŃa de UrgenŃă Guvernamentală nr. 75/2000 [Government Emergency Ordinance
*** (1999), Hotărârea de Guvern nr. 203/1999 [Government Resolution No. 203 of 1999 on declaring
Baia Mare mining area as a disadvantaged area].
*** (1998), OrdonanŃa de UrgenŃă Guvernamentală nr. 24/1998 privind regimul zonelor defavorizate
[Government Emergency Ordinance No. 24 of 1998 on Disadvantaged Areas].
*** (2005), CAEN Revizuit 1, Clasificarea ActivităŃilor din Economia NaŃională[revised NACE, 1],
Ed. All Beck, Bucure ti.
*** (2008), CAEN Revizuit 2, Clasificarea ActivităŃilor din Economia NaŃională [revised NACE, 2],