Structure on Spatial Homogenization of Avian
Assemblages
Oliver J. Robertson1*, Clive McAlpine1, Alan House2, Martine Maron1
1School of Geography, Planning and Environmental Management, The University of Queensland, St Lucia, Queensland, Australia,2Ecosure, West Burleigh, Queensland, Australia
Abstract
Human-induced biotic homogenization resulting from landscape change and increased competition from widespread generalists or ‘winners’, is widely recognized as a global threat to biodiversity. However, it remains unclear what aspects of landscape structure influence homogenization. This paper tests the importance of interspecific competition and landscape structure, for the spatial homogeneity of avian assemblages within a fragmented agricultural landscape of eastern Australia. We used field observations of the density of 128 diurnal bird species to calculate taxonomic and functional similarity among assemblages. We then examined whether taxonomic and functional similarity varied with patch type, the extent of woodland habitat, land-use intensity, habitat subdivision, and the presence ofManorinacolonies (a competitive genus of honeyeaters). We found the presence of aManorina colony was the most significant factor positively influencing both taxonomic and functional similarity of bird assemblages. Competition from members of this widespread genus of native honeyeater, rather than landscape structure, was the main cause of both taxonomic and functional homogenization. These species have not recently expanded their range, but rather have increased in density in response to agricultural landscape change. The negative impacts ofManorinahoneyeaters on assemblage similarity were most pronounced in landscapes of moderate land-use intensity. We conclude that in these human-modified landscapes, increased competition from dominant native species, or ‘winners’, can result in homogeneous avian assemblages and the loss of specialist species. These interacting processes make biotic homogenization resulting from land-use change a global threat to biodiversity in modified agro-ecosystems.
Citation:Robertson OJ, McAlpine C, House A, Maron M (2013) Influence of Interspecific Competition and Landscape Structure on Spatial Homogenization of Avian Assemblages. PLoS ONE 8(5): e65299. doi:10.1371/journal.pone.0065299
Editor:Don A. Driscoll, The Australian National University, Australia
ReceivedOctober 26, 2012;AcceptedApril 28, 2013;PublishedMay 28, 2013
Copyright:ß2013 Robertson et al. This is an open-access article distributed under the terms of the Creative Commons Attribution License, which permits unrestricted use, distribution, and reproduction in any medium, provided the original author and source are credited.
Funding:Funding provided by the Cotton Communities and Catchments CRC and Birdlife Australia (formerly Birds Australia). The funders had no role in study design, data collection and analysis, decision to publish, or preperation of the manuscript.
Competing Interests:The authors declare the affiliation of co-author Dr. Alan House to the company Ecosure. This does not alter the authors’ adherence to all the PLOS ONE policies on sharing data and materials.
* E-mail: o.robertson@uq.edu.au
Introduction
The global biosphere is currently undergoing a decline in the distinctiveness of local and regional biotic assemblages, and represents a serious challenge for conservation biogeography [1]. McKinney and Lockwood [1] coined the term biotic homogeni-zation as the process that replaces unique endemic species with already widespread species. Later it was more specifically defined as a process where range-expanding habitat generalists invade new species pools at the expense of rare or endemic specialist species that disappear [2]. Taxonomic homogenization refers to the increasing similarity of species assemblages across time and space, whilst functional homogenization refers to the increasing similarity of functional ‘roles’ within communities [3]. More broadly, biotic homogenization has been attributed to the increasing dominance of generalist species [1,4], resulting in a loss of beta (b) diversity, often with a concurrent decline in local or alpha (a) diversity [3]. Several studies have predicted a mass extinction of more than 50% of the world’s species, during a Homogocene [5], wherein distinct communities are replaced by cosmopolitan communities [1,6].
Finnish agricultural landscapes as a result of landscape modifica-tion. This study showed a decrease in beta-diversity in response to increasing arable field cover at the landscape scale, associated with an increase in the proportion of generalists and highly mobile butterfly species.
Increased competition from successful generalist species may also enhance the process of biotic homogenization in human-modified landscapes, although this hypothesis remains untested. In Australia, cooperative interspecific aggression by the noisy miner (Manorina melanocephala), a native honeyeater, is known to have a strong impact on the structure of avian species assemblages across the agricultural and woodland landscapes of eastern Australia [13]. These cooperative breeders form large colonies with all individuals contributing to territory defense. A congener, the yellow-throated miner (M. flavigula), may have a similar influence on assemblage structure [14]. The noisy miner is well known for reducing species richness of woodland bird communities and excluding smaller species [15–18]. Therefore, in Australian agricultural regions, both landscape change and altered interspe-cific interactions may act synergistically as drivers of biotic homogenization.
In this paper, we addressed the question: does landscape structure and competition from a widespread generalist native species, drive taxonomic and functional homogenization across space? We defined spatial biotic homogenization as an increase in the similarity of assemblage composition through space (i.e. among sites). Specifically, we defined taxonomic homogenization as an increase in similarity based on species composition, and functional homogenization as an increase in similarity based on functional group composition. We tested whether woodland patch type, habitat extent, woodland habitat subdivision, land-use intensity and interspecific competition affected biotic homogenization of woodland bird communities in a fragmented agricultural land-scape. We also tested the relationship between the mean degree of specialization of avian assemblages and landscape structure and interspecific competition.
Methods
Study area and survey sites
The study was conducted within the Border Rivers Catchment on the Queensland side of the Macintyre River in southern Queensland, Australia (Figure 1). Major vegetation types include
Eucalyptusopen/grassy woodlands andCasuarinawoodlands, with river red gum (E. camaldulensis) open forests dominating riparian areas. Land clearance for cropping (cotton and cereal) and pastures began in the 1950s [19], and continued until 2004, when state legislation was introduced to control broad-scale clearing. The current extent of native vegetation in the study area is 17%, with 22% of the region used for irrigated cropping, 27% for dryland cropping and 34% for cattle and sheep pastures. Native woodland ecosystems are highly fragmented with a mean patch size of 15 ha (SD = 37); however, woodlands have high structural connectivity with a linear network of woodland strips and riparian woodlands.
We selected a grid of 565 km squares using ArcMap 9.3. Twenty-four squares were subjectively selected to cover a range of landscape patterns. Four 2 ha (506400 m) survey sites were selected within each grid square to minimize logistic requirements including transport and property access rights. Sites were distributed across four different woodland patch types to minimize bias towards certain patch types. For each grid square, one site was positioned at the centre of a large woodland patch (.30 ha), a small woodland patch (#30 ha), within a riparian woodland patch
(woodland fringing creeks and drainage lines), and within a linear woodland patch (roadside or fence line vegetation). Sites were separated by a minimum of 1 km.
Bird surveys
Within each study site, the observed density of all diurnal birds was recorded for 20 minutes using the active search method. This method allows observers to flush and identify cryptic or quiet species within the search area to make certain of identification, with counts of birds during a specified time period providing an index of abundance [20]. A single observer (O.R.) walked in a zigzag pattern along the length of the survey area, covering the entire area without back-tracking unless new species appeared, identifying birds to species level by sight and/or sound. Birds above the canopy were not recorded with the exception of aerial insectivores, predators and scavengers. Surveys were conducted up to 4 hours after sunrise and 2 hours before sunset. Nine repeat surveys were conducted on non-consecutive days for each site between March 2009 and May 2010. Survey effort was equally distributed across three seasons, with 3 repeats per season: autumn 2009, spring 2009 and autumn 2010.
Assemblage similarity
We pooled density data from the three seasons into a single data frame to increase the detection of nomadic species within survey sites, which move over large distances and appear more sporadically at sites across the landscape, compared to resident species. Few seasonal migrants occurred in the assemblages, which showed little compositional variation between seasons.
To quantify taxonomic similarity, we analyzed a Bray-Curtis matrix based on summed counts of all 128 species (Manorina
honeyeaters excluded) across all 96 sites. We utilized a log(x+1) data transformation to reduce the dominating influence of abundant taxa and increase the influence of rare species. To quantify functional homogenization, we analyzed a Bray-Curtis matrix based on summed counts of all members of functional groups (exceptManorinahoneyeaters) across all 96 sites. Functional groups were defined a priori and based on primary diet and primary foraging strata, resulting in 15 unique groups (Table 1). We also used log(x+1) transformations for the density estimate of each functional group.
Habitat specialists
We calculated a Specialization Index (SI) for all species detected in the study area by counting the number of main habitat associations of each species from a list of 24 potential habitat categories ranging from rainforest to grassland (see Appendix S1). We used a reputable field guide [21] and an encyclopedia of reference material [22–28] to list habitat types regularly utilized by each species according to our category system. This method places each bird along a spectrum of habitat specialization, where species with a low SI score are specialists and species with a relatively high score are habitat generalists. Such a species-specific SI is likely to be more ecologically relevant than a binary specialist/generalist classification [29]. For each site, we calculated the mean SI for all species detected, weighted by the total density of each species in the assemblage. The resulting Assemblage Specialization Index (ASI) for each site was analyzed as a response variable to test its dependence on the explanatory variables.
Explanatory variables
intensity and Manorina density. Continuous variables were converted to factors, each with two, three or four group levels, as a requirement of the PERMDISP test used in the statistical analysis (Table 2).
We defined sites as being within colonies (colony present) and actively defended byManorinahoneyeaters as those sites having an average density per survey of $2.5 individuals/site for either
Manorina species. We excluded sites (colony absent) with lesser densities because sites with only one or two individuals, such as individuals undergoing breeding dispersal or extra-territorial foraging forays, are unlikely to be within the actual territory area. With interspecific aggression directed towards birds within the colony area [30],Manorinahoneyeaters outside their territory area may not have an influence on avian assemblages.
We quantified landscape structure within 1 km radius land-scapes surrounding each site. The extent of woodland vegetation and different land-use cover types was mapped by visual interpretation in ArcMap 9.3 from Spot-5 multi-spectral satellite imagery [31]. The extent of vegetation was converted to a two level factor based on the percentage cover of woodland vegetation across the landscape, excluding the study patch, and ranged from 3% to 70% (mean: 20%, median: 17%). Because birds often exhibit a threshold response to landscape structure [32,33], we created a total of five factors for woodland extent each with a different cut-off for low woodland extent including; 10%, 15%, 20%, 25 and 30% woodland vegetation cover.
Habitat subdivision was quantified as the number of woodland patches, excluding the study patch. This ranged between 1–22 (mean: 7, median: 6), and was also converted to a two level factor. We created five factors for habitat subdivision each with a different cut-off for low subdivision including three, four, five, six and seven woodland patches. Landscapes with greater woodland habitat subdivision had smaller woodland patch sizes, smaller mean distance between woodland patches and a greater amount of woodland-agricultural edge.
Land cover within the production matrix was mapped as either pasture, dryland cropping or irrigated cropping. A three level factor was used to categorize land-use intensity for each landscape by the dominant land-use type within the production matrix. We considered pastoral land-use to be low intensity because the required inputs are low and edge contrast with woodland patches is relatively low. Dryland cropping was considered intermediate intensity because inputs and outputs are moderate and habitat structure contrasts greatly with woodland. Irrigated land-use has relatively large inputs and outputs and was defined as high intensity.
Figure 1. Location of the study area in southern Queensland (red arrow), and location of the 96 study landscapes (1 km radius) in relation to the nearest township of Goondiwindi, as indicated by a star, and the Queensland border along the Macintyre River.
Green shading represents woodland vegetation, irrigated land-use shown in blue, dryland land-use shown in pink and pastoral land-use shown in yellow. Also a scatter plot displaying the relationship between the extent and subdivision of woodland habitat within study landscapes, with sites colonized byManorinahoneyeaters shown in red and sites where colonies are absent shown in blue.
doi:10.1371/journal.pone.0065299.g001
Table 1.The number of species within each of the 15 functional groups defined by both diet and foraging strata, used in the analysis of functional homogenization.
Foraging strata
Primary diet Ground Shrub Branch Canopy Aerial
Granivores 26 0 – 1 –
Frugivores 1 1 – 4 –
Insectivores 29 11 2 15 13
Nectarivores – 3 – 13 –
Carnivores 9 0 0 1 9
Statistical analysis
Multidimensional scaling (MDS) configuration plots were used to visualize patterns of similarity and the direction of differences in mean distance to group centroid, by superimposing group labels. The plots were produced using MDS analysis of Bray-Curtis similarity matrices in the PRIMER 6 version 6.1.13 [34] program. We used the default setting of 25 restarts, a minimum stress of 0.01 and Kruskal stress formula set to 1.
We then conducted multivariate analysis of differences in assemblage similarity using the PERMDISP routine in the PERMANOVA+ version 1.0.3 [34] extension. PERMDISP compares variation in measures of assemblage similarity between groups, with low dispersion indicating more homogeneous assemblages across sites within that group whereas groups with more variable assemblage similarity measures have more hetero-geneous avian assemblages, with greaterbdiversity. PERMDISP has previously been used to analyze various biotic communities such as vegetation communities [35], soil fungal communities [36], soil seed-bank communities [37], and marine benthic communities [38,39]; although the method appears to have not been used for the analysis of biotic homogenization of avian communities. PERMDISP tests the homogeneity of multivariate dispersions within factor groups based on deviations from the group centroid. This test uses the ANOVA F statistic to compare the distances from observations to their group centroid and therefore cannot test the effects of continuous variables, only factors. P-values are obtained from permutations of residuals, using permutations of samples among groups after centering all groups onto a common location. This removes any location differences and makes the obtained residuals exchangeable under the null hypothesis of homogeneity of dispersions, as opposed to location effects [40]. PERMANOVA performs these tests using a large random sample of F-statistics, recalculated for each randomized permutation. Under this method the probability of Type I error remains equal to thea priorichosen significance level despite multiple tests [41]. The PERMDISP routine is limited to testing a single factor at one time and cannot test the significance of interactions.
For factors found to be significant, we tested potential interactions with other explanatory variables in the R program [42]. Log transformed distances to group centroids generated from the PERMDISP routine for a significant factor were used as the response variable in a generalized linear model. We built separate models testing for an interaction between the main grouping factor identified in PERMDISP and the other explanatory variables (patch type, the extent of woodland (ha), the number of woodland patches and land-use intensity).
For each factor we also tested for an association with variation in site ASI with a Kruskal-Wallis test. We chose this non-parametric test due to unequal sample sizes and uneven variance between factor groups with non-normal distributions. A significant result for this test indicates a relationship between explanatory factors and habitat specialization across the avian assemblage.
These data were collected with permission from the University of Queensland Animal Ethics Committee (reference no. 811108) and a scientific purposes (non-protected areas) permit (permit no. WISP05443008) issued by the Queensland government Environ-mental Protection Agency under legislation S12(E) Nature Conservation (Administration) Regulation 2006. Private land was accessed after permission was granted by land owners/ managers.
Results
Taxonomic homogenization
We found a highly significant difference (p,0.01) in dispersions between sites with aManorina colony present and those without (Table 3), with lower within-group dispersion for colonized sites (Figure 2). Group dispersions did not differ significantly with patch type or landscape structure. The explanatory factor Manorina
colony was also significantly associated with variation in the assemblage similarity index (ASI), as indicated by the Kruskal-Wallis test results. There were no significant associations between variation in ASI and patch type or landscape structure. There were no statistically significant interactive effects betweenManorina
Table 2.Factors used in the PERMDISP test for homogeneity of dispersions for taxonomic and functional similarity between factor groups.
Factor Group definitions
mancol A,Manorinacolonies absent from site with,2.5 average density of eitherManorinaspecies; P,Manorinacolony present with$2.5 average density of eitherManorinaspecies.
patch Ri: riparian or gallery woodland vegetation bordering watercourses; La: a large woodland patch$30 ha; Sm: a small woodland patch ,30 ha; Li: a linear woodland patch greater than twice the width in length bordering roadsides and fence lines.
extent10 L, landscapes with#10% woodland cover; H, landscapes with.10% woodland cover.
extent15 L, landscapes with#15% woodland cover; H, landscapes with.15% woodland cover.
extent20 L, landscapes with#20% woodland cover; H, landscapes with.20% woodland cover.
extent25 L, landscapes with#25% woodland cover; H, landscapes with.25% woodland cover.
extent30 L, landscapes with#30% woodland cover; H, landscapes with.30% woodland cover.
subdivision3 L, landscapes with#3 woodland patches; H, landscapes with.3 woodland patches.
subdivision4 L, landscapes with#4 woodland patches; H, landscapes with.4 woodland patches.
subdivision5 L, landscapes with#5 woodland patches; H, landscapes with.5 woodland patches.
subdivision6 L: landscapes with#6 woodland patches; H; landscapes with.6 woodland patches.
subdivision7 L, landscapes with#7 woodland patches; H, landscapes with.7 woodland patches.
intensity P, pastoral land-use has the greatest extent within the matrix; D, dryland cropping has the greatest extent within the matrix; I, irrigated cropping has the greatest extent within the matrix.
colony and any of the landscape structure variables on group dispersions (see Appendix S2).
Functional homogenization
We found a highly significant difference (p,0.01) of dispersions based on functional group data between sites with a Manorina
colony present and those without (Table 4), with lower within-group dispersion for colonized sites (Figure 3). The relationship betweenmancol and ASI was also highly significant (p,0.01), as
indicated by the Kruskal-Wallis test results. Group dispersions did not differ significantly with the main effects of patch type or landscape structure, although one aspect of landscape structure did interact with the factor Manorina colony. There were no significant associations between variation in ASI and patch type or landscape structure. There was a statistically significant (p,0.05) interaction between Manorina colony and land-use intensity on group dispersions (Table 5). This interaction revealed that the significant reduction in within-group dispersion resulting from the presence of Manorina colonies was primarily associated with landscapes dominated by dryland cropping (Figure 4). No other interactions were statistically significant (see Appendix S3).
Discussion
Our study contributes to the understanding of the process of land-use induced biotic homogenization and demonstrates the importance of interspecific interactions between locally native species in human-modified landscapes. Homogenization of avian communities has been documented in Europe [4,10,43], North America [44] and Africa [45], but tests conducted in Australia are rare [46]. We asked the question: can landscape structure and interspecific competition from native species, with static distribu-tion ranges, drive biotic homogenizadistribu-tion across space? Specifically, we found that interspecific competition fromManorina honeyeat-ers, rather than landscape structure, was the most significant driver of both taxonomic and functional homogenization of avian assemblages within woodlands fragmented by agriculture. The interaction with land-use intensity indicates that functional homogenization was greatest in landscapes dominated by dryland cropping, an intermediate-intensity land use.
Pattern and process of biotic homogenization
In our study system, both taxonomic and functional homoge-nization resulted from the presence of colonies of two species of the
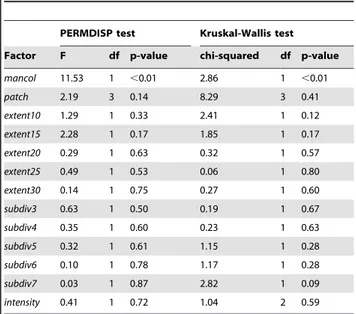
Manorina genus, either the noisy miner or the yellow-throated miner (Figures 2 and 4).Manorinahoneyeaters are gregarious birds, with coalitions of up to 50 birds aggressively defending territories with alarm calls, threat displays and direct attacks, and on occasion intruders are injured or even killed [30]. The noisy miner Table 3.PERMDISP tests of homogeneity of dispersions
(taxonomic similarity) results based on mean distance to group centroid for all groups within each factor, using log(x+1) transformed species density data.
PERMDISP test Kruskal-Wallis test
Factor F df p-value chi-squared df p-value
mancol 11.53 1 ,0.01 2.86 1 ,0.01
patch 2.19 3 0.14 8.29 3 0.41
extent10 1.29 1 0.33 2.41 1 0.12
extent15 2.28 1 0.17 1.85 1 0.17
extent20 0.29 1 0.63 0.32 1 0.57
extent25 0.49 1 0.53 0.06 1 0.80
extent30 0.14 1 0.75 0.27 1 0.60
subdiv3 0.63 1 0.50 0.19 1 0.67
subdiv4 0.35 1 0.60 0.23 1 0.63
subdiv5 0.32 1 0.61 1.15 1 0.28
subdiv6 0.10 1 0.78 1.17 1 0.28
subdiv7 0.03 1 0.87 2.82 1 0.09
intensity 0.41 1 0.72 1.04 2 0.59
P-values obtained from permutations of residuals. Significant results indicate spatial taxonomic homogenization in relation to particular factors. In addition, Kruskal-Wallis one-way analysis of variance of median group ASI for each factor. Statistically significant results reject the null hypothesis of no difference between median group ASI.
doi:10.1371/journal.pone.0065299.t003
Figure 2. Non-metric multi-dimensional scaling graph pro-duced from Bray Curtis taxonomic similarity of 96 sites using bird, log(x+1) transformed species density data.Solid red circles are sites colonized by eitherManorinaspecies (average density ofM. melanocephala or M. flavigula $2.5), solid green triangles are sites where colonies are absent. The graph demonstrates a smaller dispersion of sites (taxonomic homogenization) where Manorina
colonies are present compared to sites where colonies are absent. doi:10.1371/journal.pone.0065299.g002
Figure 3. Non-metric multi-dimensional scaling graph pro-duced from Bray Curtis functional similarity of 96 sites using bird, log(x+1) transformed functional group density data.Solid
red circles are sites colonized by either Manorina species (average density ofM. melanocephalaorM. flavigula$2.5), solid green triangles are sites where colonies are absent. The graph demonstrates a smaller dispersion of sites (functional homogenization) where Manorina
is particularly aggressive and its impact on avian assemblage structure is well documented [15,17,47], although it has only recently been shown to influence assemblage similarity [46]. At 63 g body weight, this species effectively excludes smaller (,50 g) avian species from its territories [13]. The yellow-throated miner also excludes smaller heterospecifics [48].
We found that as well as reducing species richness, both
Manorina species also homogenize avian assemblages within woodland habitats. Although the decline inadiversity in response toManorina species is well known, our results are novel because they demonstrate a more complex and independent process. Biotic homogenization is not synonymous with species invasion and extinction, and therefore cannot be assumed to covary predictably with species richness [3].
We suggest that Manorina honeyeaters are continuing to promote biotic similarity within remaining habitat in agricultural landscapes through their competitive interactions with other avian species. Some authors suggest the noisy miner has increased in density within its original range [17] in response to land clearance [49], habitat fragmentation [50], reduced habitat complexity [51], and grazing by livestock [52]. BothManorinaspecies have shown .20% increases in density across many regions in the last 30 years [53]. As these species increase in abundance, they are likely to occupy more sites across the landscape. Although our results quantify biotic homogenization across space, not time, the effect fromManorinahoneyeaters on assemblage composition is likely to increase as more sites are occupied and colonies increase in size. Although landscape change is thought to promote the abundance of Manorina honeyeaters in Australian agricultural landscapes, we found no statistically significant direct effects of landscape structure per seon the biotic homogenization of avian assemblages. This result is surprising and contrasts with previous studies that have found significant effects of habitat loss [54],
habitat fragmentation [55] and land-use intensity [56] on the similarity of avian assemblages in agricultural landscapes. This study detected no influence of landscape structure despite examining multiple potential threshold points in the relationship between homogenization and both habitat extent and habitat subdivision.
Landscape structure was, however, an important influence on the extent to whichManorina colonies caused functional homog-enization of avian assemblages. Our results suggest that functional homogenization due to Manorina honeyeaters is greatest in landscapes dominated by dryland cropping (Figure 4).The homogenizing effect of these honeyeaters is less pronounced in landscapes dominated by pasture or irrigated cropping. This effect may be the result of a trade-off generated by interactions between habitat and competition [57]. For example, if dryland landscapes represent high quality habitat with greater productivity for
Manorina honeyeaters, colony members may invest more energy into territory defense through greater aggression and an increased rate of intruder exclusion [58]. Dryland landscapes may provide high quality habitat forManorinahoneyeaters due to an increased availability of resources. For example, certain insects may be associated with dryland crops such as wheat or barley, but may not be highly available in landscapes dominated by pasture or irrigated crops such as cotton. An alternative explanation for the increased effect ofManorinacolonies in dryland landscapes may be that the functional diversity of species between sites is greater in Table 4.PERMDISP tests of homogeneity of dispersions
(functional similarity) results based on mean distance to group centroid for all groups within each factor, using log(x+1) transformed functional group density data.
PERMDISP test Kruskal-Wallis test
Factor F df p-value chi-squared df p-value
mancol 7.59 1 ,0.01 2.86 1 ,0.01
patch 1.37 3 0.31 8.29 3 0.41
extent10 0.02 1 0.90 2.41 1 0.12
extent15 2.05 1 0.18 1.85 1 0.17
extent20 0.22 1 0.66 0.32 1 0.57
extent25 0.32 1 0.60 0.06 1 0.80
extent30 0.04 1 0.85 0.27 1 0.60
subdiv3 0.15 1 0.72 0.19 1 0.67
subdiv4 0.25 1 0.64 0.23 1 0.63
subdiv5 0.44 1 0.53 1.15 1 0.28
subdiv6 0.07 1 0.79 1.17 1 0.28
subdiv7 0.08 1 0.78 2.82 1 0.09
intensity 0.25 1 0.80 1.04 2 0.59
P-values obtained from permutations of residuals. Significant results indicate spatial functional homogenization in relation to particular factors. In addition, Kruskal-Wallis one-way analysis of variance of median group ASI for each factor. Statistically significant results reject the null hypothesis of no difference between median group ASI.
doi:10.1371/journal.pone.0065299.t004
Table 5.Summary of the generalised linear model (glm) used to test the statistical significance of the interactive effect of
Manorinacolony and land-use intensity on group dispersions based in functional group density data.
Term Estimate Std. Error t value Pr(.|t|)
Intercept 3.40 0.08 44.75 ,0.001
mancol –0.42 0.11 –3.90 ,0.001
intensity –0.18 0.10 –1.80 0.075
mancol:intensity 0.37 0.15 2.52 ,0.05
Residual deviance 5.70
Df 90
doi:10.1371/journal.pone.0065299.t005
Figure 4. Plot of the mean log (Distance to centroid)±standard error, displaying the interaction between the presence of Manorina colonies and the intensity of land use in the surrounding landscape.
dryland landscapes, in the absence of Manorina honeyeaters. Greater functional diversity within dryland landscapes may be explained by an intermediate intensity of land use in comparison to landscapes dominated by pasture or irrigated cropping, as suggested by the intermediate disturbance hypothesis [59]. The rate of disturbance in intermediate land-use intensity or dryland cropping landscapes may be optimal for woodland birds. Identifying the causal mechanisms responsible for the relationship between low functional similarity and intermediate land-use intensity in agricultural landscapes is a research priority and warrants further research.
Several studies have found strong relationships between the ratio of habitat specialists to generalists and biotic homogenization [12,60]. Other authors have even defined functional homogeni-zation using communitywide indices of habitat specialihomogeni-zation [10,29]. Previous studies suggest that changes to landscape structure such as habitat loss and fragmentation homogenize biotic assemblages due to adverse and disproportionate impacts on specialist species [10,12,54]. Habitat specialists are often the most affected by habitat changes in agricultural landscapes because they cannot utilize resources within the production matrix and the high edge contrast between the open area and natural habitats creates a barrier to their movements [61–63].
Our communitywide index of habitat specialization (ASI) also showed strong correlations with an environmental factor respon-sible for both taxonomic and functional assemblage similarity. Habitat specialization was lower where the presence ofManorina
colonies had increased assemblage similarity, suggesting that both taxonomic and functional homogenization of avian assemblages within our study area results from the decline of habitat specialist species at the site-scale. In contrast, change in landscape structure was not correlated with variation in ASI, and this may explain why we found no direct effects of landscape structure on assemblage similarity.
Implications for conservation
This study adds to the current understanding of the processes affecting avian assemblages in remnant habitat. It has identified interspecific competition from native species as a driving force in the replacement of specialist species with habitat generalists leading to biotic homogenization. Several Manorina honeyeaters, particularly the noisy miner, have benefitted from landscape modification for agricultural land-use [17,49–51]. The
homoge-nizing effect of these aggressive species on functional diversity also interacted with land-use intensity. Just as species invasions have been shown to homogenize biotic assemblages through the replacement of specialists with generalists [1], this finding contributes to a growing awareness that landscape modification can disrupt the competitive dynamics [11] responsible for species composition assembly rules [64], and result in homogeneous avian assemblages with the loss of specialist species [1,3,65]. This has implications for conservation world-wide, with demand for agricultural production continuing to increase [66], the threat of land-use induced biotic homogenization will continue to intensify at a global scale [5,67], even in the absence of introduced species.
Supporting Information
Appendix S1 List of avian species included in the analysis indicating functional group and habitat associ-ations.
(PDF)
Appendix S2 Summary of generalised liner models (glm) used to test interactive effects of Manorina colony presence and other explanatory variables on within-group dispersions based on species composition simi-larity.
(PDF)
Appendix S3 Summary of generalised liner models (glm) used to test interactive effects of Manorina colony presence and other explanatory variables on within-group dispersions based on functional within-group composi-tion similarity.
(PDF)
Acknowledgments
We thank the Robertson family and Andrew Hustwaite for assistance in the field. We are indebted to the landholders who granted access to their properties.
Author Contributions
Conceived and designed the experiments: OJR. Performed the experi-ments: OJR. Analyzed the data: OJR. Contributed reagents/materials/ analysis tools: OJR AH. Wrote the paper: OJR CM MM AH.
References
1. McKinney ML, Lockwood JL (1999) Biotic homogenization: A few winners replacing many losers in the next mass extinction. Trends in Ecology and Evolution 14: 450–453.
2. Rooney TP, Olden JD, Leach MK, Rogers DA (2007) Biotic homogenization and conservation prioritization. Biological Conservation 134: 447–450. 3. Olden JD, Rooney TP (2006) On defining and quantifying biotic
homogeni-zation. Global Ecology and Biogeography 15: 113–120.
4. Dormann CF, Schweiger O, Augenstein I, Bailey D, Billeter R, et al. (2007) Effects of landscape structure and land-use intensity on similarity of plant and animal communities. Global Ecology and Biogeography 16: 774–787. 5. Olden JD (2006) Biotic homogenization: a new research agenda for conservation
biogeography. Journal of Biogeography 33: 2027–2039.
6. Kunstler JH (1993) Geography of Nowhere: The Rise and Decline of America’s Man-made Landscape: Simon & Schuster Publishing Co.
7. Harrison S (1993) Species diversity, spatial scale, and global change. In: Kareiva P, Kingsolver JG, Huey RB, editors. Biotic interactions and global change. Sunderland, MA: Sinauer Associates.
8. Hobbs RJ, Mooney HA (1998) Broadening the extinction debate: Population deletions and additions in California and Western Australia. Conservation Biology 12: 271–283.
9. Smart SM, Thompson K, Marrs RH, Le Duc MG, Maskell LC, et al. (2006) Biotic homogenization and changes in species diversity across human-modified ecosystems. Proceedings of the Royal Society Biological Sciences Series B 273: 2659–2665.
10. Devictor V, Julliard R, Clavel J, Jiguet F, Lee A, et al. (2008) Functional biotic homogenization of bird communities in disturbed landscapes. Global Ecology and Biogeography 17: 252–261.
11. Foster DR, Motzkin G, Slater B (1998) Land-use history as long-term broad-scale disturbance: Regional forest dynamics in central New England. Ecosystems 1: 96–119.
12. Ekroos J, Heliola J, Kuussaari M (2010) Homogenization of lepidopteran communities in intensively cultivated agricultural landscapes. Journal of Applied Ecology 47: 459–467.
13. Mac Nally R, Bowen M, Howes A, McAlpine CA, Maron M (2012) Despotic, high-impact species and the subcontinental scale control of avian assemblage structure. Ecology 93: 668–678.
14. Hannah D, Woinarski JCZ, Catterall CP, McCosker JC, Thurgate NY, et al. (2007) Impacts of clearing, fragmentation and disturbance on the bird fauna of Eucalypt savanna woodlands in central Queensland, Australia. Austral Ecology 32: 261–276.
15. Grey MJ, Clarke MF, Loyn RH (1998) Influence of the Noisy MinerManorina melanocephalaon avian diversity and abundance in remnant Grey Box woodland. Pacific Conservation Biology 4: 55–69.
16. Maron M, Main A, Bowen M, Howes A, Kath J, et al. (2011) Relative influence of habitat modification and interspecific competition on woodland bird assemblages in eastern Australia. Emu 111: 40–51.
18. Eyre TJ, Maron M, Mathieson MT, Haseler M (2009) Impacts of grazing, selective logging and hyper-aggressors on diurnal bird fauna in intact forest landscapes of the Brigalow Belt, Queensland. Austral Ecology 34: 705–716. 19. Seabrook L, McAlpine C, Fensham R (2006) Cattle, crops and clearing:
Regional drivers of landscape change in the Brigalow Belt, Queensland, Australia, 1840-2004. Landscape and Urban Planning 78: 373–385. 20. Bibby CJ, Burgess ND, Hill DA, Mustoe SH (2000) Bird census techniques.
London: Academic Press.
21. Pizzey G, Knight F (2010) The field guide to the birds of Australia. Sydney: Harper Collins.
22. Marchant S, Higgins PJ (1990) Volume 1: Ratites to Ducks. Handbook of Australian, New Zealand and Antarctic Birds. Melbourne: Oxford University Press.
23. Marchant S, Higgins PJ (1993) Volume 2: Raptors to Lapwings. Handbook of Australian, New Zealand and Antarctic Birds`. Melbourne: Oxford University Press.
24. Higgins PJ, Davies SJJF (1996) Volume 3: Snipe to Pigeons. Handbook of Australian, New Zealand and Antarctic Birds. Melbourne: Oxford University Press.
25. Higgins PJ (1999) Volume 4: Parrots to Dollarbird. Handbook of Australian, New Zealand and Antarctic Birds. Melbourne: Oxford University Press. 26. Higgins PJ, Peter JM, Steele WK (2001) Volume 5: Tyrant flycatchers to Chats.
Handbook of Autralian, New Zealand and Antarctic Birds. Melbourne: Oxford University Press.
27. Higgins PK, Peter JM (2002) Volume 6: Pardalotes to Shrike-thrushes. Handbook of Australian, New Zealand and Antarctic Birds. Melbourne: Oxford University Press.
28. Higgins PJ, Peter JM, Cowling SJ (2006) Volume 7: Boatbill to Starlings. Handbook of Australian, New Zealand and Antarctic Birds. Melbourne: Oxford University Press.
29. Clavero M, Brotons L (2010) Functional homogenization of bird communities along habitat gradients: accounting for niche multidimensionality. Global Ecology and Biogeography 19: 684–696.
30. Dow DD (1977) Indiscriminate interspecific aggression leading to almost sole occupancy of space by a single species of bird. Emu 77: 115–121.
31. QMDC (2007) Satellite Imagery. Toowoomba: Quuensland Murry-Darling Committee Inc.
32. Maron M, Bowen M, Fuller RA, Smith GC, Eyre TJ, et al. (2012) Spurious thresholds in the relationship between species richness and vegetation cover. Global Ecology and Biogeography: no-no.
33. Radford JQ, Bennett AF, Cheers GJ (2005) Landscape-level thresholds of habitat cover for woodland-dependent birds. Biological Conservation 124: 317– 337.
34. Anderson MJ, Gorley RN, Clark KL (2009) PRIMER 6 & PERMANOVA+. 6.1.13 & 1.0.3 ed. Plymouth, UK: PRIMER-E Ltd.
35. Hajkova P, Hajek M, Rybnicek K, Jirousek M, Tichy L, et al. (2011) Long-term vegetation changes in bogs exposed to high atmospheric deposition, aerial liming and climate fluctuation. Journal of Vegetation Science 22: 891–904. 36. Chu G, Wakelin SA, Condron L, Stewart A (2010) Effect of soil copper on the
response of soil fungal communities to the addition of plant residues. Pedobiologia 53: 353–359.
37. Gioria M, Osborne B (2009) Assessing the impact of plant invasions on soil seed bank communities: use of univariate and multivariate statistical approaches. Journal of Vegetation Science 20: 547–556.
38. Petraitis PS, Methratta ET (2006) Using patterns of variability, to test for multiple community states on rocky intertidal shores. Journal of Experimental Marine Biology and Ecology 338: 222–232.
39. Tlig-Zouari S, Rabaoui L, Cosentino A, Irathni I, Ghrairi H, et al. (2011) Macrofauna associated with an introduced oyster,Pinctada radiata: Spatial scale implications of community differences. Journal of Sea Research 65: 161–169. 40. Clark KL, Gorley RN (2009) PRIMER v6: User manual/tutorial. Plymouth:
PRIMER-E.
41. Dwass M (1957) Modified randomization tests for nonparametric hypotheses. Annals of Mathematical Statistics 28: 181–187.
42. R Development Core Team (2011) R: A language and environment for statistical computing. Vienna, Austria: R Foundation for Statistical Computing.
43. Clergeau P, Croci S, Jokimaki J, Kaisanlahti-Jokimaki M-L, Dinetti M (2006) Avifauna homogenisation by urbanisation: Analysis at different European latitudes. Biological Conservation 127: 336–344.
44. La Sorte FA, McKinney ML (2007) Compositional changes over space and time along an occurrence-abundance continuum: anthropogenic homogenization of the North American avifauna. Journal of Biogeography 34: 2159–2167. 45. van Rensburg BJ, Peacock DS, Robertson MP (2009) Biotic homogenization and
alien bird species along an urban gradient in South Africa. Landscape and Urban Planning 92: 233–241.
46. Howes A, Maron M (in press) unpublished work.
47. Maron M, Kennedy S (2007) Roads, fire and aggressive competitors: Determinants of bird distribution in subtropical production forests. Forest Ecology and Management 240: 24–31.
48. Fulton GR (2008) A possible nesting association between Pied and Grey ButcherbirdsCracticus nigrogularisandC.torquatusand the Yellow-throated Miner Manorina flavigula. Corella 32: 30–34.
49. Lindenmayer D, Bennett AF, Hobbs R (2010) An overview of the ecology, management and conservation of Australia’s temperate woodlands. Ecological Management & Restoration 11: 201–209.
50. Piper SD, Catterall CP (2003) A particular case and a general pattern: hyperaggressive behaviour by one species may mediate avifaunal decreases in fragmented Australian forests. Oikos 101: 602–614.
51. Kath J, Maron M, Dunn PK (2009) Interspecific competition and small bird diversity in an urbanizing landscape. Landscape and Urban Planning 92: 72–79. 52. Howes AL, Maron M (2009) Interspecific competition and conservation management of continuous subtropical woodlands. Wildlife Research 36: 617– 626.
53. Barrett G, Silcocks A, Barry S, Cunningham R, Poulter R (2003) The new atlas of Australian birds. Melbourne: Royal Australasian Ornithologists Union. 54. Dormann CF, Schweiger O, Augenstein I, Bailey D, Billeter R, et al. (2007)
Effects of landscape structure and land-use intensity on similarity of plant and animal communities. Global Ecology and Biogeography 16: 774–787. 55. Devictor V, Julliard R, Jiguet F (2008) Distribution of specialist and generalist
species along spatial gradients of habitat disturbance and fragmentation. Oikos 117: 507–514.
56. Zurita GA, Bellocq MI (2010) Spatial patterns of bird community similarity: bird responses to landscape composition and configuration in the Atlantic forest. Landscape Ecology 25: 147–158.
57. Decaens T, Margerie P, Aubert M, Hedde M, Bureau F (2008) Assembly rules within earthworm communities in North-Western France - A regional analysis. Applied Soil Ecology 39: 321–335.
58. Hinsch M, Komduer J (2010) Defence, intrusion and the evolutionary stability of territoriality. Journal of theoretical biology 266: 606–613.
59. Wilkinson DM (1999) The disturbing history of intermediate disturbance. Oikos 84: 145–147.
60. Blair R (2004) The effects of urban sprawl on birds at multiple levels of biological organization. Ecology and Society 9: 2.
61. Desrochers A, Hannon SJ (1997) Gap crossing decisions by forest songbirds during the post-fledging period. Conservation Biology 11: 1204–1210. 62. Graham CH (2001) Factors influencing movement patterns of keel-billed
toucans in a fragmented tropical landscape in southern Mexico. Conservation Biology 15: 1789–1798.
63. Robertson OJ, Radford JQ (2009) Gap-crossing decisions of forest birds in a fragmented landscape. Austral Ecology 34: 435–446.
64. Pakeman RJ, Hinsley SA, Bellamy PE (2000) Do assembly rules for bird communities operate in small, fragmented woodlands in an agricultural landsacpe? Community ecology 1: 171–179.
65. Devictor V, Julliard R, Couvet D, Lee A, Jiguet F (2007) Functional homogenization effect of urbanization on bird communities. Conservation Biology 21: 741–751.
66. Foley JA, DeFries R, Asner GP, Barford C, Bonan G, et al. (2005) Global consequences of land use. Science 309: 570–574.