Health Psychology Open July-December 2015: 1 –12 © The Author(s) 2015 DOI: 10.1177/2055102915590317 hpo.sagepub.com
Creative Commons Non Commercial CC-BY-NC: This article is distributed under the terms of the Creative Commons
Attribution-NonCommercial 3.0 License (http://www.creativecommons.org/licenses/by-nc/3.0/) which permits non-commercial use, reproduction and distribution of the work without further permission provided the original work is attributed as specified on the SAGE and Open Access pages (http://www.uk.sagepub.com/aboutus/openaccess.htm).
Introduction
The benefits of physical activity (PA) for health and well-being are well documented (e.g. Biddle and Mutrie, 2001; Brukner and Brown, 2005; Burns and Murray, 2012; Warburton et al., 2006) and the consequences of physical inactivity and sedentary living have also been addressed from both a health implication and an economic cost per-spective (e.g. Department of Health (DH), 2004a, 2009a; Garrett et al., 2004). The Health Survey for England data (HSE, 2003) show that in 2003, only 37 per cent of men and 24 per cent of women met the PA guidelines suggested by the Government at that time (DH, 2005). These levels raised marginally in 2008 to 46 per cent of men and 36 per cent of women meeting the guidelines (HSE, 2008). A sub-sequent re-analysis of the 2008 data using the most recent PA guidelines indicated that 65–66 per cent of men and 53–56 per cent of women met the revised (DH, 2011) PA guidelines (HSE, 2012). As a result, PA is increasingly being considered the best investment in health and has been included into a series of public health policy publications (DH, 2004a, 2004b, 2005, 2009b, 2011; National Institute
for Health and Clinical Excellence (NICE), 2006a, 2006b, 2006c, 2014).
Exercise referral schemes have become a popular method of improving health outcomes and reducing physi-cal inactivity both within the United Kingdom and globally. In response to the rapid growth of schemes from around the year 2000, guidelines (the National Quality Assurance Framework (NQAF)) were produced to assist practitioners and researchers to design and evaluate such schemes (DH, 2002). In the NQAF, it was also advised that psychological measures were more likely than physical measures to show change over a 10-week exercise programme (DH, 2002). The typical duration of a UK exercise referral scheme is
Improving the psychological evaluation
of exercise referral: Psychometric
properties of the Exercise Referral
Quality of Life Scale
Charlotte Hilton
1, Richard Trigg
2and Antoinette Minniti
3Abstract
There is a growing need to assess the psychological outcomes of exercise referral and the National Institute of Health and Care Excellence has called for the routine assessment of life-quality. However, a quality of life scale specific to the requirements of exercise referral is currently unavailable. Therefore, the aim of this study was to produce a quality of life measure for this purpose. The Exercise Referral Quality of Life Scale is a 22-item measure comprising three domains: mental and physical health, injury pain and illness and physical activity facilitators. Exploratory factor analysis determined the initial factor structure and was subsequently confirmed by confirmatory factor analysis. Additional scale properties were also assessed. The scale contributes to the global need for improved consistent psychological outcome assessment of exercise referral.
Keywords
exercise behaviour, health psychology, physical activity, public health psychology, quality of life
1Coventry University, UK 2Nottingham Trent University, UK 3American Psychological Association, USA
Corresponding author:
Charlotte Hilton, Department of Psychology and Behavioural Sciences, Faculty of Health and Life Sciences, Coventry University, James Starley Building, Room JS264, Priory Street, Coventry CV15FB, UK.
10–12 weeks, and because of the diversity in the level and type of evaluation, schemes were advised that they should only be endorsed by practitioners, policy-makers and com-missioners when part of a properly designed and controlled research study to determine effectiveness (NICE, 2006b). Since these initial publications, a Standard Evaluation Framework for Physical Activity Interventions has been developed (National Obesity Observatory, 2012), and more recent guidance for the implementation and evaluation of exercise referral schemes has been produced which specifi-cally states the necessity to include health-related quality of life (QoL) as an outcome measure (NICE, 2014).
There has been much debate regarding the efficacy of exercise referral schemes in terms of their ability to increase individual PA levels and their contribution to health improvements (e.g. Dugdill et al., 2005; Morgan, 2004; Pavey et al., 2011; Riddoch et al., 1998). However, histori-cally, in assessment of such schemes, it was often the case that relevant psychological and environmental parameters (such as access to leisure services, suitable transport and how well the environment outside of structured exercise supports PA behaviour) were ignored (Dugdill et al., 2005). Since the earlier attempts to evaluate exercise referral schemes, efforts have been made to publish findings with respect to the broader psycho-social outcomes of such schemes that also include life-quality (e.g. Murphy et al., 2010). However, because to date there has not been a scale available that is designed to measure exercise-related life-quality within clinical populations specifically, practitioners and researchers have had to resort to the use of generic measures such as the EuroQoL (EQ-5D; Brooks and EuroQoL Group, 1996), for example (Murphy et al., 2010). Consequently, the lack of a specific tool has also resulted in varied generic tools being utilised in an attempt to measure exercise-related life-quality (e.g. SF-36; Brazier et al., 1992; Ware, 1996) which makes comparisons between studies dif-ficult (Pavey et al., 2011) and challenges efforts to draw clear conclusions regarding the psychological impact of exercise referral.
Studies that incorporate more holistic health measures, that include those specific to exercise-related life-quality, can recognise the value of person-centred methods of healthcare practice and focus on the person with the disease rather than the course of the disease itself (Bauman et al., 2003). Furthermore, QoL measures have been recognised as a valuable method of addressing a shift in attention from controlling a patient’s disease to their experience of poten-tial suffering (Cohen et al., 1996). The inclusion of a QoL tool specifically designed for exercise referral is likely to contribute to the necessity to build on the evidence base for the effectiveness of exercise referral – particularly with respect to health-related life-quality outcomes (NICE, 2014). The Exercise Referral Quality of Life Scale (ER-QLS) documents the physical and mental health con-ditions with which individuals have been referred, so there
is capacity to compare total and sub-domain scores accord-ing to these criteria. It is reasonable that perceived life-quality may be affected by health condition(s), so there is a valuable opportunity to explore this further with the same measure consistently which will allow for QoL scores that are comparable across schemes, both nationally and globally.
Six stages of research were undertaken to produce the final measure. Stage 1 utilised a series of five focus groups to generate rich data for the purposes of item development and a conceptual framework of exercise-related life-quality that would inform subsequent psychometric analyses. Stage 2 employed best-practice recommendations from previous research to construct test items and formulate a test meas-ure that was formatted in such a way so as to facilitate its completion and reduce respondent burden. Stage 3 cogni-tively pre-tested these test-pool items to ensure that they were interpreted as intended and to establish appropriate face and content validity. Stage 4 employed a classical test theory (CTT) approach to item reduction and also assessed the initial reliability of the measure through test–retest and internal consistency analyses. Stage 5 of the development of the ER-QLS employed factor-analytic methods of test construction to further reduce the item pool and explore the structure of the final measure. Internal consistency, test– retest reliability, acceptability, content validity and conver-gent and known-groups components of construct validity of the final measure were also assessed in this stage, and the final sixth stage of development employed a confirmatory factor analysis (CFA) to inform the final facture structure of the new measure. This article reports the latter two stages of scale development.
The primary aim of the current study was to develop and validate the ER-QLS, a new QoL measure specific to exer-cise referral settings based on a UK population. The ER-QLS is not intended to be prescriptive. Rather, the intention is to support opportunities to contribute to devel-oping plans for PA promotion within supervised settings (e.g. Bull and Milton, 2010; Hilton et al., 2009; NICE, 2014), contribute to the growing need to evaluate exercise referral schemes more effectively (e.g. NICE, 2006b, 2014) and provide practitioners with the most appropriate tools for the task.
Method
Participants
Ethical approval was obtained from the UK National Research Ethics Service (NRES). All participants were pro-vided with an NRES template information sheet describing the study and provided full written consent to their participation.
The referral schemes that participated in the research programme were invited to do so via telephone. Of the 17 schemes that were approached to act as test sites to generate the respondent data, only one declined due to resource limi-tations, resulting in 16 schemes that participated in total. Exercise referral instructors from each recruitment site con-veniently sampled individuals who were either at the start, in the middle or who had been exercising for up to 12 months post-referral to ask whether they would volunteer to com-plete the test questionnaire. Data from 278 respondents were available and used for analyses. For the purposes of test– retest analysis, a nested convenience subsample of 25 respondents completed the questionnaire twice, 7 days apart. The complete cohort of participants ranged in age from 19 to 87 years (M = 61 years, standard deviation (SD) = 12.81 years). A total of 20 respondents’ ages were missing in the returned data. A greater number of females (n = 148) than males (n = 128) were included in the analysis. Gender information for two respondents was missing. The ethnicity of respond-ents for both the EFA and the CFA and from both the total and the test–retest subsample can be reviewed in Table 1. The number of health conditions for which these respondents were referred can also be reviewed in Table 1. These condi-tions were typical of those for which individuals are referred for exercise (e.g. coronary heart disease risk factors).
For the EFA, the majority of respondents (54%) identi-fied that they were at the mid-stage of their referral pro-gramme (around 6 weeks). While 26 per cent identified that they had completed their initial referral phase of exercise (12 weeks and beyond), the least amount of respondents (20%) identified that they had just started their referral
programme. Therefore, the majority of respondents (80%) had been exposed to at least 6 weeks of exercise and PA.
Of the 25 respondents included in the test–retest analy-sis, participants ranged in age from 36 to 73 years (M = 60 years, SD = 11.94 years). Participant age was pro-vided by all but one individual who was included in the test–retest analysis. A relatively equal number of females (n= 12) and males (n= 13) were represented in the analysis.
As for the entire participant cohort (N = 278), the major-ity of test–retest respondents reported that they were at the mid-stage of their referral (56%). In total, 36 per cent of participants reported that they had completed their initial referral phase of 12 weeks, and 8 per cent of respondents were at the start of their referral.
For the subsequent CFA, participants from a single exer-cise referral scheme were recruited. Data from 1750 respondents were available and used for analysis. Five par-ticipant ages were missing from the returned data. A greater number of females (n = 1230) than males (n = 512) were included in the analysis and there were missing data for eight participants with respect to gender. The ethnicity of respondents from the CFA sample can be reviewed in Table 1. The most commonly cited reasons for referral were weight loss (n = 670), improvements in fitness (n = 246) and diabetes (n = 116). Other commonly cited reasons included hypertension (n = 77), obesity (n = 66), weight maintenance (n = 54), chronic obstructive pulmonary disease (COPD) (n = 43), depression (n = 33), cholesterol (n = 23) and back pain (n = 23). It is important to note that leisure profession-als were not specific in documenting the type of diabetes
Table 1. Ethnicity of participants and number of referred health conditions for total and subsamples.
CFA (N = 1750) EFA (total sample (N = 278)) EFA (subsample (n = 25))
Ethnicity
White 1013 223 22
Mixed 54 1 0
Indian 63 2 0
Pakistani 101 2 1
Bangladeshi 8 0 0
Other Asian 15 4 1
Black Caribbean 262 11 0
Black African 91 2 0
Other Black 24 1 0
Other ethnic group 37 3 0
Unknown 78 19 1
Number of referred health conditions
One 1615 147 17
Two 394 55 6
Three 2 10 2
Four 0 3 0
Unknown 135 63 0
with which individuals had been referred, and therefore, this was unknown. However, subsequent amendments have been made to the reasons for referral section of the ER-QLS to allow for this to be more easily defined.
The majority of respondents (74%) identified that they were at the start of their referral programme, only 0.3 per cent were midway through and 26 per cent identified that they had completed their initial referral phase of exercise (12 weeks and beyond).
Materials
The ER-QLS item pool for the final phase of development contained 29 items. Each item comprised a question that required a response using a 5-point response scale. Question content broadly focussed on issues of physical and psycho-logical well-being as well as issues that related more spe-cifically to the process of engaging in exercise. For example, questions included ‘How would you rate your physical health?’, ‘How would you rate your ability to manage stress?’ and ‘How often do you feel you have achieved something in terms of your physical fitness?’ These 29 items remained from an initial pool of 50, which was generated from a series of focus groups with partici-pants from a local exercise referral scheme. Focus groups explored the experiences of exercise that are of particular importance to QoL before, during and upon completion of a 12-week exercise programme. This pool of 50 items had been reduced to 29 through subsequent phases of question pretesting, using cognitive interviewing techniques (Willis, 2005), and a CTT approach to item analysis. These early stages of item development are reported elsewhere.
The WHOQOL-BREF (Skevington et al., 2004) was used as the comparative generic QoL measure with which to conduct analyses of convergent validity. The WHOQOL-BREF is a 26-item version of the WHOQOL-100 assess-ment and measures four domains: physical, psychological, social and environmental. Mean domain scores are scaled in a positive direction (i.e. higher scores denote higher QoL) and the measure contains three reverse-scored items. The psychometric properties of the WHOQOL-BREF were analysed using cross-sectional data obtained from a survey of adults carried out in 23 countries (N = 11,830). Analyses of internal consistency, item-total correlations, discrimi-nant validity and construct validity through CFA indicated that the WHOQOL-BREF had good to excellent psycho-metric properties of reliability and performed well in pre-liminary tests of validity (Skevington et al., 2004).
The Subjective Exercise Experience Scale (SEES; McAuley and Courneya, 1994) was also used for conver-gent validity testing because of the documented relation-ship between perceptions of mood, mood management and exercise within clinical populations (e.g. Lehrner et al., 1999; Petajan et al., 1996). The SEES consists of a 3-factor measure. Two of the three factors correspond with the
positive and negative poles associated with psychological health, positive well-being and psychological distress, while the third factor represents subjective indicators of fatigue. The internal consistency of the measure (Cronbach’s alpha) was reported for positive well-being (0.86), psycho-logical distress (0.85) and fatigue (0.88). The convergent and discriminant validity of the SEES were established by correlations with the Positive and Negative Affect Schedule (PANAS; Watson et al., 1988), the State Anxiety Inventory (SAI; Spielberger et al., 1970) and the Feeling Scale (FS; Hardy and Rejeski, 1989). The SEES is scored dimension-ally with a higher score for positive well-being reflecting a better state of well-being and a higher score for personal distress and fatigue indicating greater distress and fatigue, respectively.
Procedure and analyses
EFA. For the EFA phase of analysis, data were obtained by exercise referral instructors who were employed by one of the 16 participating schemes across England. Participants who had been referred for exercise for health improvement were conveniently sampled (N = 278) and self-completed each of the scales, including the one under construction. The item pool was further reduced using factor-analytic methods of test construction. A principal component analy-sis (PCA) with varimax rotation was used to explore the structure of the 29 items. Items were rejected if they failed to display loadings greater than 0.4 on any of the main com-ponents. The number of components extracted was deter-mined by parallel analysis. After item rejection, the PCA was re-run in order to explore the structure of the remaining items and develop subscales within the ER-QLS. An assess-ment of scale reliability included analysis of internal con-sistency (Cronbach’s alpha and item-total correlations) and test–retest reliability over a 1-week period (intraclass cor-relation coefficient).
QoL scale development research, the current study consid-ered Pearson’s correlation coefficients of less than 0.2 as very weak, from 0.2 to 0.35 as weak, from greater than 0.35 to 0.5 as moderate and of more than 0.5 as strong (Schunemann et al., 2010).
The known-groups component of construct validity was assessed by a three-way analysis of variance (ANOVA) that assessed the level of total test score variance for those at the start, midway and after completion of their exercise pro-gramme. It was expected that those who had completed their exercise programme would report the highest level of QoL because this group had the greatest amount of expo-sure to exercise (Laforge et al., 1999).
Confirmatory factor analysis. Data from a single UK exercise referral scheme (N = 1750) were used to confirm the factor structure of the ER-QLS. Missing values were replaced with median values before employing a good-ness-of-fit approach to factor structure assessment with SPSS Amos (v20). It is generally accepted that confirma-tory models will be shown to be false when tested with a large sample size such as that of the current study. Consequently, applied confirmatory factor analysis (CFS) research tends to employ sample size independent indices (Hu and Bentler, 1999; Marsh et al., 1988, 2005; Yu, 2002). The Comparative Fit Index (CFI; Bentler, 1990) and the Tucker Lewis Index (TLI; Tucker and Lewis, 1973) allow for the measurement of how much better the proposed model fits the data compared to a baseline model whereby all variables are uncorrelated. For these indices, values above 0.90 indicate reasonable model fit and values above 0.95 indicate good model fit (Bentler, 1990; Hu and Bentler, 1999). The root mean-square error of approximation (RMSEA; Steiger, 1990) was also consid-ered. Values of <0.05 are considered good, 0.05–0.010 moderate and >0.10 poor model fit (Hu and Bentler, 1999).
Results
Initial factor structure
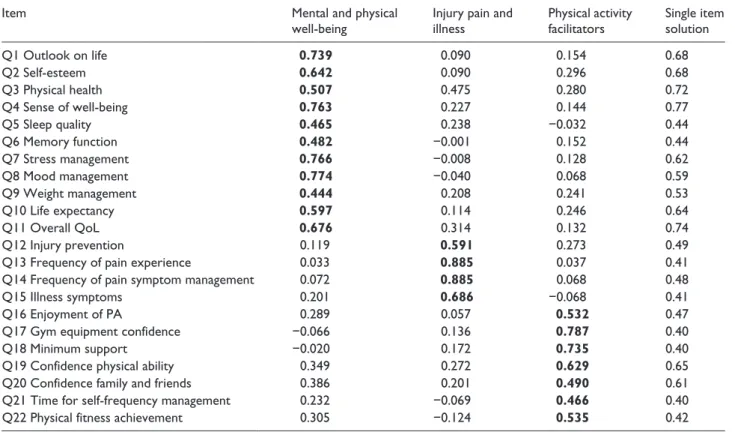
PCA of the 29 items resulted in seven items being rejected from the item pool as they failed to load on any of the main components. After rejection of these items, PCA was re-run on the remaining 22 items. The 22 items were grouped into a statistically and a conceptually coherent three- component structure. Parallel analysis confirmed the pres-ence of at least three components within the items. The three-component solution explained a total of 50.68 per cent of the variance, with Component 1 (mental and physi-cal well-being) contributing 31.48 per cent, Component 2 (injury pain and illness) contributing 10.68 per cent and Component 3 (physical activity facilitators) contributing 8.52 per cent of the variance, respectively. Table 2 displays the loadings of items on these three components. All 22
items included in the three-component solution also loaded (>0.4) onto a single component if a one-component solu-tion was forced.
As a consequence, the final scale may be scored dimen-sionally or as a single global score. The ER-QLS adopts a scoring system of 1 to 5 for each item with a higher item and scale score indicating a better perception of exercise-related life-quality. A reverse scoring of four items is required. Total scores are presented in the range of 22–110. Total scores for the dimension mental and physical
well-being are presented in the range of 11–55. Total scores for
the dimension injury pain and illness are presented in the range of 4–20. Total scores for the dimension physical
activity facilitators are presented in the range of 7–35.
Reproducibility
The 7-day test–retest reliability of the final 22 items scored as a single scale was assessed by the intraclass correlation coefficient of scores across the time period. This indicated an acceptable level of reliability (r19 = 0.72, p < 0.01). The
test–retest reliability of the three subscales was excellent, with r23 = 0.95 (p < 0.001) for mental and physical
well-being, r21 = 0.80 (p < 0.001) for injury pain and illness and r24 = 0.86 (p < 0.01) for physical activity facilitators.
Internal consistency
The internal consistency of the 22-item ER-QLS was good with a Cronbach’s alpha of 0.88. This value could not be improved by deleting any of the items. Additionally, all 22 items met the item-total correlation criteria of r > 0.3 (Skevington et al., 2004). The internal consistency of the three ER-QLS subscales was also good, with a Cronbach’s alpha of 0.87 for mental and physical well-being, 0.81 for injury pain and illness and 0.77 for physical activity facilitators.
Construct validity
The descriptive statistics of the data from the ER-QLS (total score and subscales) and each of the dimensions of the SEES and the WHOQOL-BREF can be reviewed in Table 3.
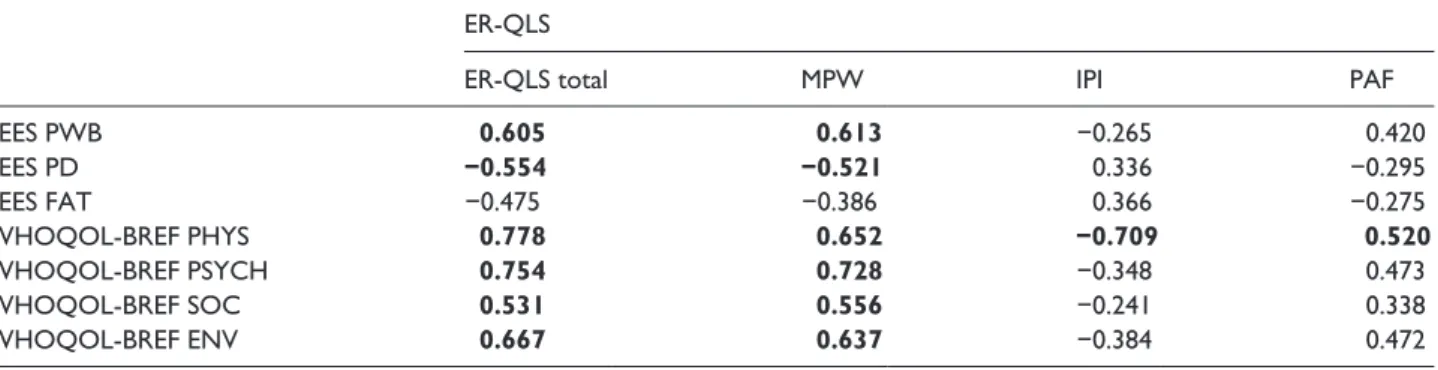
was with the psychological well-being subscale. The cor-relation values observed between the new measure and those of the WHOQOL-BREF and the SEES also support the convergent validity of the ER-QLS. The variance in the strength of the correlations between the ER-QLS scores and the respective dimensions of the WHOQOL-BREF would also suggest that the test instrument is meas-uring components of life-quality that differ to those
generic dimensions assessed by the WHOQOL-BREF (Streiner and Norman, 2008).
The descriptive statistics of the data used to assess the known-groups validity component of construct validity can be found in Table 5. There were significant differences between the mean total ER-QLS score for each of the three groups: those at the start of an exercise referral programme, those mid-programme and those at the completion, F(2,
Table 2. EFA factor loadings and domain titles (N = 278).
Item Mental and physical
well-being
Injury pain and illness
Physical activity facilitators
Single item solution
Q1 Outlook on life 0.739 0.090 0.154 0.68
Q2 Self-esteem 0.642 0.090 0.296 0.68
Q3 Physical health 0.507 0.475 0.280 0.72
Q4 Sense of well-being 0.763 0.227 0.144 0.77
Q5 Sleep quality 0.465 0.238 −0.032 0.44
Q6 Memory function 0.482 −0.001 0.152 0.44
Q7 Stress management 0.766 −0.008 0.128 0.62
Q8 Mood management 0.774 −0.040 0.068 0.59
Q9 Weight management 0.444 0.208 0.241 0.53
Q10 Life expectancy 0.597 0.114 0.246 0.64
Q11 Overall QoL 0.676 0.314 0.132 0.74
Q12 Injury prevention 0.119 0.591 0.273 0.49
Q13 Frequency of pain experience 0.033 0.885 0.037 0.41
Q14 Frequency of pain symptom management 0.072 0.885 0.068 0.48
Q15 Illness symptoms 0.201 0.686 −0.068 0.41
Q16 Enjoyment of PA 0.289 0.057 0.532 0.47
Q17 Gym equipment confidence −0.066 0.136 0.787 0.40
Q18 Minimum support −0.020 0.172 0.735 0.40
Q19 Confidence physical ability 0.349 0.272 0.629 0.65
Q20 Confidence family and friends 0.386 0.201 0.490 0.61
Q21 Time for self-frequency management 0.232 −0.069 0.466 0.40
Q22 Physical fitness achievement 0.305 −0.124 0.535 0.42
Items in bold denote significant domain factor loadings (>0.4).
Table 3. Descriptive statistics for global total and dimension total scores of the ER-QLS and dimension total scores of the SEES
and the WHOQOL-BREF (N = 278).
N Mean SD Range (min–max)
ER-QLS 234 77.04 11.46 45.00–105.00
ER-QLS MPW 261 39.50 6.89 17.00–55.00
ER-QLS IPI 262 10.95 3.65 4.00–20.00
ER-QLS PAF 260 24.60 4.29 10.00–35.00
SEES PWB 267 18.34 5.23 4.00–28.00
SEES PD 263 6.88 4.39 4.00–25.00
SEES FAT 265 10.42 6.13 4.00–28.00
WHOQOL-BREF PHYS 260 24.68 5.55 9.00–35.00
WHOQOL-BREF PSYCH 273 21.87 4.13 9.00–30.00
WHOQOL-BREF SOC 236 11.08 2.49 3.00–17.00
WHOQOL-BREF ENV 270 31.25 4.84 9.00–40.00
226) = 5.07, p = 0.007. Levine’s statistic indicated that the variance between mean scores for the three groups was not significant (F = 0.969, p > 0.05). The sample sizes were une-qual (programme start, n = 45; mid-programme, n = 123; programme completion, n = 61); therefore, a Games-Howell procedure was used to assess the specificity of this vari-ance. Results indicated that the largest significant differ-ence in mean total scores were between those who had just started their exercise referral programme and those who had completed (F = 0.006, p > 0.05). There was also a sig-nificant difference in mean total scores for those who had just started their referral programme and those who were midway through (F = 0.03, p > 0.05). Differences in mean total scores for those respondents midway through their referral programme and those who had completed were not significant (F = 0.55, p > 0.05).
Sub-dimensionally, for the mental and physical well-being domain, there was a significant difference in mean
scores for those who had started their programme of exer-cise and those who had completed (F = 0.011, p > 0.05) and also for those who had started their programme and those who were midway through (F = 0.040, p > 0.05). However, no such differences were observed for those midway through their referral programme and those who had com-peted (F = 0.707, p > 0.05). With respect to the injury pain and illness domain, there was no significant difference in means scores for any of the three referral stages: starters and completers (F = 0.929, p > 0.05), starters and those who were midway through (F = 0.939, p > 0.05) and those who were midway through and those who had completed (F = 0.654, p > 0.05). With respect to the physical activity facilitators domain, there were significant differences in the mean scores for those who had started their programme of exercise and those who had completed (F = 0.005,
p > 0.05) and also for those who had started their pro-gramme and those who were midway through (F = 0.023,
Table 4. Total and sub-domain correlations between the ER-QLS, the WHOQOL-BREF and the SEES (N = 278).
ER-QLS
ER-QLS total MPW IPI PAF
SEES PWB 0.605 0.613 −0.265 0.420
SEES PD −0.554 −0.521 0.336 −0.295
SEES FAT −0.475 −0.386 0.366 −0.275
WHOQOL-BREF PHYS 0.778 0.652 −0.709 0.520
WHOQOL-BREF PSYCH 0.754 0.728 −0.348 0.473
WHOQOL-BREF SOC 0.531 0.556 −0.241 0.338
WHOQOL-BREF ENV 0.667 0.637 −0.384 0.472
ER-QLS: Exercise Referral Quality of Life Scale; MPW: mental and physical well-being; IPI: injury pain and illness; PAF: physical activity facilitators; PWB: psychological well-being; PD: psychological distress; FAT: fatigue; PHYS: physical; PSYCH: psychological; SOC: social; ENV: environment. Values marked in bold denote the strongest correlations (>0.5). All correlations were significant at p < 0.01.
Table 5. Descriptive statistics for known-group validity analyses (N = 278).
N Mean SD Range (min–max)
Total scores
Programme start 45 72.80 10.97 50.00–93.00
Mid programme 123 77.76 11.23 45.00–105.00
Programme completion 61 79.59 11.05 53.00–102.00
MPW
Programme start 45 71.55 6.35 53.00–82.00
Mid programme 123 74.13 6.28 56.00–88.00
Programme completion 61 74.80 5.36 61.00–88.00
IPI
Programme start 45 10.86 3.81 4.00–19.00
Mid programme 123 11.07 3.70 5.00–20.00
Programme completion 61 10.62 3.38 4.00–18.00
PAF
Programme start 45 22.81 4.42 10.00–33.00
Mid programme 123 24.77 3.96 14.00–35.00
Programme completion 61 25.57 4.58 14.00–35.00
p > 0.05), although differences in mean total scores for those respondents midway through their referral pro-gramme and those who had completed were not significant (F = 0.445, p > 0.05).
Acceptability
For the ER-QLS, data were missing most frequently in response to the item that assessed levels of perceived confi-dence regarding the use of gym equipment (n = 8; 3%). Items that had the lowest level of missing data included those regarding outlook on life (n = 1), self-esteem (n = 1) and sleep quality (n = 1). The item regarding overall QoL was responded to by all 278 participants (100%).
Confirmatory factor analysis
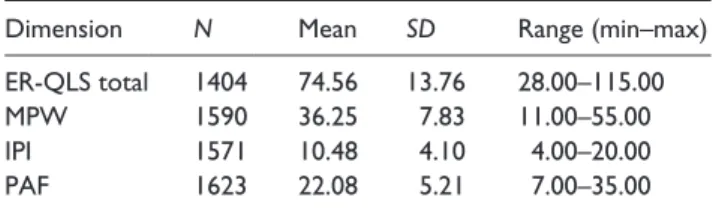
The descriptive data for the CFA can be viewed in Table 6. The internal consistency of the 22-item ER-QLS was good with a Cronbach’s alpha of 0.85. Additionally, all 22-items met the item-total correlation criteria of r > 0.3 (Skevington et al., 2004). The internal consistency of the three ER-QLS subscales was also good, with a Cronbach’s alpha of 0.90 for mental and physical well-being, 0.86 for injury pain and illness and 0.83 for physical activity facilitators. Additionally, the CFI = 0.97, TLI = 0.96 and RMSEA = 0.04 indicated a good fit of data and sub-dimen-sionally, all factor loadings exceeded the critical value of >0.4 (Costello and Osborne, 2005). However, when assessed as a single-item solution for the purposes of global scoring, three of the four items belonging to the injury pain and illness domain fell fractionally short of the >0.04 criti-cal value. The single and three-dimension factor loadings can be reviewed in Table 7. In order to contribute to provisional insights into the responsiveness of the scale (i.e. the ability for the measure to detect change over time), known-groups validity was also re-assessed. The sample sizes were unequal (programme start 74% and programme completion 26%); therefore, a Games-Howell procedure was used to assess the specificity variance. There was a sig-nificant difference in mean total scores for the ER-QLS total score (p < 0.05), for mental and physical well-being total score (p < 0.05) and for physical and mental well-being score (p < 0.05). Differences in mean scores were observed for injury pain and illness total scores at the start and completion of the programme, although these differ-ences were not significant (p = 1.00, p < 0.05).
Discussion
The fundamental aim of the current research was to respond to the current shortfall in the consistent psychological eval-uation of exercise referral schemes via the design and vali-dation of a measure of life-quality that is particularly sensitive and relevant to exercise referral settings. The
range of tools used and therefore the challenges of compar-ing outcomes across schemes coupled with the lack of measurement specificity were the key contributors to the rationale for the development of the ER-QLS and the psychometric properties of the scale would suggest that the ER-QLS has the capacity to improve these practice- and research-focussed challenges.
The primary purpose of a new scale has to be that it is representative and relevant for the population for whom it is intended. Therefore, the source of items is of critical importance. No amount of statistical manipulation can account for poorly chosen questions, and patients rather
Table 6. Descriptive data for CFA (N = 1750).
Dimension N Mean SD Range (min–max)
ER-QLS total 1404 74.56 13.76 28.00–115.00
MPW 1590 36.25 7.83 11.00–55.00
IPI 1571 10.48 4.10 4.00–20.00
PAF 1623 22.08 5.21 7.00–35.00
MPW: mental and physical well-being; IPI: injury pain and illness; PAF: physical activity facilitators; ER-QLS: Exercise Referral Quality of Life Scale; SD: standard deviation.
Table 7. CFA factor loadings (N = 22).
Item Domain
loading
Single loading
MPW
Outlook on life 0.70 0.60
Self-esteem 0.69 0.59
Physical health 0.73 0.61
Well-being 0.76 0.65
Sleep quality 0.57 0.48
Memory function 0.51 0.44
Stress management 0.65 0.56
Mood management 0.68 0.59
Weight management 0.61 0.54
Life expectancy 0.70 0.62
Quality of life 0.72 0.62
IPI
Injury preventing activity 0.78 0.40
Frequency of pain 0.84 0.39
Frequency of pain management 0.88 0.39
Frequency of illness 0.73 0.37
PAFs
Physical activity enjoyment 0.68 0.54
Gym equipment confidence 0.58 0.47
Leisure centre support 0.63 0.52
Confidence in physical ability 0.71 0.58
Confidence activities with others 0.60 0.45
Time for self 0.47 0.53
Frequency of meeting fitness goals 0.73 0.57
than clinicians (or what is often termed as the ‘expert opin-ion’ approach to item generation) have been deemed as ‘an excellent source of items’ (Streiner and Norman, 2008: 18). Items for the ER-QLS were generated from the reports of exercise referral participants who had completed their ini-tial 12 weeks of exercise and were, therefore, in a favoura-ble position to communicate their experience of exercise with specific reference to perceptions of life-quality.
The psychometric procedures undertaken at scale level mean that the reliability and the validity of the ER-QLS can be expressed in a number of ways and have been presented here. The internal consistency of the ER-QLS as a single scale or three subscales, as assessed by Cronbach’s alpha, was good. The test–retest reliability at scale level suggests that scores on the ER-QLS are stable over a 1-week period. The construct validity of the ER-QLS was supported by predicted correlations with the WHOQOL-BREF, the SEES and also the known-groups component of construct valid-ity, whereby people at the beginning of an exercise referral programme displayed lower total QoL ratings than those at the midpoint or end of the programme. This range of psy-chometric assessments is comparable with other newly developed QoL scales reported within the literature (e.g. Skevington et al., 2004) and also reflects recommended psychometric procedures for evaluating health-related quality of life measures (Hays et al., 1993).
The sub-domain scores for mental and physical well-being and also physical activity facilitators were lower for starters than completers. However, no such differences were observed for the injury pain and illness domain. This would suggest that the ER-QLS is particularly sensitive to detect-ing changes in perceived exercise-related life-quality that are related to mental and physical health and also lifestyle factors that facilitate PA. It is also plausible that pain and injury could be associated with, or as a consequence of, exercise and in this respect, it would not have been surpris-ing to observe scores that would reflect a higher incidence of pain and/or injury and therefore a lower perceived QoL for this domain; however, this was not the case. Furthermore, the injury pain and illness domain contains only four items and these results should be viewed with caution until further field work to assess the responsiveness of the scale is com-pleted. The small number of items would also account for the lower factor loadings of these items when assessed as a single-factor solution for the purposes of global scoring (Table 7). However, given that frequency of pain (0.39), fre-quency of pain management (0.39) and frefre-quency of illness (0.37) are approaching the critical value of >0.4, it makes much more practical sense to suggest that the ER-QLS be scored both sub-dimensionally and globally. Additional field testing that is already underway will contribute to fur-ther understanding the scales performance in this way.
With respect to the acceptability of the ER-QLS, the fre-quency of missing responses did not exceed the level of 4 per cent suggested by Fayers and Machin (2000) as an
acceptable level for QoL assessments. Data were missing most frequently in response to levels of perceived confidence regarding the use of gym equipment (n = 8). It is likely that this item was missed by some respondents because not all those who completed the test measure were referred to a lei-sure centre that required the use of gym equipment. Some respondents were referred into group exercise classes or swimming, for example. While the ER-QLS is intended for use in settings whereby it is typical that those referred make use of gym equipment, further field testing may indicate that the ER-QLS has the capacity to be used more broadly and if this is the case, this question may require an amendment to reduce the potential for missing responses.
The ER-QLS is unique in that it represents the first measure of life-quality to be designed specifically for exer-cise referral. Angermeyer et al. (2001) have asserted that generic QoL assessments, such as the EQ-5D, cannot replace specific instruments which cover the characteristic living conditions of a particular patient group. This view-point perhaps explains why there are so many measures of life-quality available that have been designed to focus upon a specific population or disease state (e.g. Kolotkin et al., 2001), and the ER-QLS is no exception.
At every phase of the current research, the ER-QLS was designed with the assessment of exercise-related life-qual-ity in mind. This body of work employed a patient-/client-focussed approach to item generation. Consequently, participants who were representative of the population for whom the measure is intended have acted as the primary source for shaping conceptual understandings of what indi-cators represent exercise-related life-quality. Each phase of scale construction and validation were purposefully tar-geted towards establishing the final scale into a meaningful measure of life-quality, and the structural analysis and exploration of convergent validity have provided valuable insights into the domains of life-quality that are particularly relevant to the evaluation of exercise referral programmes, namely, mental and physical well-being, injury pain and ill-ness and physical activity facilitators.
In summary, these correlation analyses suggested that the mental and physical well-being domain of the ER-QLS is most closely aligned with those aspects of QoL assessed by more generic measures (e.g. WHOQOL-BREF). However, the ER-QLS offers added value and specificity because it is likely that the wording of items within the mental and physi-cal well-being domain will be more meaningful for respond-ents as they specifically relate to exercise behaviour.
and environmental aspects of life-quality. However, as mentioned previously, the wording of items contained within these domains results in a measure that is more suited to exercise referral. For example, one of the items grouped into the injury pain and illness domain asks, ‘How much does any injury you may have prevent you from being physically active?’ One of the items grouped into the physical activity facilitators domain asks, ‘How confident are you that you can exercise in a leisure centre with mini-mum support?’ Therefore, the ER-QLS can measure aspects of QoL that are beyond the scope of generic measures and thus provide outcome measurement that is potentially more successful in reflecting the concerns of those referred and who implement exercise referral programmes.
Again, this is aligned with the aim of the development of health-related QoL measures that target indicators particu-larly relevant to the ill-health condition for which they have been constructed (e.g. Doward et al., 2003; Las Hayas et al., 2006); although it is worth noting that the measurement of life-quality and health-related life-quality is a complex phe-nomenon, and the experience of illness can further compli-cate endeavours to capture these valuable data. The ER-QLS is no exception to these challenges, particularly given that the population for whom the scale is intended is likely to present with a range of illnesses and co-morbidities as reflected in the samples of participants used to validate the measure. While the psychometric properties of the ER-QLS would suggest that the scale can reliably measure exercise-related QoL (as demonstrated through the test–retest analy-sis), and that known-groups validity indicates that the scale may also detect changes in QoL over time, it is not unusual for the course of some illnesses to affect a person’s ability to maintain exercise and therefore contribute to improvements in perceived life-quality. Furthermore, and as mentioned pre-viously, there is also the possibility that for some health con-ditions, an increase in PA could increase perceptions of pain and discomfort, and this may be reflected in the global and injury pain and illness sub-domain score of the ER-QLS.
Health and exercise practitioners have a growing est in capturing more holistic outcomes from varied inter-ventions designed to tackle health inequalities and reduce disease. Consequently, measures of life-quality have been deemed as the ‘essence of healthcare’ (Holmes, 2005: 493). Alongside physiological indices, such measures have a key role to play in monitoring health outcomes at the patient/ client level. However, generic QoL may be more difficult to measure than disease- or population-specific QoL, espe-cially given that there is little agreement regarding how to define the term (e.g. Holmes, 2005; Hunt, 1997). While dis-ease- or population-specific measures attempt to navigate this difficulty, inadequate explanations of precisely what these instruments measure, and the lack of any theoretical or conceptual considerations, ultimately make the claims regarding the specificity and sensitivity of these QoL meas-ures difficult to understand.
The ER-QLS is a reliable and valid measure of exercise-related life-quality that has been developed from a mixed methodological research approach, which has included pur-poseful phases of research to meet the overarching research aim. A particular strength of the resultant scale is that it responds directly to recent NICE (2014) guidance regard-ing the necessity for schemes to monitor quality of life out-comes and provides practitioners with a tool specifically designed for this purpose. A 22-item scale means that it is not overly burdensome on respondents or scheme person-nel and has the capacity to be combined with additional evaluative measures. However, a current limitation of the scale is that until data are collected from a number of schemes across the United Kingdom, which has started to integrate the ER-QLS into practice, it is unknown what the practical application and feasibility of the scale will be. Feasibility considerations related to the integration of new scales into practice are shared by all newly constructed measures and these considerations will be addressed in fur-ther field testing.
While the ER-QLS is intended to support psychological outcome assessment, it is of critical importance that more process-related factors are not overlooked. This is particu-larly important given that exercise referral schemes are essentially tasked with supporting changes in PA behaviour. For example, behaviour change counselling such as moti-vational interviewing (Miller and Rollnick, 2012) and the use of qualitative methods should be encouraged to contrib-ute to supporting exercise and PA behaviour in the long-term. The ER-QLS is intended to contribute to the ongoing development of the evidence base for the broader impact of exercise referral schemes. More specifically, the scale responds to recent recommendations to include health-related life-quality outcome measures within evaluation protocols (NICE, 2014) but with the added value of rele-vance, appropriateness and the capacity for consistency of measurement across schemes globally.
Acknowledgements
The research team would like to thank the personnel and partici-pants of the exercise referral schemes who were involved in this study.
Declaration of conflicting interests
None declared.
Funding
This research received no specific grant from any funding agency in the public, commercial or not-for-profit sectors.
References
Bauman AE, Fardy JH and Harris PG (2003) Why bother with patient-centred care? Medical Journalists Association 179: 253–256.
Bentler PM (1990) Comparative fit indices in structural models. Psychological Bulletin 107: 238–246.
Biddle SJH and Mutrie N (2001) Psychology of Physical Activity: Determinants, Well-Being and Interventions. London: Routledge.
Brazier JE, Harper R, Jones NMB, et al. (1992) Validating the SF-36 health survey questionnaire: New outcome measure for primary care. British Medical Journal 305: 160–164. Brooks R and EuroQoL Group (1996) EuroQoL: The current state
of play. Health Policy 37(1): 53–72.
Brukner PD and Brown WJ (2005) Is exercise good for you? Medical Journal of Australia 183: 538–541.
Burns H and Murray AD (2012) Creating health through physical activity. British Journal of Sports Medicine 48: 167–169.
Cohen SR, Mount BM and MacDonald N (1996) Defining quality of life. European Journal of Cancer 32(5): 753–754. Costello AB and Osborne JW (2005) Best practices in
explora-tory factor analysis: Four recommendations for getting the most from your analysis. Practical Assessment, Research and Evaluation 10(7): 225–234.
Department of Health (DH) (2002) Exercise Referral Systems: A National Quality Assurance Framework. London: DH. Department of Health (DH) (2004a) At least Five a Week:
Evidence of the Impact of Physical Activity and Its Relationship to Health – A Report from the Chief Medical Officer. London: DH.
Department of Health (DH) (2004b) Choosing Health: Making Healthy Choices Easier. London: DH.
Department of Health (DH) (2005) Choosing Activity: A Physical Activity Action Plan. London: DH.
Department of Health (DH) (2009a) Annual Report to the Chief Medical Officer. London: DH.
Department of Health (DH) (2009b) Be Active, Be Healthy: A Plan for Getting the Nation Moving. London: DH.
Department of Health (DH) (2011) Physical Activity Guidelines for Adults (19–64 years). London: DH.
Doward LC, Spoonber A, Cook SA, et al. (2003) Development of the ASQoL: A quality of life instrument specific to anky-losing spondylitis. Annuals of the Rheumatic Diseases 62: 20–26.
Dugdill L, Graham RC and McNair F (2005) Exercise referral: The public health panacea for physical activity promotion? A critical perspective of exercise referral schemes; their devel-opment and evaluation. Ergonomics 48: 1390–1410. Fayers PM and Machin D (2000) Quality of Life: Assessment,
Analysis and Interpretation. Chichester: John Wiley & Sons. Garrett NA, Brasure M, Schmitz KH, et al. (2004) Physical
inactivity direct cost to a health plan. American Journal of Preventative Medicine 27: 304–309.
Hardy CJ and Rejeski WJ (1989) Not what, but how one feels: The measurement of affect during exercise. Journal of Sport & Exercise Psychology 11: 304–317.
Hays RD, Anderson R and Revicki D (1993) Psychometric con-siderations in evaluating health-related quality of life meas-ures. Quality of Life Research 2(6): 441–449.
Health Survey for England (HSE) (2003) Physical Activity in Adults. London: The Health and Social Care Information Centre.
Health Survey for England (HSE) (2008) Physical Activity in Adults. London: The Health and Social Care Information Centre.
Health Survey for England (HSE) (2012) Physical Activity in Adults. London: The Health and Social Care Information Centre.
Hilton CE, Milton K and Bull FC (2009) Let’s get moving: A feasibility trial of a ‘physical activity care pathway’ in pri-mary care settings (abstract). Journal of Sport and Exercise Sciences 26 (Suppl. 2): 43.
Holmes S (2005) Assessing the quality of life – Reality or impos-sible dream? A discussion paper. International Journal of Nursing Studies 42(4): 493–501.
Hu LT and Bentler PM (1999) Cutoff criteria for fit indexes in covariance structure analysis: Conventional criteria versus new alternatives. Structural Equation Modeling 6: 1–55. Hunt SM (1997) The problem of quality of life. Quality of Life
Research 6: 205–212.
Kolotkin RL, Crosby RD, Kosloski KD, et al. (2001) Development of a brief measure to assess quality of life in obesity. Obesity Research 9(2): 102–111.
Laforge RG, Rossi JS, Prochaska JO, et al. (1999) Stage of regu-lar exercise and health-related quality of life. Preventative Medicine 28(4): 349–360.
Las Hayas CL, Quintana JM, Padierna À, et al. (2006) The new questionnaire health-related quality of life for eating disor-ders showed good reliability and validity. Journal of Clinical Epidemiology 59: 192–200.
Lehrner J, Kalchmayr R, Series W, et al. (1999) Health-related quality of life (HRQOL), activity of daily living (ADL) and depressive mood disorder in temporal lobe epilepsy patients. Seizure 8(2): 88–92.
McAuley E and Courneya K (1994) The Subjective Exercise Experiences Scale (SEES): Development and preliminary val-idation. Journal of Sport & Exercise Psychology 16: 163–177. Marsh HW, Balla JR and McDonald RP (1988) Goodness-of-fit
indices in confirmatory factor analysis: The effect of sample size. Psychological Bulletin 102: 391–410.
Marsh HW, Hau KT and Grayson D (2005) Goodness-of-fit eval-uation in structural eqeval-uation modeling. In: Maydeu-Olivares A and McArdle J (eds) Contemporary Pychometrics. Hillsdale, NJ: Lawrence Erlbaum Associates, pp. 275–340. Miller WR and Rollnick S (2012) Motivational Interviewing:
Helping People Change (3rd edn). London: Guilford Press. Morgan O (2004) Approaches to increase physical activity:
Reviewing the evidence for exercise referral schemes. Journal of the Royal Institute for Public Health 119: 361–370. National Institute for Health and Clinical Excellence (NICE)
(2006a) A Rapid Review of the Effectiveness of Exercise Referral Schemes to Promote Physical Activity in Adults. London: The Stationery Office.
Murphy S, Raisanen L, Moore G, et al. (2010) A pragmatic ran-domised controlled trial of the Welsh National Exercise Referral Scheme: protocol for trial and integrated economic and process evaluation. BMC Public Health 10: 352–364. National Institute for Health and Clinical Excellence (NICE)
Physical Activity: Brief Interventions in Primary Care, Exercise Referral Schemes, Pedometers and Community-Based Exercise Programmes for Walking and Cycling. London: The Stationery Office.
National Institute for Health and Clinical Excellence (NICE) (2006c) Implementation Advice: Four Commonly Used Methods to Increase Physical Activity. London: The Stationery Office. National Institute for Health and Clinical Excellence (NICE)
(2014) Exercise Referral Schemes to Promote Physical Activity. London: The Stationery Office.
National Obesity Observatory (2012) Standard evaluation frame-work for physical activity interventions. Available at: http:// www.noo.org.uk/uploads/doc/vid_16722_SEF_PA.pdf (accessed 22 December 2014).
Pavey TG, Anokye N, Taylor AH, et al. (2011) The clinical effec-tiveness and cost effeceffec-tiveness of exercise referral schemes: A systematic review and economic evaluation. Available at: http://bura.brunel.ac.uk/bitstream/2438/8032/3/Fulltext.pdf (accessed 22 December 2014).
Petajan JH, Gappmaier E, White AT, et al. (1996) Impact of aero-bic training on fitness and quality of life in multiple sclerosis. Annals of Neurology 39(4): 432–441.
Riddoch C, Puig-Ribera A and Cooper A (1998) Effectiveness of Physical Activity Schemes in Primary Care: A Review. London: Health Education Authority.
Schunemann HJ, Sperati F, Barba M, et al. (2010) An instru-ment to assess quality of life in relation to nutrition: Item generation, item reduction and initial validation. Health and Quality of Life Outcomes 8(26): 2–13.
Skevington SM, Lofty M and O’Connell KA (2004) The World Health Organization’s WHOQOL-BREF quality of life
assessment: Psychometric properties and results of the inter-national field trial. A report from the WHOQOL Group. Quality of Life Research 13(2): 299–310.
Spielberger CD, Gorsuch RL and Luschene R (1970) State-Trait Anxiety Inventory Manual. Palo Alto, CA: Consulting Psychologists Press.
Steiger JH (1990) Structural model evaluation and modification: An interval estimation approach. Multivariate Behavioural Research 25: 173–180.
Streiner DL and Norman GR (2008) Health Measurement Scales: A Practical Guide to Their Development and Use (4th edn). New York: Oxford University Press.
Tucker LR and Lewis C (1973) The reliability coefficient for maximum likelihood factor analysis. Psychometrika 38: 1–10.
Warburton DER, Nicol CW and Bredin SSD (2006) Health ben-efits of physical activity: The evidence. Canadian Medical Journal Association 174: 801–809.
Ware JEJ (1996) The SF-36 health survey. In: Spiker B (ed.) Quality of Life and Pharmacoeconomics in Clinical Trials (2nd edn). Philadelphia, PA: Lippincott-Raven, pp. 337– 345.
Watson D, Clark LA and Tellegen A (1988) Development and validation of brief measures of positive and negative affect: The PANAS scales. Journal of Personality and Social Psychology 54: 1063–1070.
Willis GB (2005) Cognitive Interviewing: A Tool for Improving Questionnaire Design. London: SAGE.