P. Jordan, A. Arnscheidt, H. McGrogan and S. McCormick Hydrol. Earth Syst. Sci., 11(1), 372381, 2007
www.hydrol-earth-syst-sci.net/11/372/2007 © Author(s) 2007. This work is licensed under a Creative Commons License.
Characterising phosphorus transfers in rural catchments using a
continuous bank-side analyser
P. Jordan, A. Arnscheidt, H. McGrogan and S. McCormick
Environmental Sciences Research Institute, School of Environmental Sciences, University of Ulster, Coleraine BT52 1SA, Northern Ireland
Email for corresponding author: [email protected]
Abstract
A six-month series of high-resolution synchronous stream discharge and total phosphorus (TP) concentration data is presented from a 5 km2 agricultural catchment in the Lough Neagh basin, Northern Ireland. The data are hourly averages of 10-minute measurements using a new bankside, automatic, continuous monitoring technology. Three TP transfer event-types occur in this catchment: (1) chronic, storm independent transfers; (2) acute, storm dependent transfers; (3) acute, storm independent transfers. Event-type 2 transferred over 90% of the total 279 kg TP load in 39% of the total period; it corresponded to diffuse transfers from agricultural soils. Event-types 1 and 3, however, maintained the river in a highly eutrophic state between storm events and were characteristic of point source pollution, despite there being no major industrial or municipal point sources. Managing P transfers at the catchment scale requires a robust monitoring technology to differentiate between dynamic, multiple sources and associated event types and so enable a reliable assessment of the performance of mitigation measures, monitored at catchment outlets. The synchronous and continuous TP and discharge data series generated in this study demonstrate how this is possible.
Keywords: total phosphorus, phosphorus, phosphorus transfers, continuous monitoring, Lough Neagh catchment
Introduction
Monitoring phosphorus (P) transfers from river basins will be important in implementing the Water Framework Directive, especially in eutrophic catchments. In rivers, sample resolution will be of further importance when monitoring both diffuse and point-sources of P. Indeed, over the past decade, there have been major developments in the production of environmental impact models in which, increasingly, the importance of nutrients has been recognised. As new data have come in, however, the complexity of within-catchment processing has become recognised; new modelling approaches need to be based, for example, on fractal processing (Neal, 2004). Presently, intensive data are needed to test and develop the next generation of environmental impact models (Neal, 1997; Feng et al., 2004; Kirchner et al., 2001, 2004). Sampling with a coarse, time-based regime, for example, can underestimate annual fluxes and conceal the dynamics of sub-annual transfers (Kirchner et al., 2004; Heathwaite and Harris, 2005). Kronvang and Iversen (2002) also highlighted the need for automated sample collection to capture diffuse
P transfers adequately during storm events; this would facilitate the correct interpolation of gaps in the data series using least squares regression analysis to estimate annual P fluxes. This technique has been used by Lennox et al. (1997) and Jordan et al. (2001, 2005) Further, high resolution data on P are essential for identifying the potential biological responses to variations in P within the stream (Jarvie et al., 2004).
373 infrastructure (Neal et al., 2004; Jordan et al., 2005).
Scholefield et al. (2005) have shown how these low flow P transfers in rivers can follow a diurnal pattern related to physical and/or biological interactions within the stream network. Jordan et al. (2006) have also demonstrated that diurnal patterns reveal the influence of rural point sources discharging during the day, with recoveries to lower stream P concentrations during the night.
In the current research, a bank-side auto-analyser was used over a six-month period (April to October 2005) to capture the patterns of both acute and chronic P transfers and to characterise transfer event-types in a 5 km2 rural river
sub-catchment situated in the wider Lough Neagh basin (4500 km2) in Northern Ireland. The sub-catchment is
managed for grassland agriculture with scattered single dwelling houses. The hydrology of this region is extremely flashy as runoff is influenced by impermeable soils of glacial origin and sub-soil drains. Like most rivers in Northern Ireland, the main tributaries and larger rivers in the Lough Neagh basin have been channelised and this results in flashy flood runoff and suppressed base flows (Wilcock, 1997). Previous work using traditional weekly grab sampling and automated storm sampling indicated that this region is prone to both low and high flow P transfers (Jordan et al., 2005).
Methods
Total phosphorus transfers were monitored in the catchment stream using a Dr Langer Sigmatax-Phosphax suite of instrumentation that extracts, homogenises, digests and determines TP by colorimetry on stream water samples every 10 mins. The instrumentation was situated in a GRP kiosk at the side of the stream and powered by 240v AC. Other instrumentation included a YSI6600EDS multi-probe sonde measuring specific conductance, a Starflow Doppler flow meter and a 0.2 mm tipping bucket rain gauge. Sample delivery by the Sigmatax homogenisation unit is via positive air pressure to an enclosed stainless steel sampling chamber fixed within the stream water. A 100 ml sample is homogenised by ultra-sound for 3 mins and a 10 ml aliquot delivered to the Phosphax unit. This is digested using the sulphuric acidpersulphate method of Eisenreich et al. (1975) and P is determined photometrically following the automated addition of molybdate antimony and ascorbic acid (DIN EN 38405 D11). Data are downloaded to a Campbell CR10X datalogger and delivered to a desktop database via telemetry. The performance of the Dr Lange instrumentation is reported elsewhere (Jordan et al., 2006); when a daily autocalibration is performed to avoid instrument drift, a constant under-prediction of 7% may be attributed partly to heavier solids not being delivered to the homogenisation
chamber. These under predications can be corrected during post-processing.
Results and discussion
From the period 16 April to 7 October 2005, the TP analyser recorded data for 94% of the time. Data were lost because of lime scale blockages in the fine tubing between the stream and homogenisation chamber. A weekly to fortnightly cleaning regime using dilute bleach ordinarily inhibited this build-up. Samples were monitored in the fieldwith 10 min resolution and post-processing included aggregation to 1hour intervals for comparison with flow and rainfall data (Fig. 1).
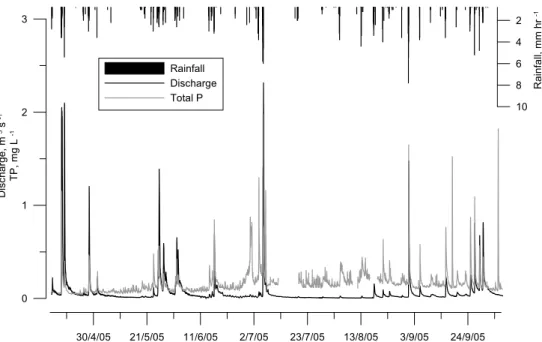
Figure 1 shows the full data series from April to October 2005. The main features of the TP series can be summarised as discrete transfer events and long-term trends. These can be further categorised as event-types.
Type 1. The first event-type is the long-term trend associated with baseflow periods (Fig.1); in spring, as baseflows became suppressed, TP concentrations increased. Except for the intermittent spikes of TP associated with other event types, the rising trend peaked in July and August when baseflows were lowest. This indicates a concentration effect and the influence of one or more point sources in this catchment, which contributes to the chronic eutrophication of the stream network during higher percentile baseflows. These concentrations were highest in summer (~ 0.250 mg L1) and with high water temperatures and light availability,
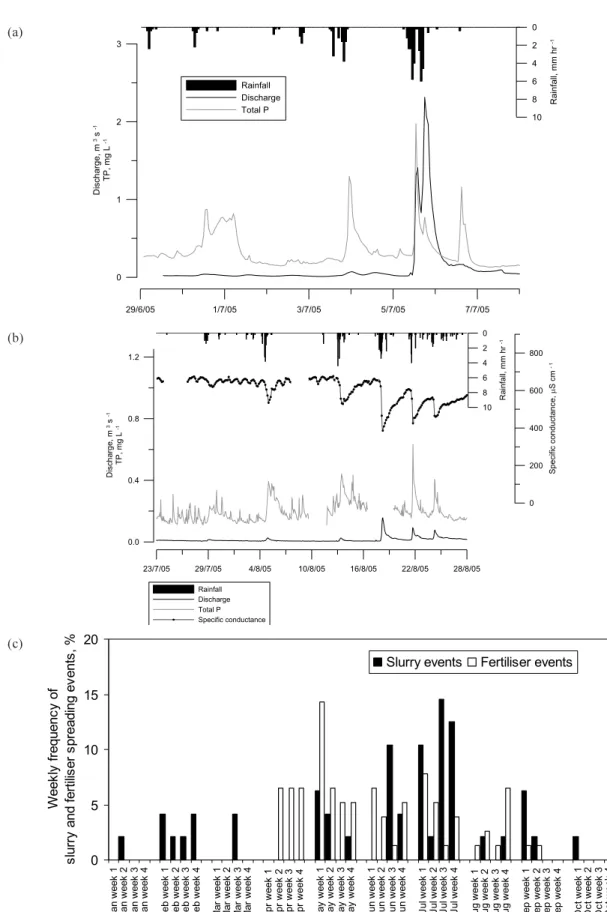
the eutrophic impact would often be considerable. This baseflow period of chronic P transfers shows a susceptibility to rapid increases in TP concentration with small rainfall events (Figs. 2a and 2b.) that do not increase stream discharges to the same extent. In the first week of July, two large TP concentration events occurred; these corresponded to rainfall but there was almost no increase in stream discharge (Fig. 2a). These concentrations rose to over 1 mg L1 from a high background concentration of
approximately 0.25 mg L1. Storm events during 5 and 6
July indicated a TP flushing episode and the last TP concentration spike (~1 mg L1) before 7 July corresponded
to a rainfall event of just 0.2 mm hr1. Similarly, the data for
P. Jordan, A. Arnscheidt, H. McGrogan and S. McCormick
Fig. 1. Six month time series of synchronous rain, discharge and TP data from a 5km2 agricultural catchment in Northern Ireland. Ninety-four
percent of the period was sampled by the bankside continuous TP analyser at a 10min resolution and averaged to hourly values for
comparison. The rising trend of low flow TP concentrations throughout the summer is inversely related to the magnitude of baseflows (event-type 1), indicating the influence of one or more point sources.
slurry (54%) was spread in June and July (54%). The availability of slurry and inorganic fertiliser to small (as well as large) rainfall events during this period is most likely reflected in the TP concentration traces in Fig. 2a and 2b. The small increases in TP concentration during these low magnitude runoff events, albeit over a high background concentration, is an example of transport limited P transfer at the catchment scale (Haygarth et al., 2004). A further pattern of chronic TP transfer at low flow was observed during six- and seven-day periods without rainfall during May and June, respectively. Figures 3a and 3b show a TP concentration time series as box-whisker plots (illustrated as overlays of 24-hour periods). In each case, TP concentration recovers between 00.00 and 10.00 hr each day, followed by a sharp increase that is sustained for the rest of the day. This diurnal pattern could be linked to a combination of physical and/or biological interactions within the stream network (Scholefield et al., 2005) but is more likely to be from one or more rural point sources discharging during the working day (Jordan et al., 2006).This chronic TP transfer event type is inversely related to stream discharge (i.e. concentrations become higher as baseflow decreases through the summer); small rainfall events can raise TP concentrations rapidly above this existing chronic transfer without similar increases in stream discharge (indicating small, episodic flushing possibly related to fertiliser use); this chronic TP transfer also has a diurnal pattern that is evident only during sustained periods of no rainfall.
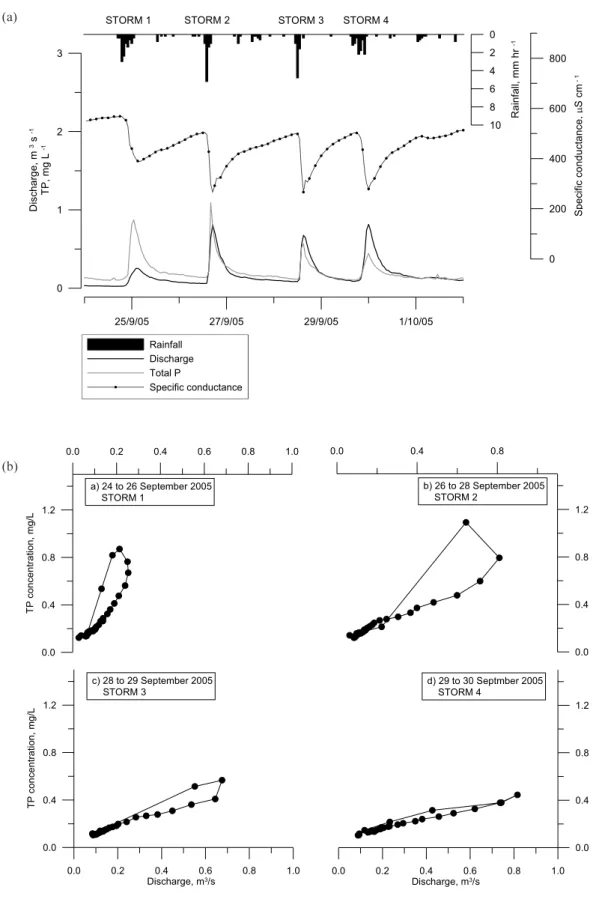
Type 2 .The second TP transfer event-type is positively correlated with storm-events and is normally associated with diffuse runoff from P-saturated agricultural soils (Kurz et al., 2005). TP concentration always increases with storm discharge (Fig. 1). In Fig. 4a, four September storms also show the effects of P depletion from the catchment during progressive storm events. Each storm had a similar diluting effect on stream water that reduced specific conductance by approximately 200µS cm1 from the start of runoff to the
peak. Storm 1 had the highest stream conductance prior to runoff and this translated to less runoff generated at the catchment outlet. The TP concentration was approaching 1 mg L1 during the storm peak. Storms 2, 3 and 4 can,
however, be considered similar in runoff and diluting characteristics. Discharge was approximately the same and specific conductance followed the same depression and recovery. The TP concentration traces, however, vary in two ways. Firstly, the magnitude of the chemograph peaks decrease progressively following each storm event from over 1 mg L1 in storm 2 to less than 0.5 mg L1 during storm 4;
this indicates a depletion of the P source during this storm series. These depletions fit into the supply limited model of P transfer during storm events described by Haygarth et al. (2004). Secondly, during storms 1 and 2, TP concentrations were higher and peaked on the rising limb of the hydrograph indicating a flushing effect that was not matched during storms 3 and 4. Here, and especially during storm 4, the change in TP concentration followed the change
30/4/05 21/5/05 11/6/05 2/7/05 23/7/05 13/8/05 3/9/05 24/9/05
10 8 6 4 2
Rainfall, mm hr
-1
0 1 2 3
Disc
harg
e
, m
3 s
-1
TP, mg
L
-1
375
29/6/05 1/7/05 3/7/05 5/7/05 7/7/05
10 8 6 4 2 0 Rainf a ll, m m hr -1 0 1 2 3 D is c harge, m
3 s
-1 TP, mg L -1 Rainfall Discharge Total P
23/7/05 29/7/05 4/8/05 10/8/05 16/8/05 22/8/05 28/8/05 10 8 6 4 2 0 Rai n fa
ll, mm h
r -1 0.0 0.4 0.8 1.2 Di s c h a rge , m
3 s
-1 TP, m g L -1 Rainfall Discharge Total P Specific conductance 0 200 400 600 800 Sp eci fi c co ndu ct an c e , P S cm - 1 0 5 10 15 20 J an w eek 1 J an w eek 2 J an w eek 3 J an w eek 4 F eb w eek 1 F eb w eek 2 F eb w eek 3 F eb w eek 4 Mar w eek 1 Mar w eek 2 Mar w eek 3 Mar w eek 4 A pr w eek 1 A pr w eek 2 A pr w eek 3 A pr w eek 4 May w eek 1 May w eek 2 May w eek 3 May w eek 4 J un w eek 1 J un w eek 2 J un w eek 3 J un w eek 4 J ul w eek 1 J ul w eek 2 J ul w eek 3 J ul w eek 4 A ug w eek 1 A ug w eek 2 A ug w eek 3 A ug w eek 4 S ep w e ek 1 S ep w e ek 2 S ep w e ek 3 S ep w e ek 4 O c t w eek 1 O c t w eek 2 O c t w eek 3 O c t w eek 4 W eek ly f requenc y of s lur ry and f e rt ilis er s p reading ev ent s , %
Slurry events Fertiliser events
Fig. 2. Sudden TP concentration episodes from light rainfall with no increase in stream discharge during early July 2005 (Fig. 2a). Figure 2b shows a series of noisy TP concentrations during late July 2005 also corresponding to light rainfall but with little variation in stream discharge (i.e., transport limited P transfer). These TP spikes occur in excess of the chronic background concentrations observed in Fig. 1. Figure 2c also shows the frequency of slurry and inorganic fertiliser spreading in the 5 km2 catchment (expressed as a % of the total number
of days) that is most likely responsible for the noisy TP response at low flow during light rainfall.
(a)
(b)
P. Jordan, A. Arnscheidt, H. McGrogan and S. McCormick
2 4 6 8 10 12 14 16 18 20 22
Hour
0.000 0.025 0.050 0.075 0.100 0.125 0.150 0.175
T
P
co
nc
en
tr
at
io
n,
m
g
L
- 1
2 4 6 8 10 12 14 16 18 20 22
Hour
0.000 0.025 0.050 0.075 0.100 0.125 0.150 0.175
T
P
co
nc
en
tr
at
io
n,
m
g
L
- 1
Fig. 3. Box whisker plots showing a series of hourly median, upper and lower quartile, maximum and minimum TP concentrations over sustained periods of zero rainfall in May (Fig. 3a) and June (Fig. 3b) 2005. The data indicate that stream P concentrations appear to recover during the early morning and suddenly increase at approximately 11:00 hr each day. Both plots indicate the influence of point sources during the working day. Water travel times from headwaters to the catchment outlet were approximately 2 to 3 hours at low flows.
(a)
377
Fig. 4. Four contiguous storm events during September 2005 showing hourly averaged measurements of stream discharge, TP concentration and specific conductance (event-type 2; Fig. 4a). Storms 2, 3 and 4 appear similar in magnitude and diluting effect and highlight a P flushing effect that reduces TP peaks during progressive storms (i.e, supply limited P transfer) and also, progressively synchronises the chemograph with the hydrograph. Figure 4b shows a discharge and TP concentration hysteresis effect during the four storm events with flushing features on the rising limbs of earlier hydrographs progressing towards a steady-state in the later storms.
25/9/05 27/9/05 29/9/05 1/10/05
10 8 6 4 2 0
R
a
in
fa
ll,
mm h
r
-1
0 1 2 3
Di
s
c
h
a
rge
, m
3 s
-1
TP,
m
g
L
-1
Rainfall Discharge Total P
Specific conductance
0 200 400 600 800
S
p
ec
if
ic
condu
c
ta
n
ce
,
P
S cm
- 1
STORM 1 STORM 2 STORM 3 STORM 4
0.0 0.2 0.4 0.6 0.8 1.0
0.0 0.4 0.8 1.2
T
P
c
o
n
c
e
ntra
ti
on,
mg/L
a) 24 to 26 September 2005 STORM 1
0.0 0.4 0.8
0.0 0.4 0.8 1.2 b) 26 to 28 September 2005 STORM 2
0.0 0.2 0.4 0.6 0.8 1.0
Discharge, m3/s
0.0 0.4 0.8 1.2 d) 29 to 30 Septmber 2005 STORM 4
0.0 0.2 0.4 0.6 0.8 1.0
Discharge, m3/s
0.0 0.4 0.8 1.2
TP con
c
e
n
trati
o
n
,
mg/L
c) 28 to 29 September 2005 STORM 3
(a)
P. Jordan, A. Arnscheidt, H. McGrogan and S. McCormick
11/9/05 17/9/05 23/9/05 29/9/05 5/10/05
10 8 6 4 2 0
Rain
fal
l, mm
hr
-1
0 1 2 3
Di
s
c
ha
rge
, m
3 s
-1
TP
, m
g
L
-1
Rainfall Discharge Total P
Specific conductance
0 200 400 600 800
Specif
ic conduct
an
c
e
,
P
S cm
- 1
in stream discharge closely on both rising and falling limbs of the hydrograph. This hysteresis effect is illustrated for the four storms in Fig. 4b. Storm 4 is indicative of new water interacting with previously flushed soils and so can be considered as a true diffuse P transfer in comparison with flushing of previously attenuated material at the onset of storm runoff. This event type is storm-dependent and transferred the bulk of the observed TP load during the 6-month period. For example, from a recorded total of 278.9 kg TP (0.56 kg ha1), approximately 255.5 kg (0.51 kg ha1)
was associated with storm runoff. The predominant source is likely to be the agricultural soils in the 5 km2 catchment
although periods of mobilisation and attenuation cause changes in the magnitude of TP concentration (depletion of availability of source) during progressive storms and in the pattern of transfers during rising and falling stages of progressive hydrographs (flushing of previously attenuated material).
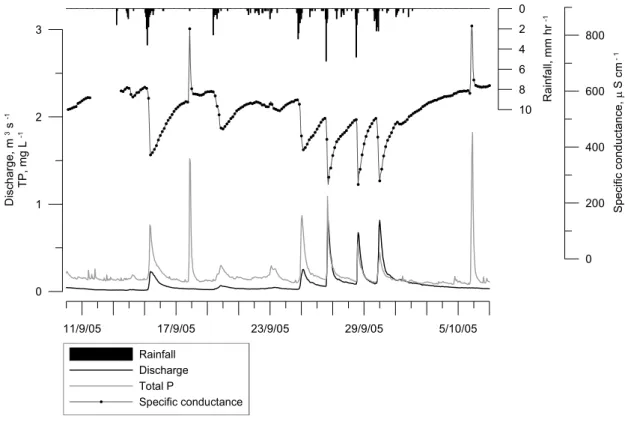
Type 3. The third TP transfer event type observed in the 6-month data series is illustrated in Fig. 5. These events were characterised as discrete, high magnitude TP transfers unrelated to rainfall or changes in stream discharge. Two events prior to midnight on 17 September and 5 October led to concentrations in excess of 1.5 mg L1; unlike
storm-related transfers, these discrete events corresponded to similar sudden increases in stream specific conductance probably caused by single pollution incidents. As these nocturnal pollution events were of short duration (~15 hours), normal day time grab sampling would be unlikely to record their passage beyond the background chronic transfers observed during the working day.
Conclusions
One of the problems associated with the study of P transfers from catchments has been the inability to monitor P concentrations at the same resolution as stream water discharge (Haygarth et al., 2005). The former has mostly been monitored by grab sampling monthly or fortnightly by government agencies and somewhat more intensively (although not continuously) by targeted research efforts using storm-sampling equipment (Stone et al., 2000; Jordan et al., 2001; Prior and Johnes, 2002; Jarvie et al., 2002). Two further problems associated with this concentration and discharge asynchronism are interpolation and interpretation. Stevens and Stewart (1981), Webb et al. (1997) and Kronvang and Iversen (2002) have shown that simple log-linear rating curves between discharge and concentration (or discharge and load) can be used to estimate annual
transfers when the training data set is sufficiently large and
covers all flow percentiles. Sub-annual P variability associated with the dynamics presented in the figures above (diurnal patterns; P depletion and flushing episodes) is lost in this kind of interpolation. This may not be a problem if the objective is to monitor annual fluxes, although monitoring the change in event-types following mitigation of certain sources would not be possible. Even so, great care must be taken because, for some types of catchment, the relationship between TP and SS concentration can be highly non-linear with flow and the highest concentration of even particulate P and SS can occur during summer low flow periods or in response to a differential change in flow rather than flow itself (Jarvie et al., 2002; Neal et al., 2006) (e.g. event-type 3, above).
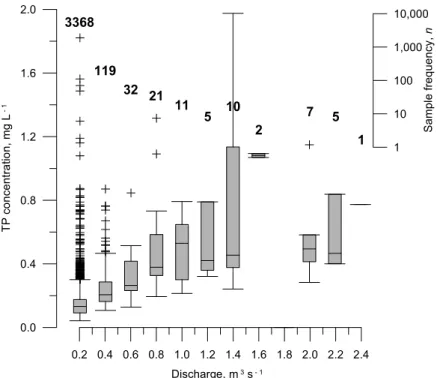
It may also be misleading to interpret sparse and asynchronous discharge and P concentration data with regard to P sources. If applied to this study, it seems reasonable to assume that a normal coarse time integrated sampling regime would largely monitor the effects of chronic P discharges. Although the main bulk of P transfer may be from diffuse, storm-dependent sources in an agricultural catchment with no major point sources, with infrequent monitoring results would be unlikely to be reflected on these assumptions. For example, in this six-month data series, the maximum discharge observed was 2.3 m3 s1 but 95% of
the hourly averages were observed in discharges of less than 0.2 m3 s1 (Fig. 6) and 71% in discharges of less than
0.04 m3s1. In this case, mitigating against the causes of
storm-induced diffuse P transfer (e.g. nutrient management plans (Tilman et al., 2002; McDowell et al., 2001); soil amendments (Callahan et al., 2002); manipulating storm flowpaths (Gburek et al., 2005)) would not necessarily be recorded as an effect at the catchment outlet when using a coarse resolution sampling regime. This has further implications for both managers and catchment stakeholders expecting to see positive improvements in water quality from diffuse transfer mitigation programmes.
In this study, synchronous discharge and concentration data from new technology have provided new insights into catchment P transfer dynamics. Three distinct TP transfer event types were observed during an intensive six-month monitoring period in a grassland agricultural river catchment with no major industrial or municipal point sources. These were:
(1) Chronic, storm-independent transfers that maintained the river in a highly eutrophic state (~0.25 to 0.50 mg L1) during low flows. These were inversely related to
flow during base flow periods and the diurnal pattern noted during periods of zero rainfall was consistent with daily enrichment from one or more rural point sources,
0.0 0.4 0.8 1.2 1.6 2.0
TP c
o
nc
ent
ra
tio
n
, m
g
L
- 1
0.2 0.4 0.6 0.8 1.0 1.2 1.4 1.6 1.8 2.0 2.2 2.4
Discharge, m 3s - 1
3368
119
32 21
11
5 10
2
7 5
1
1 10 100 1,000 10,000
Sample
f
requency
,
n
Fig. 6. Distribution of TP concentrations within 0.2 m3 s-1 discharge ranges. 95% of the data are gathered during discharges of less than 0.2 m3 1
(71% in discharges less than 0.04 m3 s1); even at a fine sampling resolution, it is difficult to monitor the high discharge, event-type 2, diffuse P
P. Jordan, A. Arnscheidt, H. McGrogan and S. McCormick
not obvious in the surrounding catchment but most likely related to individual farmyards and/or septic tanks.
(2) Acute, storm-dependent transfers that delivered the bulk (92%) of the 278.9 kg TP during the monitoring period. These were related positively to flow although with hysteresis effects related to flushing episodes on the rising limbs of hydrographs.
(3) Acute, storm-independent transfers that delivered very high TP concentrations (>1 mg L1) with short duration
chemographs (~15 hours). Concurrent conductivity measurements indicated these transfers to be consequential upon discrete pollution incidents probably from point sources.
Under the Water Framework Directive, it will be expedient, in agricultural catchments, to implement the type of management necessary to reduce diffuse P transfers (event-type 2) and so to reduce the total annual P flux to standing water bodies. It will also be necessary to improve the trophic state of rivers and this will require point source P transfer event-types 1 and 3 to be addressed, even in rural catchments. The new technology used in this study synchronises measurement of both water discharge and contaminants and is likely to be the most rigorous way of monitoring the effectiveness of mitigation measures designed to reduce the effects of both diffuse and point sources of pollution in complex catchments.
Acknowledgements
The authors thank and acknowledge support from NERC (NER/H/S/1999/00164) and SEUPB (INTERREG IIIa 020204) for funding of infrastructure and personnel. Paul Withers, ADAS Catchment Management Group, UK is also thanked for commenting on an earlier draft of this manuscript.
References
Bowes, M.J., House, W.A. and Hodgkinson, R.A., 2003. Phosphorus dynamics along a river continuum. Sci. Total Envir.,
313, 199212.
Callahan, M.P., Kleinman, P.J.A., Sharpley, A.N. and Stout, W.L., 2002. Assessing the efficacy of alternative phosphorus sorbing soil amendments. Soil Sci., 167, 539547.
Eisenreich, S.J., Bannerman, R.T. and Armstrong, D.E., 1975. A simplified phosphorus analysis technique. Environ. Lett., 9, 43
53.
Feng, X., Kirchner, J.W. and Neal, C., 2004. Spectral analysis of chemical time series from longterm catchment monitoring studies: Hydrochemical insights and data requirements. Water
Air Soil Pollut. Focus, 4, 221235.
Gburek, W.J., Barberis, E., Haygarth, P.M., Konvang, B. and Stamm, C., 2005. Phosphorus mobility in the landscape. In:
Phosphorus: agriculture and the environment, J.T. Sims and
A.N. Sharpley, (Eds), Agronomy Monograph no.46, ASA/
CSCA/SSSA, Wisconsin, USA. 911980.
Harris, G. and Heathwaite, A.L., 2005.Inadmissible evidence: knowledge and prediction in land and riverscapes. J. Hydrol.,
304, 319.
Haygarth, P., Turner, B.L., Fraser, A., Jarvis, S., Harrod, T., Nash, D., Halliwell, D., Page, T. and Beven, K., 2004. Temporal variability in phosphorus transfers: classifying concentration-discharge event dynamics. Hydrol. Earth Syst. Sci., 8, 8897.
Haygarth, P.M., Condron, L.M., Heathwaite, A.L., Turner B.L. and Harris G.P., 2005. The phosphorus transfer continuum: Linking source to impact with an interdisciplinary and multi-scaled approach. Sci. Total Envir., 344, 514.
Jarvie, H.P., Neal, C., Williams, R.J., Neal, M., Wickham, H., Hill, L.K., Wade, A.J., Warwick, A. and White, J., 2002. Phosphorus sources, speciation and dynamics in a lowland eutrophic Chalk river; the River Kennet, UK. Sci. Total Envir.,
282/283, 175203.
Jarvie, H., Neal, C. and Williams, R.J., 2004. Assessing changes in phosphorous concentrations in relation to in-stream plant ecology in lowland permeable catchments: Bringing ecosystem functioning into water quality monitoring. Water Air Soil Pollut.
Focus, 4, 641655.
Jordan, P., Rippey, B. and Anderson, N.J., 2001. Modelling diffuse phosphorus loads from land to freshwater using the sedimentary record. Environ. Sci.Technol., 35, 815819.
Jordan, P., Menary, W., Daly, K., Kiely, G., Morgan, G., Byrne, P. and Moles, R., 2005. Patterns and processes of phosphorus transfer from Irish grassland soils to rivers -integration of laboratory and catchment studies.J. Hydrol., 304, 2034.
Jordan, P., Arnscheidt, J., McGrogan H. and McCormick, S., 2006. High resolution phosphorus transfers at the catchment scale; the hidden importance of non-storm transfers. Hydrol. Earth Syst. Sci., in press.
Kirchner, J.W., Feng, X. and Neal, C., 2001. Catchment-scale advection and dispersion as a mechanism for fractal scaling in stream tracer concentrations. J. Hydrol., 254, 81100.
Kirchner, J.W., Xiahong, F., Neal, C. and Robson, A.J., 2004. The fine structure of water-quality dynamics: the (high-frequency) wave of the future. Hydrol. Process., 18, 13531359.
Kronvang, B. and Iverson, H.L., 2002. Danish experience on sampling strategy and estimation method when calculating phosphorus transport in streams. In: Diffuse phosphorus losses
at the catchment scale, B. Kronvang (Ed.), COST Action 832
-Quantifying the agricultural contribution to eutrophication, ALTERRA, Wageningen, The Netherlands. 2126.
Kurz, I., Coxon, C., Tunney, H. and Ryan, D., 2005. Effects of grassland management practices and environmental conditions on nutrient concentrations in overland flow. J. Hydrol. 304, 35
50.
Lennox, S.D., Foy, R.H., Smith, R.V. and Jordan, C., 1997. Estimating the contribution from agriculture to the phosphorus load in surface water. In: Phosphorus Loss from Soil to Water, H. Tunney, O.T. Carton, P.C. Bookes and A.E. Johnston, (Eds.), CAB International, Wallingford, UK. 5575.
McDowell, R.W. and Sharpley, A.N., 2001. A comparison of fluvial sediment P chemistry in relation to location and potential to influence stream P concentrations. Aquatic Geochem.,7, 255
265.
Neal, C., 2004. The water quality functioning of the upper River
Severn, Plynlimon, mid-Wales: issues of monitoring, process understanding and forestry. Hydrol. Earth Syst. Sci., 8, 521
532.
Neal, C., Jarvie, H.P., Wade, A.J., Neal, M., Wyatt, R., Wickham, H., Hill, L. and Hewitt, N., 2004. The water quality of the LOCAR Pang and Lambourn catchments. Hydrol.Earth Syst. Sci., 8, 614635.
Neal, C., Neal, M., Leeks, G.J.L., Old, G., Hill, L. and Wickham, H., 2006. Suspended sediment and particulate phosphorus in surface waters of the upper Thames Basin, UK. J. Hydrol., in press.
Prior, H. and Johnes, P.J., 2002. Regulation of surface water quality in a Cretaceous Chalk catchment, UK: an assessment of the relative importance of instream and wetland processes. Sci. Total
Envir., 282/283, 159174.
Scholefield, D., Le Goff, T., Baven, J., Ebdon, L., Long, T. and Butler, T., 2005 Concerted diurnal patterns in riverine nutrient concentrations and physical conditions. Sci. Total Envir., 344,
201210.
Stevens, R.J. and Stewart, D.A., 1981. The effect of sampling interval and method of calculation on the accuracy of estimated phosphorus and nitrogen loads in drainage water from two different-sized catchment areas. Record Agr. Res.,29, 2938.
Northern Ireland Department of Agriculture, UK.
Stone, K.C., Hunt, P.G., Novak, J.M., Johnson, M.H. and Watts, D.W., 2002. Flow-proportional, time-composited, and grab sample estimation of nitrogen export from an eastern coastal plain watershed. Trans. ASAE, 43, 281290.
Tilman, D., Cassman, K.G., Matson, P.A., Naylor, R. and Polasky, S., 2002. Agricultural sustainability and intensive production practices. Nature, 418, 671677.
Webb, B.W., Phillips, J.M., Walling, D.E., Littlewood, I.G., Watts, C.D. and Leeks, G.J.L., 1997. Load estimation methodologies for British rivers and their relevance to the LOIS RACS(R) programme. Sci. Total Envir., 194/195, 379389.
Wilcock, D.N., 1997. Rivers, drainage basins and soils. In: Soil
and Environment: Northern Ireland, J.G. Cruickshank, (Ed.),