Gene Expression Profiling in Peripheral Blood
Cells and Synovial Membranes of Patients
with Psoriatic Arthritis
Marzia Dolcino
1☯, Andrea Ottria
3☯, Alessandro Barbieri
2, Giuseppe Patuzzo
2,
Elisa Tinazzi
2, Giuseppe Argentino
2, Ruggero Beri
2, Claudio Lunardi
2‡,
Antonio Puccetti
1,3‡*
1Institute G. Gaslini, Genova, Italy,2University of Verona, Verona, Italy,3University of Genova, Genova, Italy
☯These authors contributed equally to this work. ‡CL and AP also contributed equally to this work. *[email protected]
Abstract
Background
Psoriatic arthritis (PsA) is an inflammatory arthritis whose pathogenesis is poorly
under-stood; it is characterized by bone erosions and new bone formation. The diagnosis of PsA is
mainly clinical and diagnostic biomarkers are not yet available. The aim of this work was to
clarify some aspects of the disease pathogenesis and to identify specific gene signatures in
paired peripheral blood cells (PBC) and synovial biopsies of patients with PsA. Moreover,
we tried to identify biomarkers that can be used in clinical practice.
Methods
PBC and synovial biopsies of 10 patients with PsA were used to study gene expression
using Affymetrix arrays. The expression values were validated by Q-PCR, FACS analysis
and by the detection of soluble mediators.
Results
Synovial biopsies of patients showed a modulation of approximately 200 genes when
com-pared to the biopsies of healthy donors. Among the differentially expressed genes we
observed the upregulation of Th17 related genes and of type I interferon (IFN) inducible
genes. FACS analysis confirmed the Th17 polarization. Moreover, the synovial trascriptome
shows gene clusters (bone remodeling, angiogenesis and inflammation) involved in the
pathogenesis of PsA. Interestingly 90 genes are modulated in both compartments (PBC
and synovium) suggesting that signature pathways in PBC mirror those of the inflamed
synovium. Finally the osteoactivin gene was upregulared in both PBC and synovial biopsies
and this finding was confirmed by the detection of high levels of osteoactivin in PsA sera but
not in other inflammatory arthritides.
OPEN ACCESS
Citation:Dolcino M, Ottria A, Barbieri A, Patuzzo G, Tinazzi E, Argentino G, et al. (2015) Gene Expression Profiling in Peripheral Blood Cells and Synovial Membranes of Patients with Psoriatic Arthritis. PLoS ONE 10(6): e0128262. doi:10.1371/ journal.pone.0128262
Academic Editor:Peter Szodoray, Institute of Immunology, Rikshospitalet, NORWAY
Received:September 23, 2014
Accepted:April 24, 2015
Published:June 18, 2015
Copyright:© 2015 Dolcino et al. This is an open access article distributed under the terms of the Creative Commons Attribution License, which permits unrestricted use, distribution, and reproduction in any medium, provided the original author and source are credited.
Data Availability Statement:All the relevant data are within the paper and its Supporting Information files.
Funding:The authors have no support or funding to report.
Conclusions
We describe the first analysis of the trancriptome in paired synovial tissue and PBC of
patients with PsA. This study strengthens the hypothesis that PsA is of autoimmune origin
since the coactivity of IFN and Th17 pathways is typical of autoimmunity. Finally these
find-ings have allowed the identification of a possible disease biomarker, osteoactivin, easily
detectable in PsA serum.
Introduction
Psoriatic arthritis (PsA) is primarily characterised by enthesitis and by synovitis, leading to
bone erosions and new bone formation [
1
]; 10% to 30% of patients with skin psoriasis are
affected by the disease, with an estimated prevalence of 1%.
Genetic studies indicate that PsA has a heritable component [
2
] and many genes have been
implicated in psoriasis and PsA [
3
]. However only a few genes have been associated to both
psoriasis and PsA [
4
].
PsA is characterized by different clinical phenotypes: oligoarticular or polyarticular
asym-metrical peripheral joint inflammation or axial involvement. In the last few years several
crite-ria have been used for the classification of PsA. The most frequently classification critecrite-ria used
are those proposed by Moll and Wright [
5
] and more recently, are the classification criteria for
PsA (CASPAR) [
6
]. The diagnosis of PsA is mainly performed on a clinical basis and after the
exclusion of other seronegative arthritides and up to now there are no diagnostic tests available.
Diagnostic work up is based on medical history, physical examination, blood tests, and imaging
of the joints. Plain radiographs are used to evaluate the joint damage. Magnetic resonance
imaging (MRI) is able to detect joint damage earlier and to assess the extent of joint
involve-ment more accurately than plain radiographs. Indeed MRI is able both to quantify the extent of
the inflammatory process within the affected joints and to detect enthesitis even in apparently
unaffected joints and in the absence of clinical symptoms. Enthesitis is considered the primary
event in the pathogenesis of the disease [
7
]. Moreover MRI and scintigraphy can be used for an
early detection of sacroiliitis and axial disease. In addition these imaging techniques are widely
used to evaluate the efficacy of novel therapies for PsA [
8
,
9
].
In psoriatic skin lesions the typical cell infiltrate contains activated keratinocytes, T and B
lymphocytes, macrophages and neutrophils. Both CD4 and CD8 T cells have been associated
with skin and joint damage [
10
,
11
] typical of PsA.
The synovial tissue in PsA is characterized by an abundant T cell infiltrate, marked
angio-genesis, and synovial hyperplasia with increased expression and/or secretion of cytokines and
proteases that contribute to amplify the local inflammation and may explain the
“
erosive
behavior
”
of the synovium leading to joint destruction.
The cytokine tumor necrosis factor-alpha (TNF-alpha) is a very important inflammatory
mediator and has been implicated in PsA pathogenesis. TNF-alpha inhibitors are widely used
in PsA therapy and are usually quite effective in reducing the extent of skin lesions and of
mus-culoskeletal symptoms, however a high percentage of PsA patients does not respond to
TNFal-pha antagonists. Considering the expense and side effects of anti-TNF biological agents, the
identification of biomarkers that could be used to predict which patients will respond to
biolog-ical treatment is an important goal in medicine.
remission and the majority of PsA patients experience a flare of the disease within the first 2
years [
12
]. Therefore, the identification of new molecules that play a pivotal role in the
patho-genesis of the disease is fundamental for the development of new therapies. Moreover
prognos-tic and diagnosprognos-tic biomarkers need to be identified. To this aim, gene expression profiling may
be of great help since it has been used to classify lymphoid malignancies [
13
] and to dissect
pathways involved in several autoimmune and inflammatory diseases. In this regard gene array
studies have generated useful insight in several diseases including systemic lupus
erythemato-sus (SLE) [
14
], rheumatoid arthritis (RA) [
15
], and multiple sclerosis (MS) [
16
]
Gene expression studies in PBMC of subjects with rheumatoid arthritis (RA) and systemic
lupus erythematosus (SLE) have allowed the identification of specific gene 'signatures' that are
differentially expressed in patients when compared to healthy subjects [
14
,
15
]. In a few cases
differentially expressed genes (DEGs) have been shown to correlate with particular features of
the disease (such as presence or absence of systemic organ involvement in RA), or with
capac-ity to respond to immunosuppressive treatment.
In this study we used a gene array strategy to identify transcriptional profiles that
distin-guish PsA patients from healthy control subjects. For this purpose we analyzed for the first
time gene expression in paired peripheral blood cells (PBC) and synovial biopsies of 10 PsA
patients. We reasoned that the combined analysis of transcription data obtained in PBC and in
the target tissue of PsA, the synovial membrane, could provide a deeper understanding of the
genetic pathways that regulate the disease.
Using this approach we have been able to shed light on some aspects of disease pathogenesis
by dissecting different aspects of this complex pathology. Interestingly DEGs recapitulate most
of the typical features of PsA, such as bone remodeling with new bone formation, synovial
hyperplastic growth with neoangiogenesis, local and systemic inflammatory response,
activa-tion of innate and adaptive immune reponses.
Moreover our results provide evidence for an autoimmune origin of PsA, since gene
expres-sion profiles are characterized by the combined overexpresexpres-sion of type I IFN inducible genes
[
17
] and of Th17 related transcripts. Indeed coactivity of IFN and Th17 pathways is typical of
autoimmunity and has been described both in human diseases and in animal models [
18
–
20
].
Moreover, using the same strategy, we could identify a novel biomarker, osteoactivin, that
can be easily detected in PsA sera. Indeed increased serum levels of osteoactivin, seem to be
typical of PsA and, in the absence of other disease markers, the detection of high levels of this
molecule may represent an interesting tool in the diagnostic work up of PsA.
Patients and Methods
Patients
We studied a cohort of 60 patients (38 males and 22 females, mean age: 44 years) affected by
PsA, attending the Unit of Autoimmune Diseases, at the University Hospital of Verona, Italy.
The patients enrolled in the study were selected as already described elsewhere [
21
]. All
patients fulfilled the CASPAR criteria for the diagnosis of PsA: inflammatory musculoskeletal
involvement (inflammatory arthritis, enthesitis or lumbar pain) combined with at least 3
fea-tures: 1) evidence of current psoriasis, personal history of psoriasis, family history of psoriasis
in unaffected patiens; 2) affected nails (onycholysis, pitting); 3) dactylitis; 4) negative
rheuma-toid factor; 5) radiographic evidence of new juxta-articular bone formation (excluding
osteo-phytes) [
22
].
indirect immunofluorescence on HEp-2 cells; and genetic screening for the association with
the allele HLA-B27. All patients underwent the following instrumental investigations:
ultraso-nography with Power Doppler to investigate subclinical enthesopaty and synovitis in
asymp-tomatic patients; conventional radiography, magnetic resonance imaging (MRI) and
scintigraphy. The radiological features of peripheral PsA included asymmetric distribution,
participation of distal interphalangeal joints, periostitis, bone density preservation, bone
anky-losis and pencil-in-cup deformity.
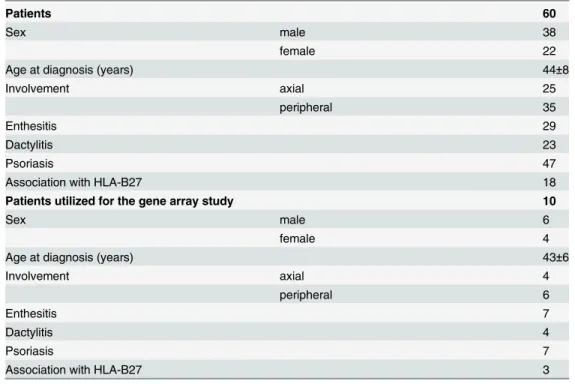
A group of 10 subjects with recent onset PsA (within one year from the diagnosis) was
selected within the entire cohort of PsA patients and utilized for the gene array study. These
patients were not treated with anti-TNF agents or with disease-modifying antirheumatic drugs
(DMARDs). The clinical features of the patients are reported in
Table 1
that also includes a
description of the PsA patients selected for the gene array study. Sixty control subjects matched
for sex and age served as control group. Moreover 60 patients with rheumatoid arthritis (RA),
60 patients with Ankylosing spondylitis (AS) and 20 patients with osteoarthritis (OA) were
used as controls. RA patients had the American College of Rheumatology classification criteria
for RA [
23
]. In all RA patients the disease was at an active stage and blood was obtained before
therapy with biological agents. AS patients met the SAS classification criteria for AS [
24
].
All the participants to the study signed a written informed consent. The local Ethical
Com-mittee of the Azienda Ospedaliera Universitaria of Verona, Verona, Italy had approved the
study protocol. All the investigations have been performed according to the principles
con-tained in the Helsinki declaration.
Synovial biopsies
In the 10 PsA patients selected for the gene array study synovial membranes were obtained
with needle biopsies.
Table 1. Clinical features of the patients with PsA included in the study.
Patients 60
Sex male 38
female 22
Age at diagnosis (years) 44±8
Involvement axial 25
peripheral 35
Enthesitis 29
Dactylitis 23
Psoriasis 47
Association with HLA-B27 18
Patients utilized for the gene array study 10
Sex male 6
female 4
Age at diagnosis (years) 43±6
Involvement axial 4
peripheral 6
Enthesitis 7
Dactylitis 4
Psoriasis 7
Association with HLA-B27 3
In 10 control healthy donors synovial biopsies were collected during orthopedic knee
arthroscopy following traumatic events.
Gene array
Tissue samples from every single patient were frozen in liquid nitrogen immediately after
dis-section and stored at -70°C until homogenization. Sample preparation for gene array analysis
was carried out as previously described [
25
–
27
]. Briefly, frozen samples were homogenized in
TRI REAGENT (1mL per 50
–
100mg of tissue) in a Potter-type mechanical homogenizer with
Teflon pestle.
PAXgene Blood RNA tubes (PreAnalytiX, Hombrechtikon, Switzerland) were used for blood
collection and total RNA was extracted according to the protocol supplied by the manufacturer.
Preparation of cRNA hybridization and scanning of arrays for each samples were performed
following the manufacturer instructions (Affymetrix, Santa Clara, CA, USA) by Cogentech
Affymetrix microarray unit (Campus IFOM IEO, Milan, Italy) using the Human Genome
U133A 2.0 Gene Chip (Affymetrix). The Human Genome U133A Gene Chip is a single array
which contains 14,500 well-characterized human genes and more than 22,000 probe sets and
500,000 distinct oligonucleotide features. The gene expression profiles were analyzed using the
Gene Spring software, version 12.1 (Agilent Technologies, SantaClara, CA, USA) that
calcu-lated a robust multi-array average of background-adjusted, normalized, and log-transformed
intensity values applying the Robust Multi-Array Average algorithm (RMA).
With this software the mean optical background level for each array was subtracted from
the signal intensity for each probe. The normalized data were transformed to the log2 scale. A
signal log2 ratio of 1.0 corresponds to an increase of the transcript level by two-fold change (2
FC) and -1.0 indicates a decrease by two-fold change (-2 FC). A signal log2 ratio of zero would
indicate no change. The unpaired t-test was performed to determine which genes were
modu-lated at a significant level (p
0.01) and p values were corrected for multiple testing by using
Bonferroni correction. Finally, statistically significant genes were chosen for final consideration
when their expression was at least 2.0 fold different in the test sample versus control sample.
Genes that passed both the p-value and the FC restriction were submitted to functional
classifi-cation analysis according to the Gene Ontology (GO) annotations.
The microarray results have been reported according to the MIAME guidelines and
depos-ited in the public repository ArrayExpress
http://www.ebi.ac.uk/arrayexpress
; accession
num-ber E-MTAB-3201.
FACS analysis
Peripheral blood mononuclear cells (PBMCs) were obtained from 20 healthy donors and 30
patients affected by PsA following a density-gradient centrifugation on Lymphoprep
(Nycomed Pharma, Oslo, NO) and two washes with PBS.
Cells collected from patients and normal controls were cultured in 2 mL tubes containing 1
mL of RPMI 1640 + FCS 10% (Lonza, Basel, CH) at a concentration of 1
10
6cells/mL. Cells
were stimulated for 4 hours with Dynabeads Human T-Activator CD3/CD28 (Life
Technolo-gies, Carlsbad, CA, USA) or with heat-inactivated
Candida albicans. IL-17 production was
assessed using the IL-17 Secretion Assay (Miltenyi Biotec, Bergish Gladbach, D) according to
the manufacturer
’
s instruction. Briefly, cells were washed in 2 mL of cold buffer, centrifuged at
300xg for 5 minutes at 4°C and the pellet resuspended in 90
μ
L of cold medium. An incubation
IL-17 Detection Antibody APC, 10
μ
L of anti-CD3 PerCP (Becton Dickinson, Franklin Lakes,
NJ, USA) and 5
μ
L of anti-CD4 APC-H7 (Becton Dickinson) antibodies were added.
Incuba-tion was performed in ice for 10 minutes. Finally cells were washed and resuspended in an
appropriate volume of PBS and acquired on a FACSCanto II cytometer (Becton Dickinson).
Analysis was performed with FlowJo 9.3.3 software (Tree Star, Ashland, OR, USA).
Real Time RT-PCR
Total RNA was isolated from PBMC using TRIzol reagent (Invitrogen, Carlsbad, CA, USA),
following manufacturer
’
s instructions. First-strand cDNA was generated using the
Super-Script III First-Strand Synthesis System for RT-PCR Kit (Invitrogen), with random
hexam-ers, according to the manufacturer
’
s protocol. PCR was performed in a total volume of 25
μ
l
containing 1× Taqman Universal PCR Master mix, no AmpErase UNG and 2.5
μ
l of cDNA;
pre-designed, Gene-specific primers and probe sets for each gene (SPP1: Hs 00959010_m1;
CXCL13: Hs 00757930_m1; CCL18 Hs 00268113_m1; LAMP3: Hs 00180880_m1; CADM1:
Hs 00942509_m1) were obtained from Assay-on-Demande Gene Expression Products
(Applied Biosystems).
As described in details previously [
25
–
27
], Real Time PCR reactions were carried out in a
two-tube system and in singleplex. The Real Time amplifications included 10 minutes at 95°C
(AmpliTaq Gold activation), followed by 40 cycles at 95°C for 15 seconds and at 60°C for one
minute. Thermocycling and signal detection were performed with 7500 Sequence Detector
(Applied Biosystems). Signals were detected according to the manufacturer
’
s instructions. This
technique allows the identification of the cycling point where PCR product is detectable by
means of fluorescence emission (Threshold cycle or Ct value). As previously reported, the Ct
value correlates to the quantity of target mRNA [
26
]. Relative expression levels were calculated
for each sample after normalization against the housekeeping genes GAPDH, beta-actin and
18s ribosomal RNA (rRNA), using the
ΔΔ
Ct method for comparing relative fold expression
differences [
25
,
28
]. The data are expressed as fold change. Ct values for each reaction were
determined using TaqMan SDS analysis software. For each amount of RNA tested triplicate Ct
values were averaged. Because Ct values vary linearly with the logarithm of the amount of
RNA, this average represents a geometric mean.
Detection of soluble mediators in sera and synovial fluids
Serum levels of osteoactivin/GPNMB [
29
] were detected using a commercially available ELISA
kit (Biorbyt Ltd, Cambridge, UK). The ELISA kits for osteopontin, CCL20, CCL18, MMP-3
and IL-23 were all purchased from R & D Systems (Phoenix, AZ, USA) and used according to
the manufacturer
’
s instructions. IL-17 and IL-23 were detected in synovial fluids (SFs) of 20
patients with PsA and in 20 patients with OA, used as controls. The ELISA kit for IL-17 was
purchased from eBioscience (San Diego, CA, USA) and used according to the manufacturer
’
s
instruction.
SF was distributed into heparinized tubes, and the cells removed by centrifugation (400 ×
g,
10 min). Before each test. synovial fluids were treated with hyaluronidase at a concentration of
10 U/ml for 80 min at 37°C followed by centrifugation (12,000 ×
g, 5 min). This treatment was
used to reduce the viscosity of synovial fluid.
Statistical Analysis
PBMCs and of IL-17 and IL-23 synovial fluid levels, the significance of the differences between
patients and controls was determined using the unpaired Student
’
s t-test.
Results
Gene-array analysis
a) DEGs in synovial biopsies.
In order to identify genes potentially involved in the
patho-genesis of PsA, we first compared the gene expression profiles of 10 synovial biopsies obtained
from patients with PsA with synovial specimens obtained from normal healthy subjects
under-going post-traumatic surgery.
When both a Bonferroni
–
corrected
P-value criterion (p
0.01) and a fold change criterion
(FC
2) were applied to the signal variation of every single gene to detect robust and
statisti-cally significant changes between baseline and experimental arrays [
25
,
27
], we obtained 196
modulated genes that were further analyzed. 135 and 61 transcripts resulted to be up- and
downregulated respectively; in many cases the fold changes were very high. In particular three
genes showed a very high level of induction: osteopontin, SPP1/OPN (FC 450), fibronectin 1,
FN1 (FC 405) and osteoactivin, GPNMB (FC 147).
Fig 1
shows the heat map representing some Affymetrix arrays with a selection of
modu-lated genes.
The Gene Ontology analysis of the regulated transcripts showed that the vast majority of
them are involved in several biological processes that may play a role in PsA including:
inflam-mation, immune response, apoptosis, cell cycle regulation and proliferation, cell migration and
invasion, extra-cellular matrix (ECM) and ECM remodeling, bone remodeling, angiogenesis,
signal transduction.
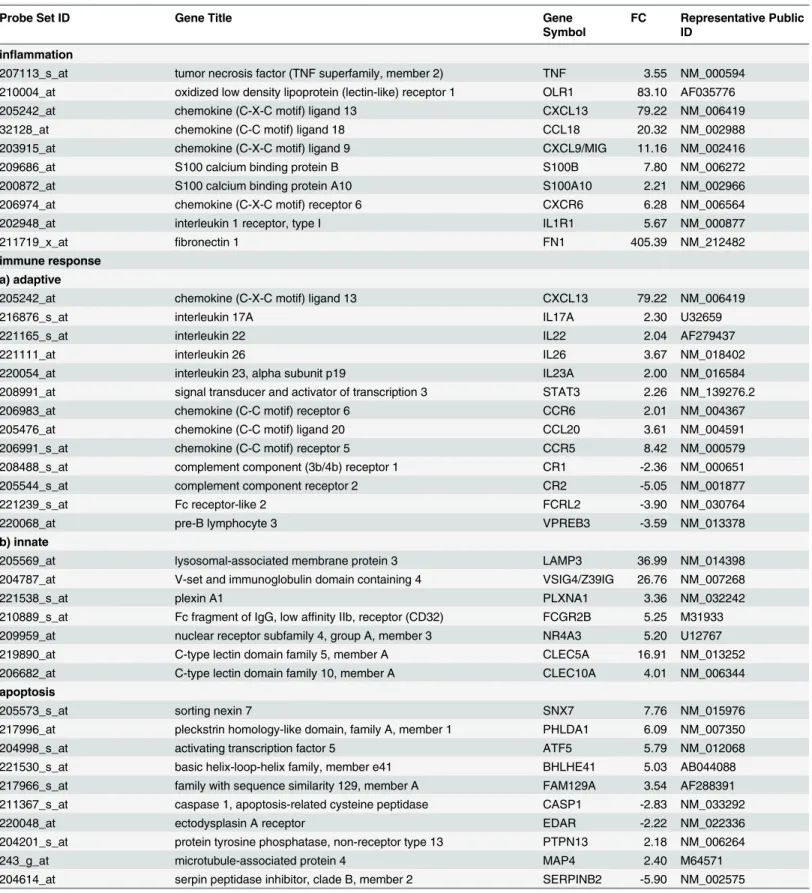
Table 2
shows a detailed representation of selected genes within the above-mentioned
clus-ters. The table also includes GeneBank accession numbers and fold changes. The complete list
of modulated genes can be found in
S1 Table
.
A large number (29/196) of modulated genes have a role in the inflammatory process.
The upregulated transcripts comprise chemokine (C-X-C motif) ligand 13, CXCL13 (FC
79.22), CXCL9/MIG (FC 11.16), chemokine (C-C motif) ligand 18, CCL18 (FC 20.32),
interleu-kin 1 receptor, type I, IL1R1 [
30
,
31
] (FC 5.67), oxidized low density lipoprotein receptor 1,
OLR1/LOX1 (FC 83.1), S100 calcium binding protein namely S100B [
32
] (FC 7.8) and S100A102
[
33
] (FC 2.21), fibronectin1, FN1 [
34
] (FC 405.4), tumour necrosis factor alpha TNF (FC 3.5).
Among genes involved in the immune response, many Th17-lymphocytes related genes
were up-regulated including CCR6 (FC 2.01), CCL20 (FC 3.6), CXCL13 (FC 79.2) [
35
]
inter-leukin 17A, IL17A [
36
] (FC 2.3), IL22 [
37
] (FC 2.04), IL26 [
38
] (FC 3.67); IL23A [
39
] (FC 2.2)
and signal transducer and activator of transcription 3, STAT3 (FC 2.26) [
40
].
Other genes involved in B cell activity are downregulated in PsA samples [
40
,
41
].
Several upregulated genes play a role in innate immunity and are expressed in dendritic
cells [
42
–
45
] and in macrophages [
46
].
Many genes coding for protein involved in apoptosis and/or in apoptosis regulation resulted
modulated in pathological samples [
47
–
54
].
Genes that positively regulate cell cycle resulted overexpressed in PsA synovial samples [
55
–
57
]. Moreover there was a strong downregulation of the guanine nucleotide binding protein,
gamma 11, GNG11 (FC -42.3), an inducer of cellular senescence in human cells [
58
]. Genes
that control cell proliferation were also modulated in PsA biopsies even with very high fold
change [
59
–
66
].
Fig 1. Gene expression profiles of synovial membranes obtained from 10 PsA patients and from 10 healthy subjects.The heat map shows the expression levels of all the modulated genes. Blue-violet indicates genes that are expressed in synovial biopsies of PsA patients at lower levels when compared with the mean values of the control subjects, orange-red indicates genes that are expressed at higher levels when compared to the control means and yellow indicates genes that are not differently expressed in the patients group versus the control group. Each row represents a gene; each column shows the expression of selected genes in each individual (seeS1 Tablefor complete list of genes expression data). On both sides of the heat map a selection of genes is shown. Green and red squares indicate upregulated and downregulated genes respectively.
Table 2. Annotated genes differentially expressed in PsA synovial membranes versus healthy synovial membranes grouped according to their function.
Probe Set ID Gene Title Gene
Symbol
FC Representative Public ID
inflammation
207113_s_at tumor necrosis factor (TNF superfamily, member 2) TNF 3.55 NM_000594
210004_at oxidized low density lipoprotein (lectin-like) receptor 1 OLR1 83.10 AF035776
205242_at chemokine (C-X-C motif) ligand 13 CXCL13 79.22 NM_006419
32128_at chemokine (C-C motif) ligand 18 CCL18 20.32 NM_002988
203915_at chemokine (C-X-C motif) ligand 9 CXCL9/MIG 11.16 NM_002416
209686_at S100 calcium binding protein B S100B 7.80 NM_006272
200872_at S100 calcium binding protein A10 S100A10 2.21 NM_002966
206974_at chemokine (C-X-C motif) receptor 6 CXCR6 6.28 NM_006564
202948_at interleukin 1 receptor, type I IL1R1 5.67 NM_000877
211719_x_at fibronectin 1 FN1 405.39 NM_212482
immune response a) adaptive
205242_at chemokine (C-X-C motif) ligand 13 CXCL13 79.22 NM_006419
216876_s_at interleukin 17A IL17A 2.30 U32659
221165_s_at interleukin 22 IL22 2.04 AF279437
221111_at interleukin 26 IL26 3.67 NM_018402
220054_at interleukin 23, alpha subunit p19 IL23A 2.00 NM_016584
208991_at signal transducer and activator of transcription 3 STAT3 2.26 NM_139276.2
206983_at chemokine (C-C motif) receptor 6 CCR6 2.01 NM_004367
205476_at chemokine (C-C motif) ligand 20 CCL20 3.61 NM_004591
206991_s_at chemokine (C-C motif) receptor 5 CCR5 8.42 NM_000579
208488_s_at complement component (3b/4b) receptor 1 CR1 -2.36 NM_000651
205544_s_at complement component receptor 2 CR2 -5.05 NM_001877
221239_s_at Fc receptor-like 2 FCRL2 -3.90 NM_030764
220068_at pre-B lymphocyte 3 VPREB3 -3.59 NM_013378
b) innate
205569_at lysosomal-associated membrane protein 3 LAMP3 36.99 NM_014398
204787_at V-set and immunoglobulin domain containing 4 VSIG4/Z39IG 26.76 NM_007268
221538_s_at plexin A1 PLXNA1 3.36 NM_032242
210889_s_at Fc fragment of IgG, low affinity IIb, receptor (CD32) FCGR2B 5.25 M31933
209959_at nuclear receptor subfamily 4, group A, member 3 NR4A3 5.20 U12767
219890_at C-type lectin domain family 5, member A CLEC5A 16.91 NM_013252
206682_at C-type lectin domain family 10, member A CLEC10A 4.01 NM_006344
apoptosis
205573_s_at sorting nexin 7 SNX7 7.76 NM_015976
217996_at pleckstrin homology-like domain, family A, member 1 PHLDA1 6.09 NM_007350
204998_s_at activating transcription factor 5 ATF5 5.79 NM_012068
221530_s_at basic helix-loop-helix family, member e41 BHLHE41 5.03 AB044088
217966_s_at family with sequence similarity 129, member A FAM129A 3.54 AF288391
211367_s_at caspase 1, apoptosis-related cysteine peptidase CASP1 -2.83 NM_033292
220048_at ectodysplasin A receptor EDAR -2.22 NM_022336
204201_s_at protein tyrosine phosphatase, non-receptor type 13 PTPN13 2.18 NM_006264
243_g_at microtubule-associated protein 4 MAP4 2.40 M64571
204614_at serpin peptidase inhibitor, clade B, member 2 SERPINB2 -5.90 NM_002575
Table 2. (Continued)
Probe Set ID Gene Title Gene
Symbol
FC Representative Public ID
cell cycle regulation
208712_at cyclin D1 CCND1 9.94 NM_053056.2
220658_s_at aryl hydrocarbon receptor nuclear translocator-like 2 ARNTL2 4.03 NM_020183
204115_at guanine nucleotide binding protein (G protein), gamma 11 GNG11 -42.28 NM_004126
204032_at breast cancer anti-estrogen resistance 3 BCAR3 3.94 NM_003567
cell proliferation
213348_at cyclin-dependent kinase inhibitor 1C (p57, Kip2) CDKN1C -17.49 NM_001122631
201830_s_at neuroepithelial cell transforming 1 NET1 4.27 NM_005863
209815_at patched homolog 1 (Drosophila) PTCH1 -7.22 NM_000264
202177_at growth arrest-specific 6 GAS6 4.12 NM_000820
205081_at cysteine-rich protein 1 CRIP1 3.11 NM_001311
219787_s_at epithelial cell transforming sequence 2 oncogene ECT2 3.04 NM_018098
201324_at epithelial membrane protein 1 EMP1 45.31 NM_001423
209481_at SNF related kinase SNRK -2.15 AF226044
202286_s_at tumor-associated calcium signal transducer 2 TACSTD2 56.82 NM_002353
cell migration and/or invasion
202345_s_at fatty acid binding protein 5 (psoriasis-associated) FABP5 12.73 NM_001444
218451_at CUB domain containing protein 1 CDCP1 3.61 NM_022842
203349_s_at ets variant 5 ETV5 7.03 NM_004454
200696_s_at gelsolin (amyloidosis, Finnish type) GSN 3.65 NM_000177
ECM/ECM remodeling
205828_at matrix metallopeptidase 3 (stromelysin 1, progelatinase) MMP3 26.05 NM_002422
217757_at alpha-2-macroglobulin A2M 25.43 NM_000014
210042_s_at cathepsin Z CTSZ 7.14 NM_001336
212158_at syndecan 2 SDC2 15.68 NM_002998
202439_s_at iduronate 2-sulfatase IDS 2.31 NM_000202
202071_at syndecan 4 SDC4 5.98 NM_002999
205559_s_at proprotein convertase subtilisin/kexin type 5 PCSK5 -4.52 NM_006200
206310_at serine peptidase inhibitor, Kazal type 2 SPINK2 -2.30 NM_021114
214768_x_at anti-thyroid peroxidase monoclonal autoantibody IgK chain, V region
FAM20B -4.03 NM_014864
angiogenesis
204984_at glypican 4 GPC4 2.24 NM_001448
201110_s_at thrombospondin 1 THBS1 -8.29 NM_003246
212070_at G protein-coupled receptor 56 GPR56 -7.31 NM_001145774
219501_at ecto-NOX disulfide-thiol exchanger 1 ENOX1 3.47 NM_017993
219278_at mitogen-activated protein kinase kinase kinase 6 MAP3K6 2.41 NM_004672
211499_s_at mitogen-activated protein kinase 11 MAPK11 2.24 NM_002751
213693_s_at mucin 1, cell surface associated MUC1 2.46 X80761
bone remodeling
209875_s_at secreted phosphoprotein 1 SPP1/OPN 448.78 J04765
201141_at glycoprotein (transmembrane) nmb GPNMB 147.53 NM_001005340
a) bone growth
209031_at cell adhesion molecule 1 CADM1 14.85 NM_014333
203411_s_at lamin A/C LMNA 13.75 NM_005572
Table 2. (Continued)
Probe Set ID Gene Title Gene
Symbol
FC Representative Public ID
212458_at sprouty-related, EVH1 domain containing 2 SPRED2 4.33 AY299090
205066_s_at ectonucleotide pyrophosphatase/phosphodiesterase 1 ENPP1 7.20 NM_006208
206026_s_at tumor necrosis factor, alpha-induced protein 6 TNFAIP6 4.84 NM_007115
202283_at serpin peptidase inhibitor, clade F, member 1 SERPINF1 4.77 NM_002615
201951_at activated leukocyte cell adhesion molecule ALCAM 5.95 L38608
b) bone erosion
207113_s_at tumor necrosis factor (TNF superfamily, member 2) TNF 3.55 NM_000594
204638_at acid phosphatase 5, tartrate resistant ACP5 3.91 NM_001611
207037_at tumor necrosis factor receptor superfamily, member 11a, NFKB activator
TNFRSF11A 3.77 NM_003839
202252_at RAB13, member RAS oncogene family RAB13 5.37 NM_002870
212151_at pre-B-cell leukemia homeobox 1 PBX1 -2.36 NM_002585
202388_at regulator of G-protein signaling 2, 24kDa RGS2 -4.34 NM_002923
212531_at lipocalin 2 LCN2 -3.26 NM_005564
201417_at SRY (sex determining region Y)-box 4 SOX4 -2.78 NM_003107
203395_s_at hairy and enhancer of split 1 HES1 -2.18 NM_005524
signaling pathways a) Wnt and beta-catenin pathway
205003_at dedicator of cytokinesis 4 DOCK4 13.81 AY233380
213693_s_at mucin 1, cell surface associated MUC1 2.46 X80761
219889_at frequently rearranged in advanced T-cell lymphomas FRAT1 -2.59 NM_005479
205805_s_at receptor tyrosine kinase-like orphan receptor 1 ROR1 2.02 NM_005012
208712_at cyclin D1 CCND1 9.94 NM_053056.2
201667_at gap junction protein, alpha 1, 43kDa GJA1 9.03 NM_000165
216511_s_at transcription factor 4 TCF4/
TCF7L2
-7.27 NM_001146274
b) MAP-kinase pathway
219278_at mitogen-activated protein kinase kinase kinase 6 MAP3K6 2.41 NM_004672
211499_s_at mitogen-activated protein kinase 11 MAPK11 2.24 NM_002751
212912_at ribosomal protein S6 kinase, 90kDa, polypeptide 2 RPS6KA2 2.65 NM_021135
202581_at heat shock 70kDa protein 1A HSPA1A 6.94 NM_005345
d) Insulin pathway
209185_s_at insulin receptor substrate 2 IRS2 -4.83 AF073310
205066_s_at ectonucleotide pyrophosphatase/phosphodiesterase 1 ENPP1 7.20 NM_006208
206020_at suppressor of cytokine signaling 6 SOCS6 2.26 NM_004232
b) Notch pathway
211974_x_at recombination signal binding protein for immunoglobulin kappa J region
RBPJ 2.92 NM_203284
203395_s_at hairy and enhancer of split 1 HES1 -2.18 NM_005524
207113_s_at tumor necrosis factor (TNF superfamily, member 2) TNF 3.55 NM_000594
e) Type I interferon pathway
202411_at interferon, alpha-inducible protein 27 IFI27 13.74 NM_005532
204439_at interferon-induced protein 44-like IFI44L 2.23 NM_006820
214453_s_at interferon-induced protein 44 IFI44 2.32 NM_006417
204415_at interferon, alpha-inducible protein 6 IFI6 2.20 NM_022873
213797_at radical S-adenosyl methionine domain containing 2 RSAD2 3.68 NM_080657
i.e. the CUB domain containing protein 1, CDCP1 (FC 3.6) [
67
]; gelsolin, GSN (FC 3.65) [
68
];
the fatty acid binding protein 5, FABP5 (FC 12.73) [
69
], and the ets variant 5, ETV5 (FC 7.03),
a pro-invasive transcription factor tought to be involved in bone invasion [
70
].
Several genes encoding for ECM components or involved in ECM remodeling were
modu-lated in PsA samples. We found a strong overexpression of syndecan 2, SDC2 (FC 15.68) and
syndecan 4, SDC4 (FC 5.98) and of several proteases-encoding genes, including matrix
metal-lopeptidase 3, MMP3 (FC 26.05), suppression of tumorigenicity 14, ST14/matriptase (FC 2.78);
carboxy-peptidase cathepsin Z, CTSZ (FC 7.14) [
71
] and iduronate 2-sulfatase, IDS (FC 2.31)
[
72
]. On the contrary, inhibitors of metalloproteases, proprotein convertase subtilisin/kexin
type 5, PCSK5/PC5/6 (FC -4.52) [
73
], and serine peptidase inhibitor, Kazal type 2, SPINK2
(FC -2.30) [
74
] were underexpressed.
Differentially expressed genes also comprise transcripts which regulate the angiogenesis
process [
75
–
78
].
A large number (28/196) of genes differentially expressed in PsA biopsies belong to the
bone remodeling cluster which comprises transcripts involved in bone-growth and bone
resorption. Upregulated genes promote bone growth with different mechanisms such as
osteo-blast differentiation i.e: lamin A, LMNA (FC 13.75) [
79
]; bone-matrix deposition, i.e: cell
adhe-sion molecule 1, CADM1 (FC 14.85) [
80
]; bone development, i.e: sprouty-related, EVH1
domain containing 2, SPRED2 (FC 4.33) [
81
]; bone mineralization i.e: ectonucleotide
pyropho-sphatase/phosphodiesterase 1, ENPP1/NPP1 (FC 7.20), [
82
] and bone morphogenesis, i.e:
acti-vated leukocyte cell adhesion molecule, ALCAM/CD166 (FC 5.95), [
83
].
Genes inhibiting osteoblast proliferation [
84
,
85
]and osteoblast differentiation [
86
–
88
] were
expressed in lower levels in PsA samples.
In addition the following upregulated genes may support bone growth by interfering with
osteoclast activity: tumor necrosis factor, alpha-induced protein 6, TNFAIP6/TSG6 (FC 4.84)
[
89
], and serpin peptidase inhibitor, clade F member 1, SERPINF1/PEDF (FC 4.77).
In the bone resorption cluster, the following upregulated genes promote osteoclast activity
and/or differentiation: the acid phosphatase 5, tartrate resistant, ACP5/TRAP (FC 3.91) [
90
],
the tumor necrosis factor a, TNFa (FC 3.55); member RAS oncogene family, RAB13 (FC 5.37)
Table 2. (Continued)
Probe Set ID Gene Title Gene
Symbol
FC Representative Public ID
217502_at interferon-induced protein with tetratricopeptide repeats 2 IFIT2 2.03 NM_001547 203153_at interferon-induced protein with tetratricopeptide repeats 1 IFIT1 3.17 NM_001548 204747_at interferon-induced protein with tetratricopeptide repeats 3 IFIT3 2.58 NM_001549
219209_at interferon induced with helicase C domain 1 IFIH1 2.15 NM_022168
205469_s_at interferon regulatory factor 5 IRF5 2.03 NM_001098629
205483_s_at ISG15 ubiquitin-like modifier ISG15 2.03 NM_005101
202086_at myxovirus resistance 1, interferon-inducible protein p78 MX1 3.05 NM_002462
208436_s_at interferon regulatory factor 7 IRF7 2.15 NM_001572
f) others
201020_at tyrosine 3-monooxygenase/tryptophan 5-monooxygenase activation protein, eta
YWHAH 3.27 NM_003405
209050_s_at ral guanine nucleotide dissociation stimulator RALGDS 2.43 NM_006266
221211_s_at chromosome 21 open reading frame 7 C21orf7 -8.00 NM_020152
[
91
] and tumor necrosis factor receptor superfamily, member 11a, NFKB activator,
TNFRSF11A/RANK (FC 3.77) [
92
].
Noteworthy the bone remodeling category contains two genes, osteopontin and
osteoacti-vin, which show a very high level of induction (FC 450 and 147 respectively).
Finally we analysed DEGs which belong to /or are connected to the gene cluster signal
trans-duction using a pathway analysis tool to evaluate if they contribute to known signaling
net-works that may be relevant in the pathogenesis of PsA and found that a conspicuous number
of genes (also including genes originally ascribed to different functional classes) is involved in
well characterized signaling networks already associated to human diseases, including
immune-mediated diseases, bone diseases and inflammatory diseases.
These signal cascades include: 1) the Interferon-alpha (IFN-A) pathway also named
“
Type I
Interferon signature
”
[
93
], 2) the Wnt/beta-catenin signaling pathway, 3) the Notch signaling
pathway, 4) the mitogen activated protein (MAP) kinase pathway, and 5) the insulin pathway.
In particular 13 type I interferon inducible genes (IFIG) were upregulated, thus indicating
the presence of an IFN type I signature, typically associated with autoimmune disease such as
systemic lupus erythematosus (SLE), rheumatoid arthritis (RA), Crohn
’
s disease and Sjogren
syndrome [
94
–
100
].
Seven modulated genes belong to the WNT signalling pathway which has been associated
with the pathogenesis of RA, and in particular with synovial inflammation and bone
remodel-ing [
101
–
107
].
Three genes belong to the Notch signalling pathway that is crucial for bone homeostasis and
is involved in the pathogenesis of several immune-mediated diseases, including RA [
108
].
Four genes of the MAP kinase pathway are upregulated including: mitogen-activated
pro-tein kinase 11, MAPK11 (FC 2.24), mitogen-activated propro-tein kinase 6,MAP3K6 (FC 2.41),
ribosomal protein S6 kinase, 90 kDa, polypeptide 2, RPS6KA2 (FC 2.65), heat shock 70 kDa
protein 1 A, HSPA1A (FC 6.94). The p38 MAPK signalling pathway has been associated with
psoriasis and psoriatic arthritis [
109
].
Two genes belong to the insulin pathway: insulin receptor substrate 2, IRS2 (FC-4.83) and
ectonucleotyde pyrophosphatase/phosphodiesterase 1, ENPP1 (FC 7.2). The insulin pathway is
involved in the pathogenesis of the metabolic syndrome [
110
] and an increased body mass
index increases the risk of PsA development in patients with cutaneous psoriasis, supporting a
link between fat-mediated inflammation and joint involvement [
111
].
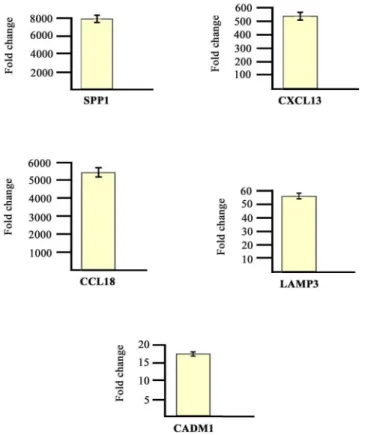
The modulation of some genes observed by gene array analysis was validated by Q-PCR
(
Fig 2
).
B) DEGs in PBC.
We next compared the gene expression profiles of 10 PBC samples
obtained from the same PsA patients used for the biopsy collection with 10 PBC samples
obtained from healthy age and sex matched donors. When the same statistical criteria and fold
change criteria were applied to the modulated genes, we obtained 187 genes that were further
analysed. 118 and 69 genes resulted to be up- or downregulated respectively. While the number
of DEGs in PBC is similar to that obtained in synovial biopsies, the average level of gene
induc-tion (FC) is much lower in PBC when compared to the synovium. DEGs are distributed in
sev-eral functional classes which partially overlap with the ones identified by genes modulated in
PsA synovium. The gene categories comprise: inflammation, immune response, apoptosis, cell
cycle regulation and proliferation, cell migration and invasion, ECM/ECM remodeling, bone
remodelling, angiogenesis, signal transduction.
A detailed representation of modulated genes within the above-mentioned clusters vcan be
found in
S2 Table
.
classes which show the highest enrichment in modulated trascripts are the immune response
(36/187), the signal transduction (25/187) the inflammation (25/187), and the bone remodeling
(17/187) gene clusters.
Remarkably, in the immune response group, we observed increased expression of several
Th17 related genes (CCR6 [
112
]; CCL20 [
113
]; lymphocyte antigen 9, LY9 [
114
,
115
];
interleu-kin 6 signal transducer, IL6ST [
116
–
118
], interleukin 12 receptor, beta 2, IL12RB [
119
]).
Noteworthy 10 IFIG were modulated also in PBC samples, thus confirming the presence of
an INFA signature observed within the synovium.
Consistently with the presence of a strong inflammatory response typical of PsA we also
observed upregulation of several proinflammatory genes (IL8; CCL18; chemokine (C-X-C
motif) ligand 1, CXCL1; IL1A; OLR1; HSPA1A; CXCL9; see
S2 Table
). New bone formation is
a typical feature of PsA and consistently with this aspect of the disease several genes involved
in the bone growth process are modulated also in PBC.
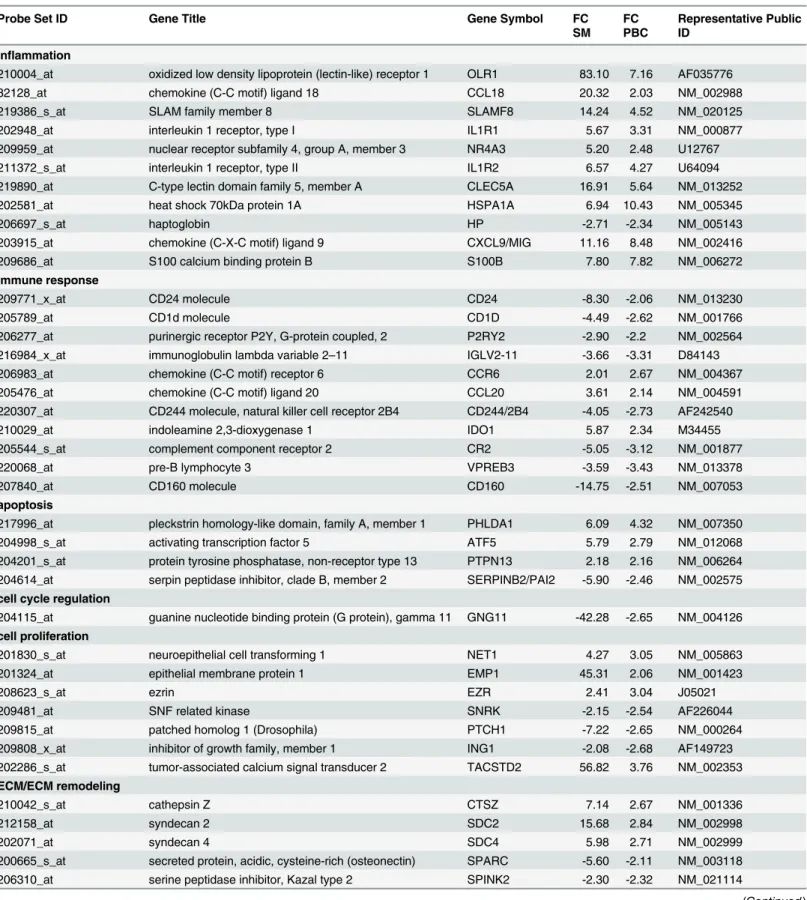
The analysis of the expression profiles of the PBC samples revealed that 90 out of 187
tran-scripts differently regulated in PBC were also modulated in PsA synovium (
Table 3
). These
genes belong to different functional classes including: immune response and inflammation;
angiogenesis, apoptosis; bone remodeling; cell proliferation; extracellular matrix remodeling
and ECM components; signal transduction.
Fig 2. Real time RT-PCR of some modulated genes.Genes selected for validation were SPP1, CXCL13, CCL18, LAMP3 and CADM1. The transcripts of the selected genes were increased in PsA samples when compared to healthy donors. Relative expression levels were calculated for each sample after normalization against the housekeeping gene GAPDH. Experiments have been conducted in triplicates. Similar results were obtained using the housekeeping genes18s rRNA and beta-actin (data not shown).
Table 3. Annotated genes differentially expressed in PsA synovial membranes and in PsA PBC versus healthy controls grouped according to their function.
Probe Set ID Gene Title Gene Symbol FC
SM FC PBC
Representative Public ID
inflammation
210004_at oxidized low density lipoprotein (lectin-like) receptor 1 OLR1 83.10 7.16 AF035776
32128_at chemokine (C-C motif) ligand 18 CCL18 20.32 2.03 NM_002988
219386_s_at SLAM family member 8 SLAMF8 14.24 4.52 NM_020125
202948_at interleukin 1 receptor, type I IL1R1 5.67 3.31 NM_000877
209959_at nuclear receptor subfamily 4, group A, member 3 NR4A3 5.20 2.48 U12767
211372_s_at interleukin 1 receptor, type II IL1R2 6.57 4.27 U64094
219890_at C-type lectin domain family 5, member A CLEC5A 16.91 5.64 NM_013252
202581_at heat shock 70kDa protein 1A HSPA1A 6.94 10.43 NM_005345
206697_s_at haptoglobin HP -2.71 -2.34 NM_005143
203915_at chemokine (C-X-C motif) ligand 9 CXCL9/MIG 11.16 8.48 NM_002416
209686_at S100 calcium binding protein B S100B 7.80 7.82 NM_006272
immune response
209771_x_at CD24 molecule CD24 -8.30 -2.06 NM_013230
205789_at CD1d molecule CD1D -4.49 -2.62 NM_001766
206277_at purinergic receptor P2Y, G-protein coupled, 2 P2RY2 -2.90 -2.2 NM_002564
216984_x_at immunoglobulin lambda variable 2–11 IGLV2-11 -3.66 -3.31 D84143
206983_at chemokine (C-C motif) receptor 6 CCR6 2.01 2.67 NM_004367
205476_at chemokine (C-C motif) ligand 20 CCL20 3.61 2.14 NM_004591
220307_at CD244 molecule, natural killer cell receptor 2B4 CD244/2B4 -4.05 -2.73 AF242540
210029_at indoleamine 2,3-dioxygenase 1 IDO1 5.87 2.34 M34455
205544_s_at complement component receptor 2 CR2 -5.05 -3.12 NM_001877
220068_at pre-B lymphocyte 3 VPREB3 -3.59 -3.43 NM_013378
207840_at CD160 molecule CD160 -14.75 -2.51 NM_007053
apoptosis
217996_at pleckstrin homology-like domain, family A, member 1 PHLDA1 6.09 4.32 NM_007350
204998_s_at activating transcription factor 5 ATF5 5.79 2.79 NM_012068
204201_s_at protein tyrosine phosphatase, non-receptor type 13 PTPN13 2.18 2.16 NM_006264 204614_at serpin peptidase inhibitor, clade B, member 2 SERPINB2/PAI2 -5.90 -2.46 NM_002575
cell cycle regulation
204115_at guanine nucleotide binding protein (G protein), gamma 11 GNG11 -42.28 -2.65 NM_004126
cell proliferation
201830_s_at neuroepithelial cell transforming 1 NET1 4.27 3.05 NM_005863
201324_at epithelial membrane protein 1 EMP1 45.31 2.06 NM_001423
208623_s_at ezrin EZR 2.41 3.04 J05021
209481_at SNF related kinase SNRK -2.15 -2.54 AF226044
209815_at patched homolog 1 (Drosophila) PTCH1 -7.22 -2.65 NM_000264
209808_x_at inhibitor of growth family, member 1 ING1 -2.08 -2.68 AF149723
202286_s_at tumor-associated calcium signal transducer 2 TACSTD2 56.82 3.76 NM_002353
ECM/ECM remodeling
210042_s_at cathepsin Z CTSZ 7.14 2.67 NM_001336
212158_at syndecan 2 SDC2 15.68 2.84 NM_002998
202071_at syndecan 4 SDC4 5.98 2.71 NM_002999
200665_s_at secreted protein, acidic, cysteine-rich (osteonectin) SPARC -5.60 -2.11 NM_003118
206310_at serine peptidase inhibitor, Kazal type 2 SPINK2 -2.30 -2.32 NM_021114
Table 3. (Continued)
Probe Set ID Gene Title Gene Symbol FC
SM FC PBC
Representative Public ID
214768_x_at anti-thyroid peroxidase monoclonal autoantibody IgK chain, V region
FAM20B -4.03 -2.52 NM_014864
angiogenesis
212070_at G protein-coupled receptor 56 GPR56 -7.31 -3.25 NM_001145774
218723_s_at chromosome 13 open reading frame 15 C13orf15 3.11 2.74 NM_014059
201110_s_at thrombospondin 1 THBS1 -8.29 -3.48 NM_003246
bone remodeling
206026_s_at tumor necrosis factor, alpha-induced protein 6 TNFAIP6 4.84 4.23 NM_007115
202283_at serpin peptidase inhibitor, clade F, member 1 SERPINF1 4.77 2.77 NM_002615
222258_s_at SH3-domain binding protein 4 SH3BP4 3.73 3.11 AF015043
203395_s_at hairy and enhancer of split 1 HES1 -2.18 -2.23 NM_005524
208328_s_at myocyte enhancer factor 2A MEF2A 2.51 2.45 NM_005587
212151_at pre-B-cell leukemia homeobox 1 PBX1 -2.36 -2.2 NM_002585
205548_s_at BTG family, member 3 BTG3/ANA 2.29 4.76 NM_006806
212531_at lipocalin 2 LCN2 -3.26 -3.43 NM_005564
213222_at phospholipase C, beta 1 (phosphoinositide-specific) PLCB1 -3.68 -2.73 NM_182734
201417_at SRY (sex determining region Y)-box 4 SOX4 -2.78 -3.03 NM_003107
210786_s_at Friend leukemia virus integration 1 FLI1/ETS1 -2.25 -2.16 M93255
209875_s_at secreted phosphoprotein 1 SPP1/OPN 448.78 4.32 J04765
201141_at glycoprotein (transmembrane) nmb GPNMB 147.53 3.27 NM_001005340
203411_s_at lamin A/C LMNA 13.75 2.4 NM_005572
202252_at RAB13, member RAS oncogene family RAB13 5.37 2.62 NM_002870
signaling pathways
201020_at tyrosine 3-monooxygenase YWHAH 3.27 2.37 NM_003405
221211_s_at chromosome 21 open reading frame 7 C21orf7 -8.00 -2.81 NM_020152
206020_at suppressor of cytokine signaling 6 SOCS6 2.26 3.15 NM_004232
202581_at heat shock 70kDa protein 1A HSPA1A 6.94 10.43 NM_005345
209185_s_at insulin receptor substrate 2 IRS2 -4.83 -2.05 AF073310
203395_s_at hairy and enhancer of split 1 HES1 -2.18 -2.23 NM_005524
214453_s_at interferon-induced protein 44 IFI44 2.32 2.06 NM_006417
204439_at interferon-induced protein 44-like IFI44L 2.23 2.34 NM_006820
204415_at interferon, alpha-inducible protein 6 IFI6 2.20 3.04 NM_022873
213797_at radical S-adenosyl methionine domain containing 2 RSAD2 3.68 2.65 NM_080657
203153_at interferon-induced protein with tetratricopeptide repeats 1 IFIT1 3.17 2.21 NM_001548 204747_at interferon-induced protein with tetratricopeptide repeats 3 IFIT3 2.58 3.06 NM_001549
205469_s_at interferon regulatory factor 5 IRF5 2.03 2.78 NM_001098629
205483_s_at ISG15 ubiquitin-like modifier ISG15 2.03 2.23 NM_005101
202086_at myxovirus resistance 1, interferon-inducible protein p78 MX1 3.05 2.66 NM_002462
205003_at dedicator of cytokinesis 4 DOCK4 13.81 2.04 AY233380
216511_s_at transcription factor 4 TCF7L2/TCF4 -7.27 -2.25 NM_001146274
cell junctions
204627_s_at integrin, beta 3 ITGB3 -9.21 -2.46 NM_000212
206493_at integrin, alpha 2b ITGA2B -5.36 -2.33 NM_000419
microtubule-based process
204141_at tubulin, beta 2A TUBB2A 5.21 3.06 NM_001069
Frequency of IL-17–positive CD4+T cells in PBMCs from patients with
PsA
Using flow cytometry, we evaluated the intracellular expression of the cytokine IL-17, by
PBMCs from 30 patients with PsA and from 20 healthy control subjects, following stimulation
with microbeads coated with anti-CD3 and CD28 or with Candida Albicans. We observed a
higher proportion of IL-17
–
producing CD4+ T cells within the PBMCs of patients with PsA
compared with healthy control subjects.
The mean values obtained in 30 PsA PBMC following stimulation with anti-CD3 and CD28
were 1.3% +/- 0.28 versus 0.65% +/- 0.2 (p = 0.005), while the mean values obtained in PSA
PBMC following stimulation with Candida Albicans were 0.63% +/- 0.18 versus 0.33%+/- 0.07
(p = 0.004). Representative FACS experiments are shown in Fig (
3A
and
3B
).
Detection of IL-17 and IL-23 in synovial fluids from patients with PsA
Il-17 and IL-23 levels were investigated in 20 SFs of patients with PsA and in 20 SF of patients
with OA used as controls. SF IL-17 levels were higher in PSA patients (17.87±11.13 pg/mL)
than in controls (5.12±1.30 pg/mL) (p
<
0.01). SF IL-23 levels were higher in PSA patients
(37.17±18.13 pg/mL) than in controls (14.12±7.23 pg/mL) (p
<
0.01)
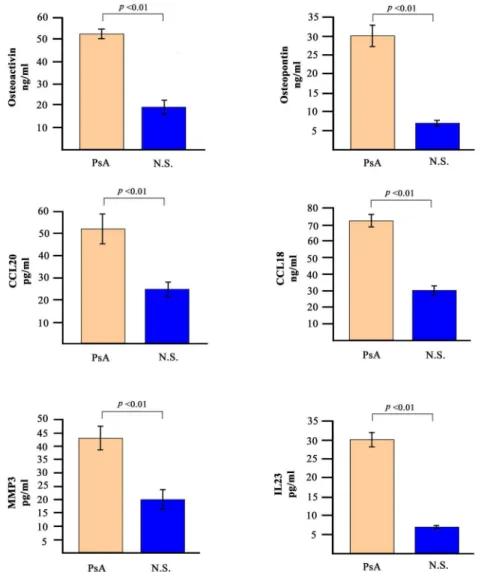
Detection of soluble mediators in PsA sera
The analysis of gene expression profiles was paralleled by the detection of some of the
corre-sponding soluble mediators in the sera of patients with PsA. We decided to analyse the levels of
osteopontin, osteoactivin, CCL20, CCL18, MMP-3 and IL-23.
Fig 4
shows the concentration of
these molecules in the sera of the 30 PsA patients. The serum levels of all the molecules tested
was significantly higher in PsA patients when compared to 30 normal healthy donors.
When osteopontin and osteoactivin were evaluated in the entire cohort of 60 patients with
PsA and compared with 60 normal subjects and with 60 patients affected by RA and AS,
Table 3. (Continued)
Probe Set ID Gene Title Gene Symbol FC
SM FC PBC
Representative Public ID
transport
209267_s_at solute carrier family 39 (zinc transporter), member 8 SLC39A8 6.68 2.96 AB040120
209610_s_at solute carrier family 1, member 4 SLC1A4 2.58 2.27 NM_003038
220974_x_at sideroflexin 3 SFXN3 2.93 2.14 NM_030971
201243_s_at ATPase, Na+/K+ transporting, beta 1 polypeptide ATP1B1 3.86 2.97 NM_001677
others
221541_at cysteine-rich secretory protein LCCL domain containing 2 CRISPLD2 -6.35 -2.52 NM_031476
206643_at histidine ammonia-lyase HAL -4.98 -3.37 NM_002108
209574_s_at chromosome 18 open reading frame 1 C18orf1/
LDLRAD4
2.27 2.13 NM_181481
203518_at lysosomal trafficking regulator LYST -2.31 -2.17 NM_000081
208442_s_at ataxia telangiectasia mutated ATM -3.32 -3.2 NM_000051
207156_at histone cluster 1, H2ag HIST1H2AG -3.58 -2.04 NM_021064
204838_s_at mutL homolog 3 MLH3 -4.14 -2.33 NM_014381
218711_s_at serum deprivation response SDPR -19.65 -2.04 NM_004657
218865_at MOCO sulphurase C-terminal domain containing 1 MOSC1/MARC1 -4.86 -2.45 NM_022746
213022_s_at utrophin UTRN/DRP1 -2.15 -2.59 NM_007124
osteoactivin was found to be statistically higher in subjects with PsA (
Fig 5
) with a high
sensi-tivity and specificity (
Fig 6
).
Discussion
In this paper we provide for the first time a comprehensive analysis of the transcriptome within
SM and PBC obtained from the same patients affected by PsA. We believe that the combined
analysis of the gene expression profiles of paired synovial biopsies and PBC of patients with
PsA is likely to better dissect the complex molecular pathways that regulate the different clinical
and histopatological aspects of the disease. One contribution of this work is therefore a detailed
compilation of genes relevant to the pathogenesis of PsA. Indeed the vast majority of DEGs is
involved in biological processes closely connected to the main features of the disease.
Notewor-thy we observed that, when comparing DEGs in synovial biopsies with DEGs in PBC, a large
number of genes were similarly modulated in the two settings, indicating that PBC may be a
sig-nificant promise for gene expression studies as substitute of tissues that are not easily accessible.
A feature of PsA histopathology is the synovial membrane lining layer hyperplasia, which in
RA has been at least in part attributed to an impairement of fibroblast-like-synoviocyte (FLS)
apoptosis [
120
]. Our analysis of apoptosis-related genes indicate a predominant overexpression
of anti-apoptotic transcripts which may contribute to the cell accumulation phenomena typical
of synovial hyperplasia.
Fig 3. Flow cytometric analysis of IL-17 producing CD4+ lymphocytes in patients with PsA.Data are representative of all the 30 subjects studied. A and B panels show the percentages of IL-17 producing CD4 + lymphocytes in PBMC of healthy donors (N.S) and patients affected by PsA (PsA) after stimulation with Dynabeads Human T-Activator CD3/CD28 (panel a) or with heat-inactivatedCandida albicans(panel b).
The synovial hyperplastic growth may also be sustained by the global upregulation of genes
with mitogenic effect and by the repression of anti-proliferative transcripts observed in PsA
samples.
Interestingly, the overexpression of the GAS6 and EZR genes has been already associated
with FLS proliferation in inflammatory arthitides [
60
,
121
]. FLSs are indeed the predominant
cell type in synovial membrane and, especially when switching their phenotype to
macro-phage-like cells, they can destroy extracellular matrix, deeply penetrating into bone and
carti-lage [
122
]. It is worthwhile mentioning that EZR has already been reported as differentially
expressed in PsA by Pollock et al. [
123
]
In PsA synovium, genes involved in cell migration and tissue invasion are strongly
upregu-lated (ie ETV5, and FABP5) consistently with the acquisition of a proinvasive phenotype by
PsA synoviocytes. This behaviour may also depend on overexpression of extracellular matrix
degrading enzymes.
Fig 4. Serum levels of selected soluble mediators in PsA patients and in normal subjects.The histograms represent the mean of the results obtained in 30 healthy donors and in 30 PsA patients.pvalues were calculated using the non-parametric Mann-Whitney test.
Fig 5. Serum levels of osteopontin and osteoactivin in PsA patients and in control subjects.Graphical representation of the distributions of osteopontin (A) and osteoactivin (B) serum levels in: 60 psoriatic arthritis (PsA) patients, 60 rheumatoid arthritis (RA) patients, 60 ankylosing spondylitis (AS) patients and in 60 normal subjects (NS).pvalues were calculated using the non-parametric Mann-Whitney test: Osteopontin: PsA vs NS:p<0.01; PsA vs SA:p<0.01, PsA vs AR:pnot significant. Osteoactivin: PsA vs NS:p<0.01; PsA vs SA: p<0.05; PsA vs AR:p<0.01.
doi:10.1371/journal.pone.0128262.g005
Fig 6. Sensitivity and specificity of the assay of osteoactivin levels between PsA patients and control subjects.AUC: area under the curve; CI: confidence interval.