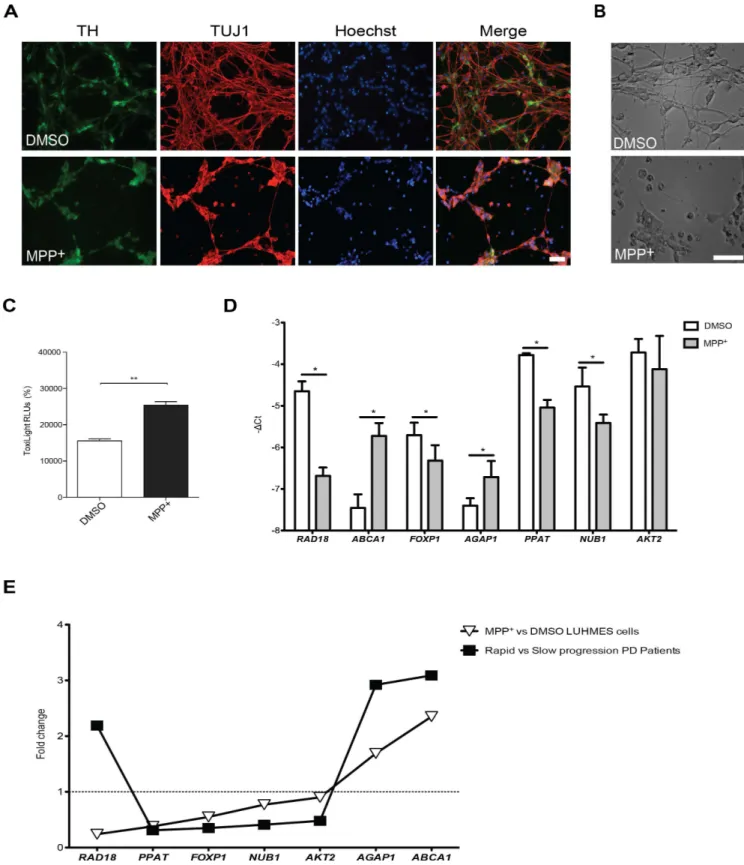
Gene Expression Differences in Peripheral Blood of Parkinson ’s Disease Patients with Distinct Progression Profiles
Texto
Imagem
Documentos relacionados
To determine the potential usefulness of KLK2 and KLK3 as biomarkers in the diagnosis of prostate cancer we used multiplex semi-quantitative RT-PCR to detect mRNA in prostate
Effect of rosiglitazone on progression of coronary atherosclerosis in patients with type 2 diabetes melli- tus and coronary artery disease: the assessment on the
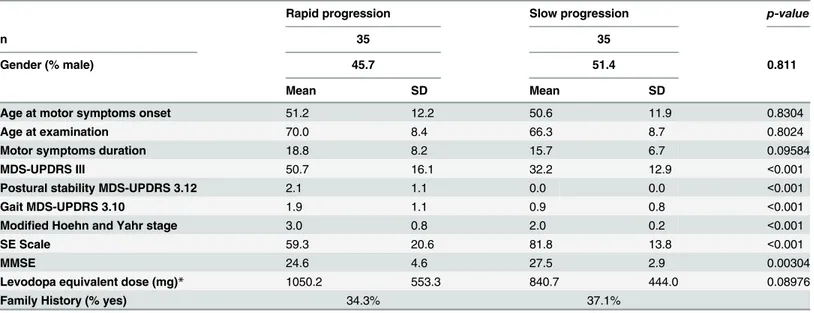
In the population studied, the CCR5 genotype was unable to account for the differences in pattern of the disease progression among the three groups (rapid, moderate and
CD4 + and CD8 + lym- phocyte profiles in the peripheral blood of MDS patients were evaluated and correlated with clinical characteristics, the expression of FOXP3 and
Our microarray analysis of the gene expression pro- file of degenerated IVD detected hundreds of differentially expressed genes that may be associated with IVD degener-
The evidence from our analysis clearly suggests that residential mobility does have an independent and additional effect on political attitudes as measured by voting intentions in the
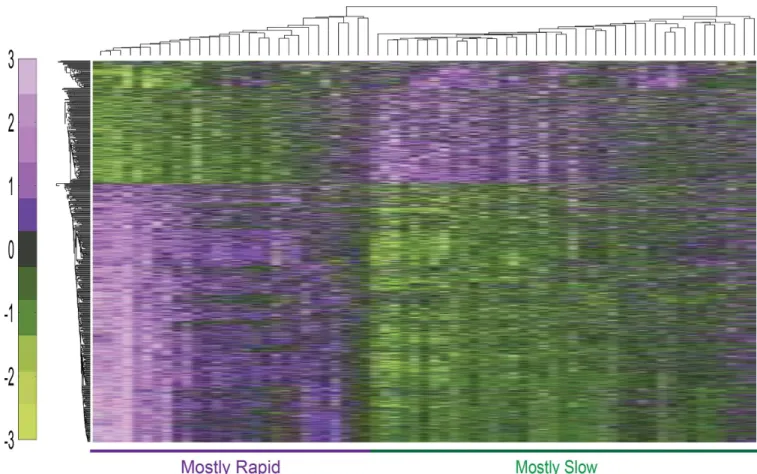
As a result of gene expression analysis based on whole blood RNA, the number of expressed genes was less in fetal stage and infancy period but increased with age, presenting a
In order to identify genes potentially involved in the patho- genesis of PsA, we first compared the gene expression profiles of 10 synovial biopsies obtained from patients with PsA
The integration of functional gene annotations in the analysis confirms the detected differences in gene expression across tissues and confirms the expression of porcine genes being
