Perceived Food Hypersensitivity Relates to
Poor Asthma Control and Quality of Life in
Young Non-Atopic Asthmatics
Jennifer Johnson1*, Magnus P. Borres1,2, Lennart Nordvall1, Jonas Lidholm2, Christer Janson3, Kjell Alving1‡, Andrei Malinovschi4‡
1Department of Women’s and Children’s Health, Uppsala University, Uppsala, Sweden,2Thermo Fisher Scientific, Uppsala, Sweden,3Department of Medical Sciences, Respiratory Medicine and Allergology, Uppsala University, Uppsala, Sweden,4Department of Medical Sciences, Clinical Physiology, Uppsala University, Uppsala, Sweden
‡These authors contributed equally to the present paper. *[email protected]
Abstract
Background
The relationship between perceived food hypersensitivity in asthmatics, food allergen sensi-tization, asthma control and asthma-related quality of life has not been studied.
Objective
Our aim was to study the prevalence of perceived food hypersensitivity in a cohort of young asthmatics, its relation to food allergen sensitization, and any correlation to asthma control and asthma-related quality of life.
Methods
Perceived food hypersensitivity, as well as IgE sensitization to common food allergens, lev-els of exhaled nitric oxide (FeNO), and blood eosinophil counts (B-Eos) were assessed in 408 subjects (211 women) with asthma, aged (mean±SEM) 20.4±0.3 years. Subjects
filled out the Asthma Control Test (ACT) and the Mini Asthma Quality of Life Questionnaire (Mini-AQLQ). Inflammation was assessed by means of FeNO and B-Eos.
Results
Fifty-three per cent of subjects reported food hypersensitivity. A corresponding food aller-gen sensitization was found in 68% of these subjects. Non-atopic subjects with perceived food hypersensitivity (n = 31) had lower ACT (19 (15 - 22) vs. 21 (20 - 23), p<0.001) and
Mini-AQLQ -scores (5.3 (4.3 - 6.1) vs. 6.1 (5.5 - 6.5), p<0.001) than subjects with no food
hypersensitivity (n = 190), despite lower levels of FeNO and B-Eos (p<0.05). OPEN ACCESS
Citation:Johnson J, Borres MP, Nordvall L, Lidholm J, Janson C, Alving K, et al. (2015) Perceived Food Hypersensitivity Relates to Poor Asthma Control and Quality of Life in Young Non-Atopic Asthmatics. PLoS ONE 10(4): e0124675. doi:10.1371/journal. pone.0124675
Academic Editor:Konstantinos Kostikas, University of Athens Medical School, GREECE
Received:December 7, 2014
Accepted:March 17, 2015
Published:April 29, 2015
Copyright:© 2015 Johnson et al. This is an open access article distributed under the terms of the
Creative Commons Attribution License, which permits unrestricted use, distribution, and reproduction in any medium, provided the original author and source are credited.
Data Availability Statement:The authors confirm that all data underlying the findings are fully available without restriction. All relevant data are within the paper.
Conclusions and Clinical Relevance
Food hypersensitivity was commonly reported among young asthmatics. In a majority of cases, a corresponding food allergen sensitization was found. A novel and clinically impor-tant finding was that non-atopic subjects with perceived food hypersensitivity were charac-terized by poorer asthma control and asthma-related quality of life.
Introduction
The prevalence of food hypersensitivity (in our study defined as any adverse reaction upon food intake) is estimated to be between 12% and 20% in adults [1–3]. In a Swedish birth-co-hort, food hypersensitivity was reported by parents in 11% of children at 4 years of age [4]. The prevalence of food allergy (in our study defined as IgE-mediated allergic reactions) in the US population is estimated to be almost 10% in adults [5], and 3–6% in children [5,6]. Twenty-four per cent of asthmatic children included in the School-Inner City Asthma Study had physi-cian-diagnosed food allergy [7]. Food allergy is related to more severe asthma disease, with an increased risk for asthma exacerbations, a higher rate of corticosteroid use, and more frequent hospitalizations [7–14]. The prevalence of perceived food hypersensitivity in an asthma cohort has, to our knowledge, not been investigated, and the relationship between perceived food hypersensitivity, food allergen sensitization, asthma control and asthma-related quality of life has not been studied previously.
Among subjects with asthma, a high prevalence of food allergen sensitization has been re-ported in children [14] as well as in adults [15]. Food allergen sensitization affects both local and systemic markers of inflammation in asthma [16,17]. There is a relationship between mul-tiple IgE sensitization and increased prevalence of asthma [18,19]. In pollen-sensitized individ-uals, food allergen sensitization increases asthma prevalence and airway inflammation [18].
Our aim was to study the prevalence of perceived food hypersensitivity in an asthma cohort, its relation to food allergen sensitization, and any correlation to manifestations of food hyper-sensitivity symptoms, asthma control, and asthma-related quality of life.
Materials and Methods
Study population
This project was run as a cross-sectional study within the framework of an academy-industry collaboration on Minimally-Invasive Diagnostics for Asthma and allergic diseases (MIDAS) [18,20]. A total of 408 children and young adults (10–34 years) with physician-diagnosed asth-ma, recruited from both primary and specialist care in Uppsala, Sweden, and 118 controls with data on perceived food hypersensitivity symptoms and food IgE sensitization were included in the study. All asthma subjects were on daily treatment with inhaled corticosteroids (ICS) and/ or oral leukotriene receptor antagonists (LTRA) during at least three months of the year before study entry. The controls were age- and sex-matched controls without asthma or other chronic respiratory diseases, randomly chosen from the population registry.
Perceived food hypersensitivity symptoms
An allergy nurse conducted interviews, using a structured questionnaire, and each subject was asked to report any history of hypersensitivity reactions to food allergens commonly occurring in Sweden (egg, cow’s milk, fish, wheat, peanut, soy, hazelnut and/or shrimp). Perceived
Swedish Governmental Agency for Innovation Systems (VINNOVA, SAMBIO program, grant number 2007-00084), where Aerocrine AB and Thermo Fisher Scientific, Immunodiagnostics were partners and co-financed the program. Thermo Fisher Scientific provided support in the form of salaries for authors MPB and JL, but did not have any additional role in the study design, data collection and analysis, decision to publish, or preparation of the manuscript. The specific roles of these authors are articulated in the‘author contributions’section.
Competing Interests:The MIDAS study was financially supported within the framework of an academy/industry collaboration initiated by the Swedish Governmental Agency for Innovation Systems (VINNOVA, SAMBIO program, grant number 2007-00084), where Aerocrine AB and Thermo Fisher Scientific, Immunodiagnostics were partners and co-financed the program. MPB and JL are employed by Thermo Fisher Scientific. There are no patents, products in development or marketed products to declare. This does not alter the authors’
symptoms were grouped according to the organ systems affected: the lower airways (asthma), the upper airways (rhinitis, conjunctivitis), the oral cavity (oral allergy syndrome), the skin (atopic dermatitis, urticaria, angioedema), the gastrointestinal tract (nausea, vomiting, stomach pain, diarrhea), and anaphylaxis (self-reported). Perceived symptoms that did not fit into any group were classified as“other”.
Measurement of IgE sensitization
Food allergen sensitization was defined as IgE antibody concentration0.35 kUA/L to egg,
cow’s milk, cod fish, wheat, peanut, soy, hazelnut or shrimp. Aeroallergen sensitization was de-fined as a positive result from the multi-allergen test Phadiatop (Thermo Fisher Scientific, Uppsala, Sweden), a test containing a mix of grass, tree and weed pollen and animal, mite and mold allergens. All IgE analyses were done with ImmunoCAP (Thermo Fisher Scientific). Atopy was defined as any IgE sensitization (0.35 kUA/L) to food and/or aeroallergens.
Grouping with regard to perceived food hypersensitivity and IgE
sensitization
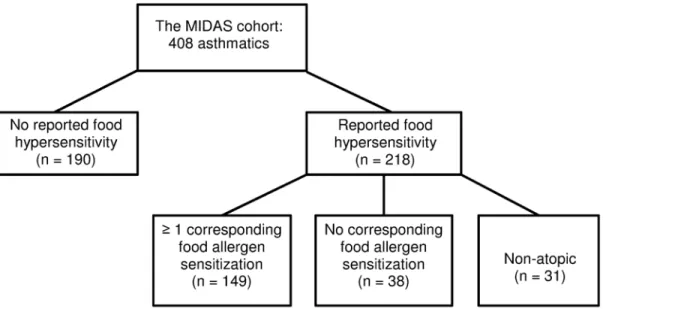
Since we were particularly interested in differences in clinical characteristics in regard to pres-ence or abspres-ence of food hypersensitivity symptoms, asthmatics were divided into five groups, depending on perceived history of food reactions and IgE sensitization patterns (Fig 1). The first group consisted of subjects with no history of perceived food hypersensitivity and no detectable IgE sensitization to the food and aeroallergens investigated. The second group consisted of sub-jects with any detectable sensitization to the food and/or aeroallergens investigated, but without any history of perceived food hypersensitivity. The third group consisted of subjects with a his-tory of perceived food hypersensitivity, and at least one corresponding food allergen sensitiza-tion. The fourth group consisted of subjects with a history of perceived food hypersensitivity, but without any corresponding IgE sensitization, and the fifth group consisted of subjects with a history of perceived food hypersensitivity, but without detectable IgE sensitization to the food and aeroallergens investigated (‘non-atopic’).
Fig 1. Grouping of asthmatics according to history of perceived food hypersensitivity and IgE sensitization status.
Clinical parameters and characteristics
Asthma parameters. The fraction of exhaled nitric oxide (FeNO) was measured with a
chemiluminescence analyzer (NIOX Flex, Aerocrine AB, Solna, Sweden). Eosinophil blood count (B-Eos) was measured with a routine method (Cell-Dyn Sapphire, Abbott, Illinois, USA). Forced expiratory volume in one second (FEV1) was recorded with a MasterScope
spi-rometer (Erich Jaeger, Wurzburg, Germany), and was used as a measure of pulmonary func-tion. The methacholine provocative dose causing a fall of FEV1by 20% (PD20) was determined
with the Aerosol Provocation System (Viasys Healthcare GmbH, Germany). Measurements were done in accordance with standardized routines and guidelines [21–23], and have been de-scribed in detail elsewhere [18,20].
Asthma Control Test and Mini Asthma Quality of Life Questonnaire. Asthmatics were
asked to fill out the Asthma Control Test (ACT) and the Mini Asthma Quality of Life Ques-tionnaire (Mini-AQLQ). The ACT consists of five questions, each with a 5-point scale [24]. The score ranges from 5 to 25, with a lower score indicating poorer asthma control. Subjects with an ACT score<20 were defined as having not well-controlled asthma. The Mini-AQLQ consists of 15 questions, each with a 7-point scale [25]. Both mean total score and for different domains (symptoms, activity limitation, emotional function and environmental sti-muli) were calculated. The score ranges from 1 to 7, with a lower score indicating a poorer quality of life.
Rhinitis and nocturnal gastro-esophageal reflux. Rhinitis was defined as a positive
an-swer to the question“Do you have any nasal allergies, including hay fever?”[26]. Nocturnal gastro-esophageal reflux (GERD) was defined as heartburn or belching after lying down [27].
Body mass index. Height and weight were measured, and body mass index (BMI) was
cal-culated by dividing weight (kg) by the square of height (m). Subjects were subsequently divided into four groups: underweight, normal, overweight and obese. Fixed cut-offs were used for sub-jects aged20 years and percentiles per age and gender for subjects aged<20 years, as recom-mended by WHO [28].
Asthma medication. The subjects' use of ICS, combination ICS/ long-acting beta-agonists
(LABA) and/or LTRA during the last three months was recorded in the interview. The pre-scribed daily dose of ICS was also collected from the subjects' medical records.
Statistical analysis
Categorical variables were described using percentages, and differences between groups were studied with theχ2test. Continuous variables that were normally distributed were described
using means and standard error of the mean (SEM), and the t-test was used to compare means. If continuous variables had a distribution skewed to the right (e. g. FeNO), a geometric mean with a 95% confidence interval was used for descriptive statistics, and logarithm-transformation was performed before group comparisons. The PD20was described using median and
inter-quartile range, and the Mann-Whitney test was used to compare groups. Single and multiple lo-gistic regression models were used to assess odds ratios for having not well-controlled asthma (ACT<20). Single and multiple linear regression models were used to study differences in Mini-AQLQ in subjects with food hypersensitivity and different patterns of IgE sensitization, compared with subjects without food hypersensitivity. Age, sex, BMI, FEV1, FeNO, total IgE,
current dose of ICS, current use of ICS/LABA and current smoking were adjusted for in multi-ple regression models.
Ethics
Written informed consent was obtained from each subject, and from parents of subjects below 18 years of age, before inclusion in the study. The study was approved by the Regional Ethics Committee in Uppsala, Sweden (2009/349).
Results
Patient characteristics in relation to control subjects
Asthmatic subjects had lower values of FEV1, and higher levels of FeNO than controls (Table 1).
They also had higher levels of B-Eos, were more often sensitized to both food allergens and aero-allergens, and were more likely to report perceived food hypersensitivity reactions.
Prevalence of perceived food hypersensitivity in relation to food allergen
sensitization
Food hypersensitivity in asthmatics was most frequently reported to hazelnuts, peanuts, and cow’s milk (Table 2). The food allergen sensitizations most frequently found were against
Table 1. Asthmatics and controls, demographics.
Asthmatics (n = 408) Controls (n = 118)
Age (years)1 20.4±0.3 20.5±0.6
Female (%) 51 55
FEV1(% pred) 92±0.7*** 97±1.3
FeNO (ppb)2 15.7 (14.6–16.9)
*** 12.4 (11–13.9) Eosinophils (109/L)2 0.18 (0.17–0.2)
*** 0.12 (0.10–0.14)
ACT1 20.5±0.2
-Mini-AQLQ-score1 5.8±0.05
-Food allergen sensitization (%) 62*** 22
Aeroallergen sensitization (%) 79*** 33
Perceived food hypersensitivity (%) 53*** 15
1Mean±SEM,
2Geometric mean (95% CI), ***p<0.001
doi:10.1371/journal.pone.0124675.t001
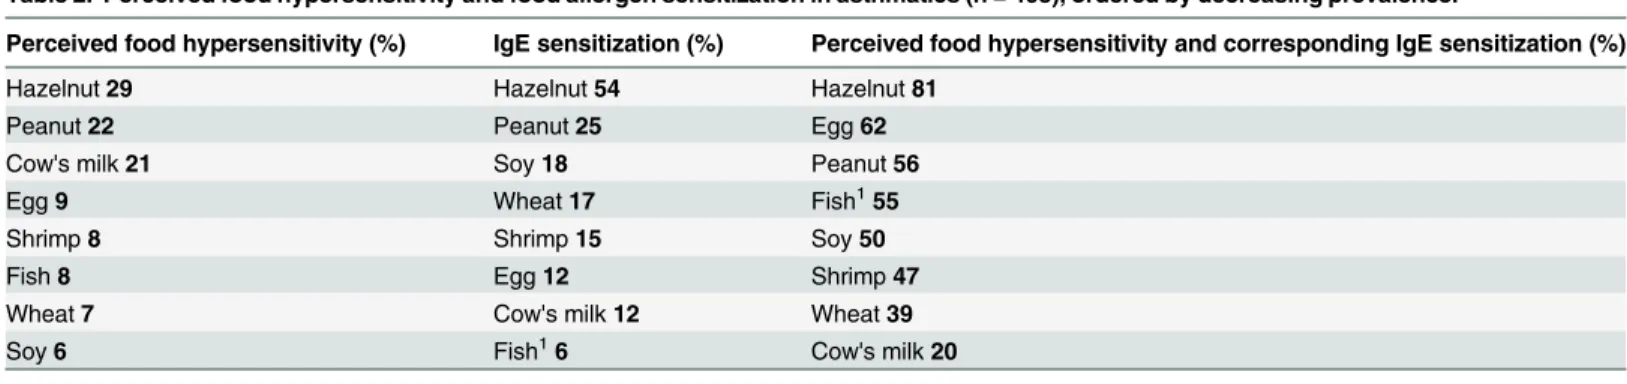
Table 2. Perceived food hypersensitivity and food allergen sensitization in asthmatics (n = 408), ordered by decreasing prevalence.
Perceived food hypersensitivity (%) IgE sensitization (%) Perceived food hypersensitivity and corresponding IgE sensitization (%)
Hazelnut29 Hazelnut54 Hazelnut81
Peanut22 Peanut25 Egg62
Cow's milk21 Soy18 Peanut56
Egg9 Wheat17 Fish155
Shrimp8 Shrimp15 Soy50
Fish8 Egg12 Shrimp47
Wheat7 Cow's milk12 Wheat39
Soy6 Fish16 Cow's milk20
The third column shows the percentage of perceived food hypersensitivity where a corresponding IgE sensitization was found. 1IgE sensitization to cod
fish
hazelnut, peanut and soy. Concordance between reported food hypersensitivity and food aller-gen sensitization was most frequently found for reactions to hazelnut, egg and peanut.
Symptoms of perceived food hypersensitivity in relation to IgE
sensitization
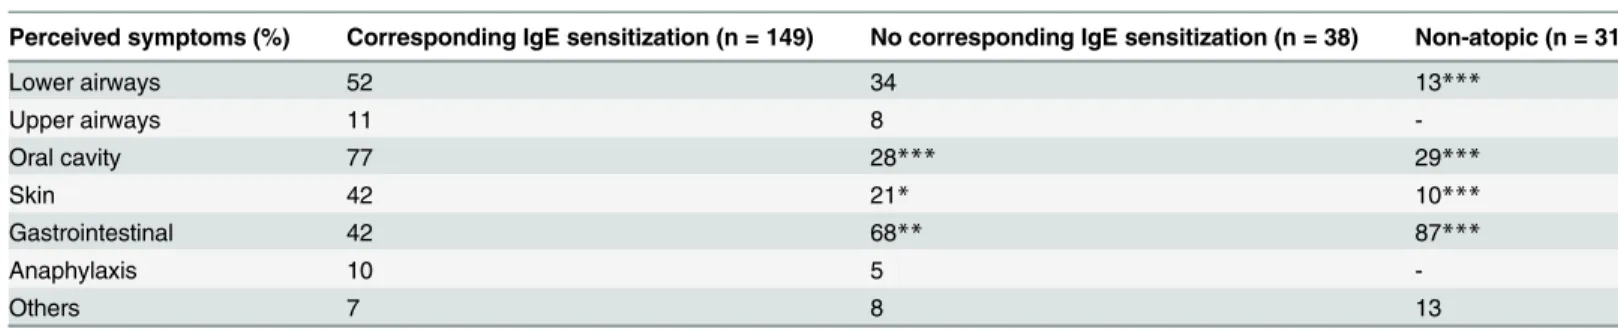
Asthmatics with perceived food hypersensitivity were divided into three groups, depending on their IgE sensitization status (Fig 1). Upon food intake, symptoms from the oral cavity and the skin were more prevalent among subjects with at least one corresponding food allergen sensiti-zation than among subjects from the two other groups reporting food hypersensitivity
(Table 3). Gastrointestinal symptoms, on the other hand, were less prevalent in subjects with a
corresponding food allergen sensitization. Non-atopic subjects with perceived food hypersensi-tivity had lower prevalence of symptoms from the lower airways associated to food consump-tion than subjects with a corresponding food allergen sensitizaconsump-tion (Table 3).
Asthma characteristics in relation to perceived food hypersensitivity and
IgE sensitization
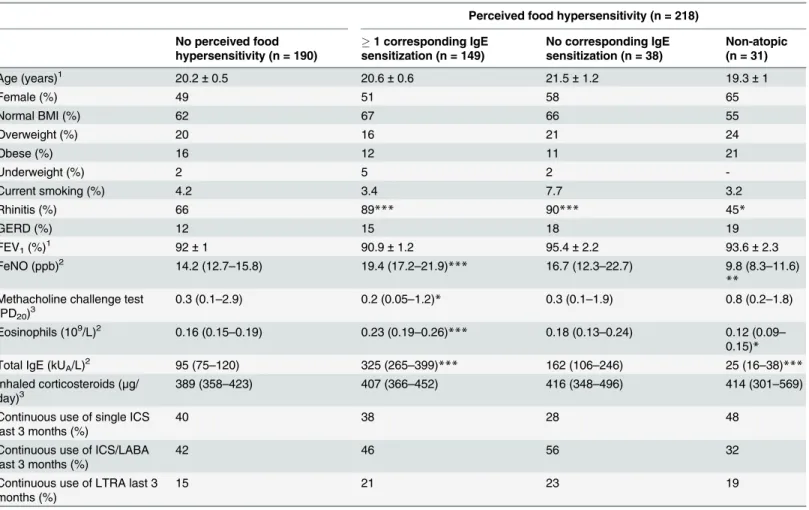
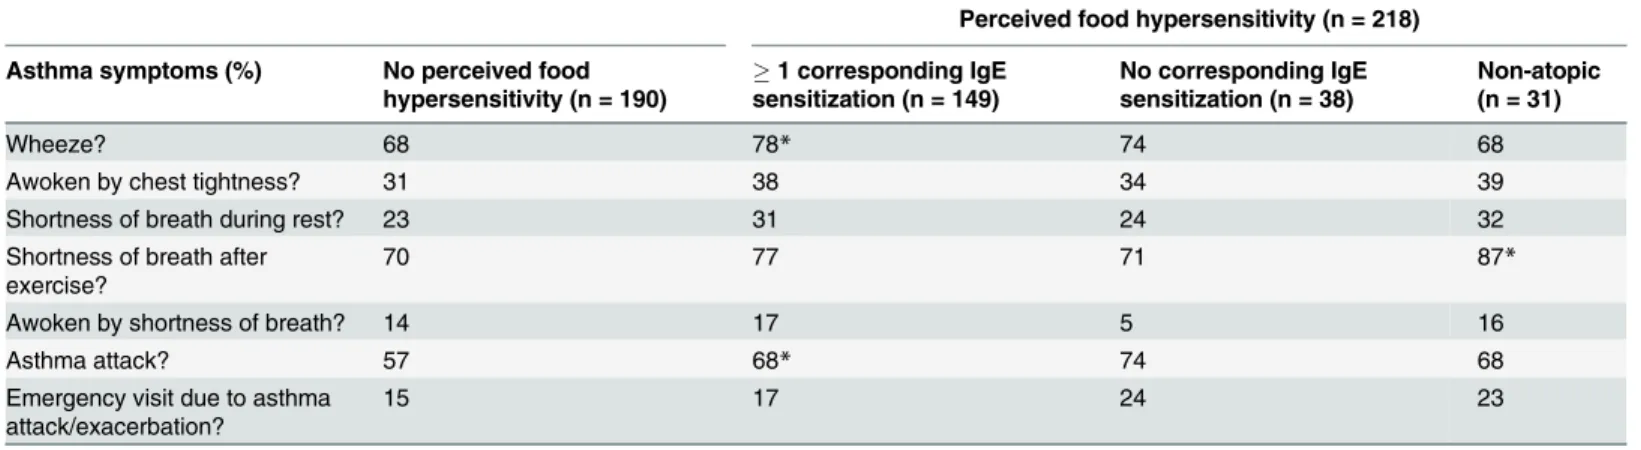
Univariate analyses. Subjects with perceived food hypersensitivity and at least one
corre-sponding food allergen sensitization had higher levels of FeNO, B-Eos and total IgE than sub-jects without any perceived food hypersensitivity (Table 4). The former group also reported more episodes of wheeze and asthma attacks in the past 12 months (Table 5). For atopic sub-jects with perceived food hypersensitivity without any corresponding food allergen sensitiza-tion, no such differences were seen. Non-atopic subjects with perceived food hypersensitivity had lower levels of FeNO, B-Eos and total IgE than those without perceived food hypersensitiv-ity. Non-atopic subjects without perceived food hypersensitivity had lower levels of FeNO, B-Eos and total IgE when compared to atopic subjects within the same group (data not shown).
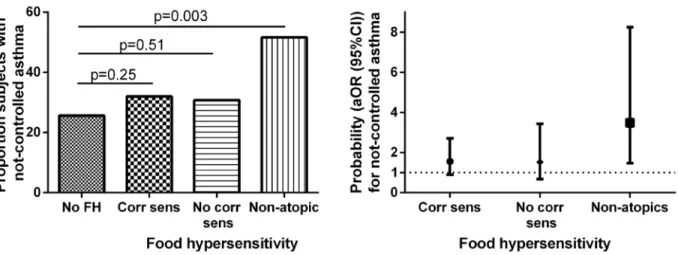
Non-atopic subjects with perceived food hypersensitivity scored lower on the ACT (Fig 2,
S1 Table), and had higher prevalence of not well-controlled asthma (Fig 3A) than subjects
without perceived food hypersensitivity. Non-atopic subjects with perceived food hypersensi-tivity scored lower on overall Mini-AQLQ (Fig 2,S1 Table), as well as on all four domains of
Table 3. Perceived symptoms associated with food consumption (%) among asthmatics.
Perceived food hypersensitivity (n = 218)
Perceived symptoms (%) Corresponding IgE sensitization (n = 149) No corresponding IgE sensitization (n = 38) Non-atopic (n = 31)
Lower airways 52 34 13***
Upper airways 11 8
-Oral cavity 77 28*** 29***
Skin 42 21* 10***
Gastrointestinal 42 68** 87***
Anaphylaxis 10 5
-Others 7 8 13
The group with at least one corresponding food allergen sensitization is used as a control group. All p-values refer to comparisons between this group and the others.
*p<0.05,
**p<0.01,
***p<0.001
the Mini-AQLQ (data not shown), than subjects without perceived food hypersensitivity. Among those without perceived food hypersensitivity, no difference was found between non-atopic and non-atopic subjects in ACT or Mini-AQLQ scores (S2 Table). Non-atopic subjects with food hypersensitivity had lower ACT and Mini-AQLQ scores as compared to atopic subjects with food hypersensitivity. Furthermore, a trend towards lower ACT score and a lower Mini-AQLQ score were found in non-atopic subjects with food hypersensitivityvsatopic subjects
with food hypersensitivity, while no differences in ACT or Mini-AQLQ scores were found in similar analyses in atopic subjects comparing subjects with and without food hypersensitivity
(S2 Table).
Multivariate analyses. The probability of having not well-controlled asthma was 3.1
(1.4–6.7) (OR (95% CI)) times higher in the non-atopic group with perceived food hypersen-sitivity than in the group with no perceived food hypersenhypersen-sitivity. This relation was consistent
Table 4. Asthmatics with and without perceived food hypersensitivity, divided by IgE sensitization status, demographics.
Perceived food hypersensitivity (n = 218)
No perceived food hypersensitivity (n = 190)
1 corresponding IgE sensitization (n = 149)
No corresponding IgE sensitization (n = 38)
Non-atopic (n = 31)
Age (years)1 20.2±0.5 20.6±0.6 21.5±1.2 19.3±1
Female (%) 49 51 58 65
Normal BMI (%) 62 67 66 55
Overweight (%) 20 16 21 24
Obese (%) 16 12 11 21
Underweight (%) 2 5 2
-Current smoking (%) 4.2 3.4 7.7 3.2
Rhinitis (%) 66 89*** 90*** 45*
GERD (%) 12 15 18 19
FEV1(%)1 92±1 90.9±1.2 95.4±2.2 93.6±2.3
FeNO (ppb)2 14.2 (12.7–15.8) 19.4 (17.2–21.9)*** 16.7 (12.3–22.7) 9.8 (8.3–11.6) **
Methacholine challenge test
(PD20)3 0.3 (0.1–2.9) 0.2 (0.05–1.2)* 0.3 (0.1–1.9) 0.8 (0.2–1.8)
Eosinophils (109/L)2 0.16 (0.15–0.19) 0.23 (0.19–0.26)*** 0.18 (0.13–0.24) 0.12 (0.09– 0.15)*
Total IgE (kUA/L)2 95 (75–120) 325 (265–399)*** 162 (106–246) 25 (16–38)***
Inhaled corticosteroids (μg/
day)3 389 (358–423) 407 (366–452) 416 (348–496) 414 (301–569)
Continuous use of single ICS last 3 months (%)
40 38 28 48
Continuous use of ICS/LABA last 3 months (%)
42 46 56 32
Continuous use of LTRA last 3 months (%)
15 21 23 19
All p-values refer to comparisons between the group without perceived food hypersensitivity and the others. 1Mean±SEM,
2Geometric mean (95% CI), 3Median (IQR),
*p<0.05,
**p<0.01,
***p<0.001
(3.5 (1.5–8.3)) after adjusting for age, sex, BMI, FEV1, FeNO, total IgE, current dose of ICS,
current use of ICS/LABA and current smoking (Fig 3B). The results regarding lower Mini-AQLQ—scores in non-atopic subjects with perceived food hypersensitivity, as compared with those without perceived food hypersensitivity, were also consistent after adjustments for the same factors as above: the mean differences being 0.77 (0.39–1.15) for overall Mini-AQLQ, 0.96 (0.46–1.3) for symptoms domain, 0.74 (0.35–1.13) for activity limitation, 0.66 (0.12– 1.20) for emotional function, and 0.63 (0.14–1.13) for environmental stimuli. After adjust-ments, atopic subjects without any corresponding food allergen sensitization had a lower envi-ronmental domain score, mean difference 0.72 (0.27–1.16), than those without perceived food hypersensitivity.
Table 5. Asthmatics with and without perceived food hypersensitivity, divided by IgE sensitization status.
Perceived food hypersensitivity (n = 218)
Asthma symptoms (%) No perceived food hypersensitivity (n = 190)
1 corresponding IgE sensitization (n = 149)
No corresponding IgE sensitization (n = 38)
Non-atopic (n = 31)
Wheeze? 68 78* 74 68
Awoken by chest tightness? 31 38 34 39
Shortness of breath during rest? 23 31 24 32
Shortness of breath after exercise?
70 77 71 87*
Awoken by shortness of breath? 14 17 5 16
Asthma attack? 57 68* 74 68
Emergency visit due to asthma
attack/exacerbation? 15 17 24 23
Asthma symptoms in past 12 months. All p-values refer to comparisons between the group without perceived food hypersensitivity and the others. *p<0.05
doi:10.1371/journal.pone.0124675.t005
Fig 2. Mini-AQLQ- and ACT-scores in relation to perceived food hypersensitivity and IgE sensitization status.
Discussion
Approximately half of the investigated young asthmatics reported food hypersensitivity, and a corresponding food allergen sensitization was found in a majority of them. There were large variations for different foods in concordance between perceived food hypersensitivity and food allergen sensitization. Differences in perceived symptoms upon food intake were found be-tween subjects with and without corresponding food allergen sensitization. A novel and clini-cally important finding of the present study was that non-atopic subjects with perceived food hypersensitivity, despite having lower levels of FeNO and B-Eos, had poorer asthma control, were more likely to have not well-controlled asthma, and had lower asthma-related quality of life than those without perceived food hypersensitivity. Subjects with perceived food hypersen-sitivity and at least one corresponding food allergen sensitization had similar levels of asthma control and asthma-related quality of life as those without perceived food hypersensitivity, de-spite having higher levels of the above mentioned inflammation markers.
Both food allergen sensitization and perceived food hypersensitivity were more common among asthmatic subjects than controls. The prevalence of perceived food hypersensitivity among control subjects in our study (15%) corresponds well to prevalence rates found in earlier population-based surveys [1–3], while the prevalence rate for asthmatics was much higher (53%). In a pediatric asthma cohort, physician-diagnosed food allergy, which included only IgE-mediated allergic reactions, was present in 24% of asthmatic children [6].
A large proportion of subjects with perceived food hypersensitivity had corresponding IgE sensitization, although the percentage of concordance between perceived symptoms and de-tectable IgE antibodies differed between foods. The highest concordances were found for hazel-nut, egg and peanut. The high rate of IgE sensitization to hazelnut found in our study can to a large extent be explained by cross-reactivity to birch pollen [29], since the study took place in a region with frequent birch-pollen sensitization. This is also true for IgE sensitization to peanut, where cross-reactivity occur between Ara h 8 and Cor a 1. There is an association between IgE sensitization and allergy to egg early in life, and development of respiratory allergic disease some years later [30]. In a Swedish birth-cohort study, self-reported symptoms caused by
Fig 3. Proportion of subjects with not well-controlled asthma (Panel A) and adjusted odds ratios (age, sex, BMI, FEV1, levels of FeNO, total IgE,
current dose of ICS, current use of ICS/LABA, and current smoking) (Panel B) for not well-controlled asthma in relation to perceived food hypersensitivity and IgE sensitization.
peanut were closely associated to IgE sensitization to peanut among 4-year-old children [4]. Sensitization to hazelnut was not investigated in this birth-cohort study.
Symptoms from the lower airways, the oral cavity, and the skin were more frequently re-ported among subjects with at least one corresponding food allergen sensitization than among non-atopic subjects. The opposite was true for symptoms from the gastrointestinal tract, which were more frequently reported among non-atopic subjects. Non-IgE-mediated food reactions seem to primarily affect the gastrointestinal tract [31]. Since many of the perceived food hyper-sensitivity reactions in this study were reactions to cow’s milk, we could not exclude that these reactions were to some extent due to lactose intolerance. The prevalence of lactose intolerance is, however, lower in Sweden than in other parts of the world [32].
To our knowledge, the relationship between perceived food hypersensitivity in non-atopic asthmatics and impaired asthma control and asthma-related quality of life, has not been re-ported before. The relationship between perceived food hypersensitivity, asthma control and asthma-related quality of life has not been well studied, although the presence of food allergy has been linked to increasing asthma severity [7–14]. American children with confirmed food allergy exhibit health-related quality of life (HRQL) scores below the national average [33]. In a Swedish birth-cohort study, 9-year old children with reported food hypersensitivity were found to score lower on some HRQL subscales, as compared to children with other allergic dis-eases (asthma, eczema or rhinitis) [34].
Subjects with perceived food hypersensitivity and corresponding food allergen sensitization had higher levels of local and systemic markers of Th2-driven inflammation. This corresponds to previous results from the same patient material, where IgE sensitization to food allergens was recently found to affect both local and systemic markers of inflammation in asthma [18]. A discrepancy between increasing levels of inflammation markers and subjectively perceived asthma control was found. Discrepancies between patient perceptions and objective ratings of asthma severity have previously been described [35–37], and may in part be explained by dif-ferences in personality [37–39]. In our cohort, overall levels of both local and systemic inflam-mation markers were relatively low, indicating a well-treated asthma population.
The strength of the present study is the inclusion of asthma patients from both primary and specialist care. Inclusion of age- and sex-matched controls has allowed comparison of preva-lence of food hypersensitivity and food allergen sensitization between asthmatics and the gen-eral population. A further strength is the large study material, which has allowed subgrouping and comparisons between groups. We acknowledge the limitation of perceived food hypersen-sitivity, as differences exist between perceived symptoms and objectively confirmed food hypersensitivity [40–42]. The main objective of this study was, however, to focus on patient perceptions of food hypersensitivity, asthma control and asthma-related quality of life. Another limitation of perceived food hypersensitivity may be the reporting of gastrointestinal symp-toms. These symptoms can be unspecific and related to other causes than food hypersensitivity, such as irritable bowel syndrome, indigestion or gastrointestinal infections. Any of these gas-trointestinal disorders may lead to decreased ACT- score or quality of life. However, this is a less likely explanation as few individuals reported these conditions in the questionnaires or in-terviews. A third limitation of the present study is that subjects were asked to report if they had
everexperienced symptoms associated with food consumption. This could include episodes in
early childhood. The discrepancy between perceived food hypersensitivity and food allergen sensitization may thus in part be explained by development of tolerance to food allergens [43]. Unfortunately, we also lack information on whether subjects with perceived food hypersensi-tivity are currently consuming the suspected food stuff or not.
sensitization. Clinical manifestations of perceived food hypersensitivity differed with the pres-ence or abspres-ence of corresponding food allergen sensitization. This is the first report of a rela-tionship between perceived food hypersensitivity, impaired asthma control and asthma-related quality of life in non-atopic asthmatics. This was despite lower levels of inflammation, as as-sessed by levels of FeNO and B-Eos. Food hypersensitivity in non-atopic asthma should be mapped further regarding other inflammatory mechanisms, and asthma management of these patients should be reassessed as they appear to have low levels of Th2-related inflammation.
Supporting Information
S1 Table. Asthma control (ACT) and asthma-related quality of life (Mini-AQLQ, total score and score for different domains), presented as median (range), in relation to per-ceived food hypersensitivity and IgE sensitization status.
(DOCX)
S2 Table. ACT and Mini-AQLQ scores (mean values ± SEM) for atopic asthmatics and non-atopic asthmatics, with and without perceived food hypersensitivity.
(DOCX)
Acknowledgments
We thank all subjects for their participation. We wish to thank the research nurses Pia Kalm-Stephens and Katarina Nisser, as well as the research engineers Helene Lettesjö and Britt-Inger Nyberg, for performing the clinical visits and analyses of blood samples.
Author Contributions
Conceived and designed the experiments: MPB LN CJ KA AM. Analyzed the data: JJ. Contrib-uted reagents/materials/analysis tools: MPB LN JL CJ KA AM. Wrote the paper: JJ MPB LN JL CJ KA AM.
References
1. Altman DR, Chiaramonte LT (1996) Public perception of food allergy. J Allergy Clin Immunol 97: 1247– 1251. PMID:8648020
2. Schäfer T, Böhler E, Ruhdorfer S, Weigl L, Wessner D, Heinrich J et al. (2001) Epidemiology of food al-lergy/food intolerance in adults: associations with other manifestations of atopy. Allergy 56: 1172– 1179. PMID:11736746
3. Woods RK, Abramson M, Bailey M, Walters EH (2001) International prevalences of reported food aller-gies and intolerances. Comparisons arising from the European Community Respiratory Health Survey 1991–1994. Eur J Clin Nutr 55: 298–304. PMID:11360135
4. Ostblom E, Wickman M, van Hage M, Lilja G (2008) Reported symptoms of food hypersensitivity and sensitization to common foods in 4-year-old children. Acta Paediatr 97: 85–90. PMID:18076724 5. McGowan EC, Keet CA (2013) Prevalence of self-reported food allergy in the National Health and
Nutri-tion ExaminaNutri-tion Survey (NHANES) 2007–2010. J Allergy Clin Immunol 132: 1216–1219. doi:10. 1016/j.jaci.2013.07.018PMID:23992749
6. Keet CA, Savage JH, Seopaul S, Peng RD, Wood RA, Matsui EC (2014) Temporal trends and racial/ ethnic disparity in self-reported pediatric food allergy in the United States. Ann Allergy Asthma Immunol 112: 222–229. doi:10.1016/j.anai.2013.12.007PMID:24428971
7. Friedlander JL, Sheehan WJ, Baxi SN, Kopel LS, Gaffin JM, Ozonoff A et al. (2013) Food allergy and in-creased asthma morbidity in a school-based inner-city asthma study. J Allergy Clin Immunol Pract 1: 479–484. PMID:24058900
9. Simpson AB, Yousef E, Hossain J (2010) Association between peanut allergy and asthma morbidity. J Pediatr 156: 777–781. doi:10.1016/j.jpeds.2009.11.080PMID:20152991
10. Berns SH, Halm EA, Sampson HA, Sicherer SH, Busse PJ, Wisnivesky JP (2007) Food allergy as a risk factor for asthma morbidity in adults. J Asthma 44: 377–381. PMID:17613633
11. Liu AH, Jaramillo R, Sicherer SH, Wood RA, Bock SA, Burks AW et al (2010) National prevalence and risk factors for food allergy and relationship to asthma: Results from the National Health and Nutrition Examination Survey 2005–2006. J Allergy Clin Immunol 126: 798–806. doi:10.1016/j.jaci.2010.07. 026PMID:20920770
12. Roberts G, Patel N, Levi-Schaffer F, Habibi P, Lack G (2003) Food allergy as a risk factor for life-threat-ening asthma in childhood: A case-controlled study. J Allergy Clin Immunol 112: 168–174. PMID: 12847494
13. Roberts G, Lack G (2003) Food allergy and asthma—what’s the link? Pediatr Respir Reviews 4: 205– 212.
14. Wang J, Visness CM, Sampson HA (2005) Food allergen sensitisation in inner-city children with asth-ma. J Allergy Clin Immunol 115: 1076–1080. PMID:15867869
15. Bjornsson E, Janson C, Plaschke P, Norrman E, Sjoberg O (1996) Prevalence of sensitization to food allergens in adult Swedes. Ann Allergy Asthma Immunol 77: 327–332. PMID:8885811
16. Kulkarni N, Ragazzo V, Costella S, Piacentini G, Boner A, O’Callaghan C et al. (2012) Eosinophilic air-way inflammation is increased in children with asthma and food allergies. Pediatr Allergy Immunol 23: 28–33. doi:10.1111/j.1399-3038.2011.01226.xPMID:22104024
17. Patelis A, Gunnbjörnsdottir M, Malinovschi A, Matsson P, Önell A, Högman M et al. (2012) Population-based study of multiplexed IgE sensitization in relation to asthma, exhaled nitric oxide, and bronchial re-sponsiveness. J Allergy Clin Immunol 130: 397–402. doi:10.1016/j.jaci.2012.03.046PMID:22633327 18. Patelis A, Janson C, Borres MP, Nordvall L, Alving K, Malinovschi A (2014) Aeroallergen and food IgE
sensitization and local and systemic inflammation in asthma. Allergy 69: 380–387. doi:10.1111/all. 12345PMID:24397423
19. Gergen PJ, Arbes SJ, Calatroni A, Mitchell HE, Zeldin DC (2009) Total IgE levels and asthma preva-lence in the US population: Results from the National Health and Nutrition Examination Survey 2005– 2006. J Allergy Clin Immunol 124: 447–453. doi:10.1016/j.jaci.2009.06.011PMID:19647861 20. Heijkenskjöld-Rentzhog C, Nordvall L, Janson C, Borres MP, Alving K, Malinovschi A (2014) Alveolar
and exhaled NO in relation to asthma characteristics—effects of correction for axial diffusion. Allergy 69:1102–1111. doi:10.1111/all.12430PMID:24894594
21. ATS/ERS recommendations for standardized procedures for the online and offline measurement of ex-haled lower respiratory nitric oxide and nasal nitric oxide, 2005. Am J Respir Crit Care Med 171: 912– 930. PMID:15817806
22. Pellegrino R, Viegi G, Brusasco V, Crapo RQ, Burgos F, Casaburi R et al. (2005) Interpretative strate-gies for lung function tests. Eur Respir J 26: 948–968. PMID:16264058
23. Hagmolen of ten Have W, van den Berg NJ, van der Palen J, Bindels PJ, van Aalderen WM (2005) Vali-dation of a single concentration methacholine inhalation provocation test (SCIPT) in children. J Asthma 42: 419–423. PMID:16293536
24. Nathan RA, Sorkness CA, Kosinski M, Schatz M, Li JT, Marcus P et al. (2004) Development of the Asthma Control Test: a survey for assessing asthma control. J Allergy Clin Immunol 113: 59–65. PMID:14713908
25. Juniper EF, Guyatt GH, Cox FM, Ferrie PJ, King DR (1999) Development and validation of the Mini Asthma Quality of Life Questionnaire. Eur Respir J 14: 32–38. PMID:10489826
26. Sundbom F, Lindberg E, Bjerg A, Forsberg B, Franklin K, Gunnbjornsdottir M et al. (2013) Asthma symptoms and nasal congestion as independent risk factors for insomnia in a general population: Re-sults from the ga(2)len survey. Allergy 68: 213–219. doi:10.1111/all.12079PMID:23176562 27. Emilsson OI, Bengtsson A, Franklin KA, Toren K, Benediktsdottir B, Farkhooy A et al. (2013) Nocturnal
gastro-oesophageal reflux, asthma and symptoms of osa: A longitudinal, general population study. Eur Respir J 41: 1347–1354. doi:10.1183/09031936.00052512PMID:23018910
28. WHO | bmi-for-age (5–19 years). World Health Organization: World Health Organization; 2010. 29. Hirschwehr R, Valenta R, Ebner C, Ferreira F, Sperr WR, Valent P et al. (1992) Identification of
com-mon allergenic structures in hazel pollen and hazelnuts: a possible explanation for sensitivity to hazel-nuts in patients allergic to tree pollen. J Allergy Clin Immunol 90: 927–936. PMID:1281178
31. Jyonouchi H (2008) Non-IgE mediated food allergy. Inflamm Allergy Drug Targets 7: 173–180. PMID: 18782024
32. Vuorisalo T, Arjamaa O, Vasemägi A, Taavitsainen JP, Tourunen A, Saloniemi I (2012) High lactose tolerance in North Europeans: a result of migration, not in situ milk consumption. Perspect Biol Med 55: 163–174. doi:10.1353/pbm.2012.0016PMID:22643754
33. Sicherer S, Noone S, Muñez-Furlong A (2001) The impact of childhood food allergy on quality of life.
Ann Allergy Asthma Immunol 87: 461–464. PMID:11770692
34. Östblom E, Egmar A-C, Gardulf A, Lilja G, Wickman M (2008) The impact of food hypersensitivity re-ported in 9-year-old children by their parents on health-related quality of life. Allergy 63: 211–218. doi: 10.1111/j.1398-9995.2007.01559.xPMID:18186811
35. Rubinfeld AR, Pain MC (1976) Perception of asthma. Lancet 7965: 882–884. PMID:58147 36. Nguyen BP, Wilson SR, German DF (1996) Patients’perceptions compared with objective ratings of
asthma severity. Ann Allergy Asthma Immunol 77: 209–215. PMID:8814046
37. Put C, Demedts M, Van Den Bergh O, Demyttenaere K, Verleden G (1999) Asthma symptoms: influ-ence of personality versus clinical status. Eur Respir J 13: 751–756. PMID:10362035
38. Axelsson M, Emilsson M, Bring E, Lundgren J, Torén K, Lotvall J (2009) Personality, adherence, asth-ma control, and health-related quality of life in young adult asthasth-matics. Respir Med 103: 1033–1040. doi:10.1016/j.rmed.2009.01.013PMID:19217764
39. Van De Ven MO, Engels RC (2011) Quality of life of adolescents with asthma: the role of personality, coping strategies, and symptom reporting. J Psychosom Res 71: 166–173. doi:10.1016/j.jpsychores. 2011.03.002PMID:21843752
40. Roehr CC, Edenharter G, Reimann S, Ehlers I, Worm M, Zuberbier T et al. (2004) Food allergy and non-allergic food hypersensitivity in children and adolescents. Clin Exp Allergy 34: 1534–1541. PMID: 15479267
41. Osterballe M, Hansen TK, Mortz CG, Host A, Bindslev-Jensen C (2005) The prevalence of food hyper-sensitivity in an unselected population of children and adults. Pediatr Allergy Immunol 16: 567–573. PMID:16238581
42. Pereira B, Venter C, Grundy J, Clayton B, Arshad SH, Dean T (2005) Prevalence of sensitisation to food allergens, reported adverse reactions to foods, food avoidance, and food hypersensitivity among teenagers. J Allergy Clin Immunol 116: 884–892. PMID:16210065