www.atmos-chem-phys.net/7/5275/2007/ © Author(s) 2007. This work is licensed under a Creative Commons License.
Chemistry
and Physics
Observation of Polar Stratospheric Clouds down to the
Mediterranean coast
P. Keckhut1, Ch. David1, M. Marchand1, S. Bekki1, J. Jumelet1, A. Hauchecorne1, and M. H¨opfner2
1Service d’A´eronomie, Institut Pierre Simon Laplace, B.P. 3, 91371, Verri`eres-le-Buisson, France 2Forschungszentrum Karlsruhe, Institut f¨ur Meteorologie und Klimaforschung, Karlsruhe, Germany
Received: 8 March 2007 – Published in Atmos. Chem. Phys. Discuss.: 15 May 2007 Revised: 5 October 2007 – Accepted: 6 October 2007 – Published: 12 October 2007
Abstract. A Polar Stratospheric Cloud (PSC) was detected for the first time in January 2006 over Southern Europe af-ter 25 years of systematic lidar observations. This cloud was observed while the polar vortex was highly distorted during the initial phase of a major stratospheric warming. Very cold stratospheric temperatures (<190 K) centred over the Northern-Western Europe were reported, extending down to the South of France where lidar observations were per-formed. CTM (Chemical Transport Model) investigations show that this event led to a significant direct ozone destruc-tion (35 ppb/day), within and outside the vortex as chlorine activated air masses were moved to sunlight regions allow-ing ozone destruction. If such exceptional events of mid-latitudes PSCs were to become frequent in the future, they should not compromise the ozone recovery because their ef-fect appears to be limited temporally and spatially. More importantly, these events might tend to be associated with the initial phase of a stratospheric warming that results into a weakening and warming of the polar vortex and hence into a reduced probability occurrence of PSC temperatures during the rest of the winter.
1 Introduction
Following the Montreal Protocol (1987) and its successive amendments, production and emissions of the anthropogenic halogenated ozone-depleting gases have been strongly regu-lated (WMO, 1999). So, while the stratospheric abundance of these gases is decreasing slowly in the stratosphere, the “ozone layer” is expected to recover, all other factors remain-ing constant (Chipperfield et al., 2005; Austin and Wilson, 2006). The main uncertainty about the ozone evolution lies with simultaneous climate changes. On a global scale, strato-Correspondence to:P. Keckhut
spheric temperatures are expected to cool down due to ozone depletion, but also to the increase in the concentrations of greenhouse gases. Such findings are already reported and simulated (Ramaswamy et al., 2001), although trends are less clear at high latitudes due to a larger natural variability and potential dynamical feedback. Nearly twenty years after the signing of the Montreal Protocol, the timing and extent of the ozone recovery is uncertain. A major link between climate conditions and ozone loss originates from Polar Stratospheric Clouds (PSC) that form in a cold stratosphere and results in ozone destruction through heterogeneous chemical reactions (Crutzen and Arnold, 1986). PSCs are responsible for the conversion of the halogen reservoir species into active ozone destroying radicals (Cl, ClO, BrO). They usually form within the polar vortex during wintertime. The frequency and the altitude of occurrence of these clouds can be monitored by lidar operating continuously in polar regions, such as those deployed within the frame of the Network for the Detection of Atmospheric Composition Changes (NDACC).
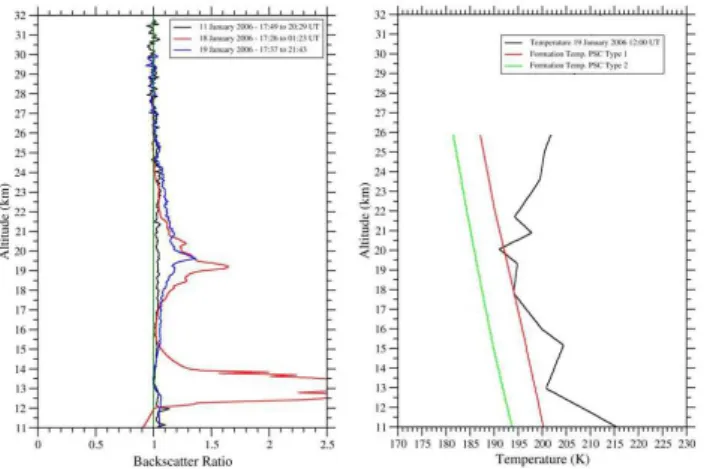
Fig. 1. Lidar backscatter ratio and collocated radiosonde temper-ature profile. (a)Lidar backscatter ratio profiles measured at the Observatory of Haute-Provence on 11 January 2006 showing typi-cal background aerosol signature and on 18 and 19 January.
already intensively used to quantify polar ozone depletion. In the second section, these lidar observations are described. Then, the background conditions are analysed in the third section. In a fourth section, the impact of this PSC event on ozone is evaluated using a chemistry-transport model. Fi-nally, the formation conditions of this cloud and the potential consequences on ozone recovery of this type of event are dis-cussed.
2 Lidar observations
The principle of the lidar is similar to the radar, except that optical wavelengths are used. Remote sensing of particles with lidar with only one detection channel gives access to high-resolution vertical profiles of their optical properties but not to their microphysical characteristics. The wave-length has to be chosen outside the main absorption bands of the atmospheric constituents. The traditional quantity de-rived from the combined Mie and Rayleigh components of the lidar signal is the backscatter ratio, which is the ratio of the total backscatter coefficient (light scattered at 180◦of
the emission beam by both molecules and particles) to the molecular backscattered coefficient (light scattered at 180◦
by molecules only). Thus, a backscatter ratio greater than one indicates the presence of particles (Russell et al., 1979) and its amplitude can be related to the composition and the size distribution of the particles.
Two major classes of particles are observed in the strato-sphere: sulfuric acid aerosols, present at all latitudes throughout the year (background aerosols) (Junge et al., 1961; Turco et al., 1982) and periodically enhanced by vol-canic eruptions, and Polar Stratospheric Clouds (PSC) which form in polar regions, during both austral and boreal winters, when stratospheric temperatures fall below 195 K typically
(McCormick et al., 1982; Turco et al., 1989). From previ-ous lidar observations, the expected range of backscatter ra-tio values for the different PSC types (nitric acid containing clouds are Type 1 and water ice clouds are Type 2) is known (Poole and McCormick, 1988; Toon et al., 1990; David et al., 1998).
Backscatter lidar observations of stratospheric particles are conducted over the Observatory of Haute-Provence (OHP – 44◦N, 5◦E) since the 1980’s, within the frame of the
NDACC. The operating wavelength is 532 nm and backscat-ter ratio profiles between about 8 and 35 km are acquired 3 to 4 times a week, for several hours during nighttime and aver-aged to obtain a daily profile. The uncertainties never exceed 7% on average (Chazette et al., 1995). Beyond stratospheric particles measurements, the instrument is also used to study cirrus clouds (Goldfarb et al., 2000; Keckhut et al., 2006).
In January 2006, we found for the first time, the occur-rence of typical PSC signals on lidar observations at the OHP. On Fig. 1, backscatter ratio profiles obtained on 18 January and 19 January 2006 are compared to a typical back-ground aerosols profile acquired on 11 January 2006. The backscatter ratio signatures detected on 18 January and 19 January were clearly different from the background aerosols signature. The peak values of the backscatter ratio were located at 19.2 km and 19.6 km respectively, which is too high for a cirrus cloud (besides, a cirrus was also observed at 13 km on 18 January). The maximum of backscatter ra-tio on both days were about 1.5 and the vertical extension of the clouds reached more 5 km (between roughly 17 and 22–24 km). There is no depolarization measurements to in-form us about the cloud phase. However, the cloud char-acteristics (small backscatter ratio, cloud geometrical depth, temperature conditions) suggest that the observed clouds are Type 1 PSCs (David et al., 1997; David et al., 1998), prob-ably Type 1b composed of liquid ternary solution droplets of H2SO4/HNO3/H2O (Tabazadeh et al., 1994; Carslaw et
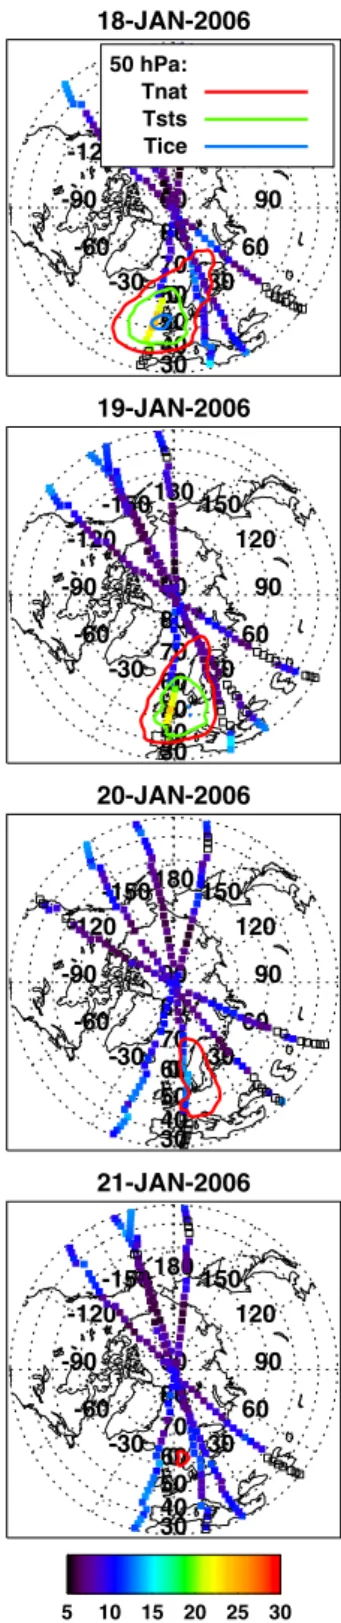
al., 1994). Yet, if Type 2 PSCs can definitely be excluded, only depolarisation could allow us to distinguish definitely between Type Ia and Type 1b in our observations. This ground-based Lidar detection of Polar Stratospheric Clouds at mid-latitudes have been confirmed by global measure-ments with the Michelson Interferometer for Passive Atmo-spheric Sounding (MIPAS) on Envisat. The mid-infrared limb-emission measurements had already been analyzed dur-ing the Antarctic winter 2003 with respect to PSC compo-sition with coincident Lidar observations from Mc-Murdo (Hopfner et al., 2006). The top heights of the PSCs can be derived from MIPAS observations for the days 18 to 21 January 2006 (Fig. 2). MIPAS observations indicate PSC top altitudes between 18 and 25 km. On 18 and 19 January PSCs are located at latitudes of 40–60◦N, at longitudes of
10◦W on 18 January and 0◦on 19 January, respectively. On
Stratospheric clouds have already been detected over the northern Europe. One of the PSC event observed in the lowest latitude in the northern hemisphere (Vaughan and Wareing, 2004) was detected on 10–11 January 2003. This cloud was observed above Aberystwyth (52,4◦N, 4,06◦W),
8◦northward of OHP. Some PSCs were also detected above
Scotland (Carter and Bridge, 1978). However, the most probably southern NH-PSC, was observed in March 1996. It was detected above England in 3–4 March 1996 by the satellite-borne HaLogen Occultation Experiment instrument (Hervig, 1999) and also above Berlin (52◦N) and Garmisch
(47.5◦N)(C. Wedekind, Dissertation, FU Berlin, 1997). Note
also, that a cloud has already been observed in the lower stratosphere over OHP, but the backward trajectories calcu-lations indicated that the cloud was formed within a laminae originating from the moist subtropical troposphere and mov-ing isentropically into the lower stratosphere; It exhibited a sporadic signature at 14 km, nearly 3 km above the thermal tropopause (Keckhut et al., 2005).
3 Background conditions
PTU sondes are launched daily at 12:00 UT by the French Meteorological Institute, M´et´eo-France, at Nˆımes (about 100 km west of OHP). The temperature profile measured on 19 January is also shown on Fig. 1, together with the calculated formation temperatures for Type 1 (Hanson and Mauersberger, 1988) and Type 2 PSC (Murray, 1967), for 10 ppbv HNO3and 5 ppmv water vapor. Stratospheric
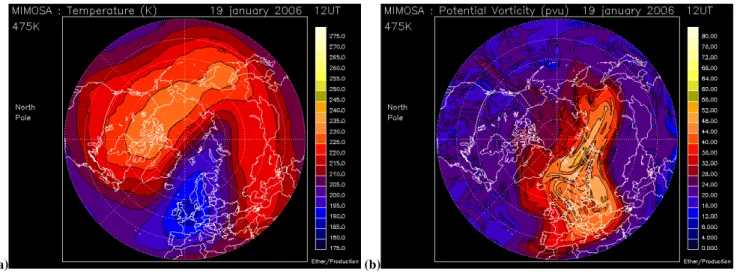
tem-peratures between 17 and 20 km are close to Type 1 PSC for-mation temperature. Further north, at Lyon (around 200 km north of OHP), temperatures recorded by the radiosonde on 19 January at noon at the cloud level are even colder (189 K). These in situ temperature observations are in good agreement with the European meteorological analyses shown on Fig. 3. The vortex was highly distorted and its coldest part was cen-tred over the North-Western part of Europe with temperatures lower than 190 K on the 475 K isentropic level, extending down to the South of France where lidar observations were conducted.
During the cloud event reported here, the vortex at the cloud altitude was very disturbed with a very large area of polar air extending over central Europe (see Fig. 3b). Note that the temperatures are also low on the edge and outside of the vortex, down to the west coast of France and to the Iberic peninsula. Air mass backward trajectories clusters are cal-culated using the FLEXPART model forced by the ECMWF meteorological analyses (Stohl, 1998). The air parcels corre-sponding to the PSC layer detected over OHP on 18 and 19 January are advected backwards in time from OHP and dis-persed during several days. These calculations clearly show that air masses are originating from the coldest area. This PSC event corresponds to a major mid-winter stratospheric warming with a large displacement of the vortex over
Eu-18-JAN-2006 -150 -120 -90 -60 -30 0 30 60 90 120 150 180 30 40 50 60 70 80 90 50 hPa: Tnat Tsts Tice 50 hPa: Tnat Tsts Tice 19-JAN-2006 -150 -120 -90 -60 -30 0 30 60 90 120 150 180 30 40 50 60 70 80 90 20-JAN-2006 -150 -120 -90 -60
-30 0 30 60 90 120 150 180 30 40 50 60 70 80 90 21-JAN-2006 -150 -120 -90 -60
-30 0 30 60 90 120 150 180 30 40 50 60 70 80 90
5 10 15 20 25 30 Cloud top altitude [km]
(a) (b)
Fig. 3.Maps of the temperature and Vorticity on 19 January at 12:00 UT. Temperatures are given in K(a)and Potential Vorticity is given in PVU(b)on the 475 K isentropic level. High-resolution potential vorticity is calculated with the advection model MIMOSA (Hauchecorne et al., 2002) driven by ECMWF (European Centre for Medium-Range Weather Forecast) wind field, while temperature field are also deduced from ECMWF analysis. The edge of the polar vortex edge is usually defined as the region of maximum PV gradients that correspond approximately to the 36 PVU contour on the figure. Maps are available on http://ether.ipsl.jussieu.fr/ for previous and past days.
rope and Siberia, known as a Canadian warming (Charlton and Polvani, 2005). The considered air masses remain on the same potential temperature level of about 450 K during transit indicating isentropic transport around 10 km above the tropopause, well into the stratosphere. When the air masses cross the latitude of 70◦N in the evening of 16 January, their
temperature is 200 K. Then, on 17 January the temperature of the air masses decreases to a minimum value of 188 K and then increases slowly up to 190 K before detection above OHP. Displacements of the Arctic polar vortex above OHP have already been reported (Godin et al., 2002; Marchand et al., 2003). However, they have never been associated with cloud detection with the OHP lidar, though it has been op-erating several hours a night when the sky is clear (that is, about 200 nights/year) for about 25 years. When the vortex is dynamically disturbed, polar air can reach the OHP site under the form of either polar filaments or vortex excursion. Yet, disturbed vortices that are usually detected over OHP are warmer because the phenomena occurs either during a disturbed winter associated with early stratospheric warming or in late winter. In both cases, the vortex is warmer and tem-peratures in the mid-latitude stratosphere over OHP remain above temperature threshold for PSC formation. In contrast, a cold vortex is very stable and, in this case, polar air excur-sions above mid-latitude regions are rare.
4 Potential impact on ozone chemistry
A Chemistry Transport Model (CTM) is used to estimate the ozone depletion associated with this PSC event. The 3-dimensional high-resolution chemical transport model called
Mod`ele Isentropique de transport M´eso-´echelle de l’Ozone Stratosph´erique par Advection avec CHImie (MIMOSA-CHIM) was developed to study the role of small-scale trans-port processes in determining the chemical composition of the stratosphere (Marchand et al., 2003). The model uses an isentropic vertical coordinate and is forced by temperature, pressure and wind fields provided by ECMWF daily anal-ysis. The chemical scheme is taken from the REPROBUS CTM (Lef`evre et al., 1994). This model includes 41 chemi-cal species or families and a heterogeneous chemistry mod-ule, which takes into account liquid super-cooled aerosols, and ice particles. NAT (Nitric Acid Trihydrate) PSCs are ne-glected in this simulation because the magnitude of the mea-sured backscatter suggests that the PSC over OHP is likely to be liquid. Heterogeneous reaction rates are calculated ex-plicitly, as a function of the PSC surface areas, assuming a radius of 1 and 10 mm respectively for Type I and Type II. PSC sedimentation is also taken into account.
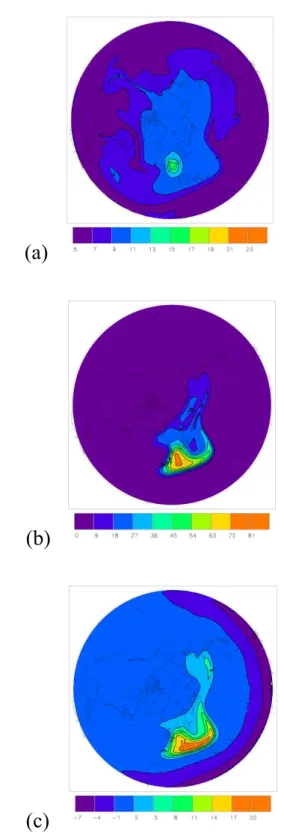
For the period of interest (from 18 January to 20 January), the CTM predicts a very large PSC area centred over the North-Western part of Europe (Fig. 4). The model-calculated PSC surface area available for heterogeneous chemistry is about 15.10−9cm2/cm3 above OHP; the maximum surface
area is found above the North Sea. As the cold area is not overlaying the vortex, but is rather centred on the edge of the vortex, PSCs process chemically, not only polar vortex air, but also mid-latitude air.
destruction. In order to determine the ozone loss directly as-sociated with the PSC event, an ozone passive tracer is also implemented in the MIMOSA model. This tracer is initial-ized in the same way as the chemically active ozone, every 12 h. It is then advected passively. The ozone field is sub-tracted to the tracer field to estimate the cumulative ozone loss over 12 h (Fig. 4). The model-calculated ozone loss peaks near the Northern Mediterranean sea, with an ozone loss rate of 35 ppb/day over the 12 h prior to PSC detection. This value is comparable to the Arctic ozone loss rates de-rived in January 2005 by Streibel et al. (2005), when early ozone losses were caused by distortions of the polar vor-tex and parts of it being exposed to sunlight (Goutail et al., 2005). In our case, the ozone loss is not confined to the polar vortex air. Indeed, although the vortex edge is rather located over Southern Europe (Fig. 3), the ozone loss area extends down to North Africa, indicating that this PSC event could also have impacted the ozone budget in mid-latitude air.
5 Discussion and conclusions
Here, we report the first detection of a Polar Stratospheric Cloud (PSC) at mid-latitudes, over Southern Europe, in January 2006. To our knowledge, this event is the most southward PSC ever observed in the Northern hemisphere. This observation is the first PSC detection at OHP after 25 years of systematic lidar observations (200 nigths/year). ECMWF temperature analyses and temperatures along the backward trajectories indicate that stratospheric tempera-tures were anomalously cold over Europe during this period and that the PSC formed on the edge of the Arctic polar vortex. CTM calculations show that PSC chemical process-ing was accompanied with a significant simultaneous ozone reduction, within and outside the vortex, as chlorine acti-vated air masses were advected to sunlight regions triggering ozone destruction. However, the overall effect of such events on stratospheric ozone is more complex. Indeed, a strong distortion of the polar vortex like the one reported here is usually associated with strong planetary wave activity. This enhanced wave activity favours the occurrence of major or sudden stratospheric warmings that weaken the vortex, en-hance polar temperatures and ultimately reduce the potential for PSC formation later on.
While ozone is expected to recover this century, is this extremely unusual event of a mid-latitude PSC a precursor sign of the climate feedback on stratospheric ozone budget or a simple anecdotal phenomena, part of the natural vari-ability? Low stratospheric ozone levels permit UV-B radia-tions to reach the ground over heavily populated regions of the Northern hemisphere. In the case of such events becom-ing more frequent, due to systematic circulation variations induced by climate change, the question of their potential im-pact on delaying ozone recovery will have to be addressed.
(
a
)
(
b
)
(
c
)
Fig. 4.Maps of PSC, Chlorine activation, and associated ozone loss estimated with numerical simulations. Model-calculated maps of
Several observational and modelling studies (Ramaswamy et al., 2001; Shindell and Grewe, 2002; Rex et al., 2004) have demonstrated that stratospheric temperatures over polar re-gions could have decreased in the last decades in response to ozone depletion and to increases in greenhouse gases concen-trations. However, the small expected changes of the mean winter temperature due to climate change is not directly re-lated to the observed PSC formation because the temperature variability in the Arctic, is much larger than the long-term radiative contribution. PSC formation is in general rather related to the occurrence of cold events and the mean dy-namical situation during the whole winter. In this case-study, the cold stratospheric temperatures were the result of a par-ticular dynamical situation, i.e. the initial phase of a major stratospheric warming. During this initial phase of warming, very strong wave activity increases the baroclinic circulation in the Artic stratosphere. Adiabatic expansion of air that is lifted on one side of the polar vortex induces the develop-ment of an extremely cold region at the edge of the polar vortex, while temperatures warm up on the other side of the vortex, where air sinks. Dissipation of the wave then results in a strong poleward and downward motion of air over the whole Arctic, connected with strong warming everywhere. The outcome is a weak and warm vortex. The occurrence of such major stratospheric warming usually reduces or even terminates the conditions favourable for the Arctic polar vor-tex, limiting the overall amount of ozone that is destroyed during the Arctic winter. This was the case during this Arctic winter 2005/2006, which started with very cold temperatures and high chlorine activation, whereas the overall ozone loss was limited compared to previous winters of the last decade (F. Goutail, personal communication) because the ozone de-struction was stopped by this early vortex breakdown and the concomitant increase in temperature. A weak and warm po-lar vortex was re-established later on and remained until the end of April. While low temperature can be generated fur-ther south during early winter, leading to direct ozone de-struction, this destruction is limited. More importantly, this type of event decreases the chance of a long lasting ozone depletion during the rest of the winter. This PSC cloud led to a sporadic ozone loss over mid-latitude populated area early in the winter, but most probably minor implications on the ozone recovery.
Acknowledgements. Continuous lidar observations have been conducted within the Network of the Detection of Atmospheric Composition Changes with CNES, ADEME and INSU-CNRS funding. We acknowledge the support of the European Commission through GEOmon Integrated Project under the 6th Framework Program (contract number FP6-2005-Global-4-036677).
Edited by: B. K¨archer
References
Austin, J. and Wilson, R. J.: Ensemble simulations of the de-cline and recovery of stratospheric ozone, J. Geophys. Res., 111, D16314, doi:10.1029/2005JD006907, 2006.
Carslaw, K. S., Luo, B. P., Clegg, S. L., Peter, T., Brimblecombe, P., and Crutzen, P. J.: Stratospheric aerosol growth and HNO3gas phase depletion from coupled HNO3and water uptake by liquid particles, Geophys. Res. Lett., 21, 2479–2482, 1994.
Carter, R. D. and Bridge, G. C.: Stratospheric cirrosstratus over Scotland, Weather, 33, 309–318, 1978.
Charlton, A. J. and Polvani, L. M.: A new look at stratospheric sudden warmings I: climatology and modeling benchmarks, J. Climate, 20, 449–469, 2007.
Chazette, P., David, C., Lefrere, J., Godin, S., Pelon, J., and M´egie, G.: Comparative lidar study of the optical, geometrical, and dy-namical properties of stratospheric post-volcanic aerosols, fol-lowing the eruption of El Chichon and Mount Pinatubo, J. Geo-phys. Res., 100, 23 195–23 207, 1995.
Chipperfield, M. P., Feng, W., and Rex, M.: Arctic Ozone Loss and Climate Sensitivity: Updated Three-Dimensional Model Study, Geophys. Res. Lett., 32, L11813, doi:10.1029/2005GL022674, 2005.
Crutzen, P. J. and Arnold, F.: Nitric acid cloud formation in the cold Antarctic stratosphere: A major cause for the springtime “ozone hole”, Nature, 324, 651–655, 1986.
David C., Godin, S., M´egie, G. , Emery, Y., and Flesia, C.: Physi-cal state and composition of Polar Stratospheric Clouds inferred from airborne lidar measurements during SESAME, J. Atmos. Chem., 27, 1–16, 1997.
David, C., Bekki, S., Godin, S., M´egie, G., and Chipperfield, M. P.: Polar stratospheric clouds climatology over Dumont d’Urville between 1989 and 1993 and the influence of volcanic aerosols on their formation, J. Geophys., Res., 103, 22 163–22 180, 1998. Goldfarb, L., Keckhut, P., Chanin, M. L., and Hauchecorne, A.:
Cirrus climatological results from lidar measurements at OHP (44◦N, 6◦E), Geophys. Res. Lett., 28, 9, 1687–1690, 2001. Godin, S., Marchand, M., Hauchecorne, A., and Lef`evre,
F.: Influence of Arctic polar ozone depletion on lower stratospheric ozone amounts at Haute-Provence Observatory (43.92◦N, 5.71◦E), J. Geophys. Res., 107(D20), 8272, doi:10.1029/2001JD000516, 2002,
Goutail F., Pommereau, J. P., Lef`evre, F., van Roozendael, M. , Andersen, S. B., Kastab Hoistar, B. A., Dorokhov, V., Kyr¨o, E., Chipperfield, M. P., and Feng, W.: Early unusual ozone loss dur-ing the Arctic winter 2002/2003 compared to other winters, At-mos. Chem. Phys., 5, 665–677, 2005,
http://www.atmos-chem-phys.net/5/665/2005/.
Hanson D. R. and Mauersberger, K.: Laboratory studies of the nitric acid trihydrate: Implication for south polar stratosphere, Geo-phys. Res. Lett., 15, 855–858, 1988.
Hauchecorne, A., Godin, S., Marchand, M., Heese, B., and Souprayen, C.: Quantification of the transport of chemical constituents from the polar vortex to middle latitudes in the lower stratosphere using the high-resolution advection model MIMOSA and effective diffusivity, J. Geophys. Res., 107(D20), 8289, doi:10.1029/2001JD000491, 2002.
Hervig, M.: Stratospheric clouds over England, Geophys. Res. Lett., 26, 1137–1140, 1999.
M., Donfrancesco, G. D., Stiller, G., von Clarmann, T., Fischer, H., and Biermann, U. : Spectroscopic evidence for NAT, STS, and ice in MIPAS infrared limb emission measurements of polar stratospheric clouds, Atmos. Chem. Phys., 6, 1201–1219, 2006, http://www.atmos-chem-phys.net/6/1201/2006/.
Junge C. E., Changon, C. W., and Manson, J. E.: Stratospheric aerosols, J. Meteorol., 18, 81–108, 1961.
Keckhut, P., Borchi, F., Bekki, S., Hauchecorne, A., and SiLaouina, M.: Cirrus classification at mid-latitude from systematic li-dar observations, J. Appl. Meteorol. Climatol., 45(2), 249–258, doi:10.1175/JAM2348.1, 2006.
Keckhut, P., Hauchecorne, A., Bekki, S., Colette, A., David, C., and Jumelet, J.: Indications of thin cirrus clouds in the stratosphere at mid-latitudes, Atmos. Chem. Phys., 5, 3407–3414, 2005, http://www.atmos-chem-phys.net/5/3407/2005/.
Lef`evre, F., Brasseur, G. P., Folkins, I., Smith, A. K., and Simon, P.: Chemistry of the 1991-1992 stratospheric winter: Three-dimensional model simulations, J. Geophys. Res., 99, 8183– 8195, 1994.
Marchand, M., Godin, S., Hauchecorne, A., Lef`evre, F., Bekki, S., and Chipperfield, M.: Influence of polar ozone loss on north-ern midlatitude regions estimated by a high-resolution chem-istry transport model during winter 1999–2000, J. Geophys. Res., 108(D5), 8326, doi:10.1029/2001JD00906, 2003.
McCormick, M. P., Steele, H. M., Hamill, P., Chu, W. P., and Swissler, T. J.: Polar Stratospheric Clouds sightings by SAM II, J. Atmos. Sci., 39, 1387–1397, 1982.
Murray, F. W.: On the computation of saturation vapor pressure, J. Appl. Meteorol., 6, 203–204, 1967.
Poole, L. R. and McCormick, M. P.: Polar Stratospheric Clouds and the Antarctic ozone hole, J. Geophys. Res., 93, 8423–8430, 1989.
Ramaswamy V., Chanin, M. L., Angell, J., Barnett, J., Gaffen, D., Gelman, M., Keckhut, P., Kolshelkov, Y., Labitzke, K., Lin, J.-J. R., O’Neill, A., Nash, J., Randel, W., Rood, R., Shine, K., Shiotani, M., and Swinbank, R.: Stratospheric Temperature Changes: Observations And Model Simulations, Rev. Geophys., 39, 71–122, 2001.
Rex, M., Salawitch, R. J., von der Gathen, P., Harris, N. R. P. , Chipperfield, M. P., Naujokat, B.: Arctic ozone loss and climate change, Geophys. Res. Lett., 31, L04116, doi:10.1029/2003GL018844, 2004.
Russell, P. B., Swissler, T. J., and McCormick, M. P.: Methodology for error analysis and simulation of lidar aerosol measurements, Appl. Opt., 18, 3783–3797, 1979.
Shindell, D. T. and Grewe, V.: Separating the influence of halogen and climate changes on ozone recovery in the upper stratosphere, J. Geophys. Res., 107(D12), ACL-3 doi:10.1029/2001JD000420, 2002.
Stohl, A., Hittenberger, M., and Wotawa, G.: Validation of the Lagrangian particle dispersion model FLEXPART against large scale tracer experiment data, Atmos. Environ., 24 4245–24 4264, 1998.
Streibel M., Rex, M., von der Gathen, P., Lehmann, R., Harris, N. R. P., Braathen, G. O., Reimer, E., Deckelmann, H., Chipper-field, M., Millard, G., Allaart, M., Andersen, S. B., Claude, H., Davies, J., De Backer, H., Dier, H., Dorokov, V., Fast, H., Gerd-ing, M., Kyr¨o, E., Litynska, Z., Moore, D., Moran, E., Nagai, T., Nakane, H., Parrondo, C., Skrivankova, P., St¨ubi, R., Vaughan, G., Viatte, P., and Yushkov, V.: Chemical ozone loss in the Arctic winter 2002/2003 determined with Match, Atmos. Chem. Phys., 5, 4311–4333, 2005,
http://www.atmos-chem-phys.net/5/4311/2005/.
Tabazadeh, A., Turco, R. P., and Jacobson, M. Z.: A model for studying the composition and chemical effects of stratospheric aerosols, J. Geophys. Res., 99, 12 897–12 914, 1994.
Toon, O. B., Browell, E. V., Kinne, S., and Jordan, J.: An analysis of lidar observations of Polar Stratospheric Clouds, Geophys. Res. Lett., 17, 393–396, 1990.
Turco, R. P., Whitten, R. C., and Toon, O. B.: Stratospheric aerosols: Observation and theory, Rev. Geophys. Space Phys., 20(2), 233–279, 1982.
Turco, R. P., Toon, O. B., and Hamill, P.: Heterogeneous physico-chemistry of polar ozone hole, J. Geophys. Res., 94, 16 493– 16 510, 1989.
Vaughan, G. and Wareing, D. P.: Stratospheric aerosol measure-ments by dual polarisation lidar, Atmos. Chem. Phys., 4, 2441– 2447, 2004,
http://www.atmos-chem-phys.net/4/2441/2004/.