ACPD
10, 6681–6712, 2010Arctic ozone loss and polar stratospheric
clouds
N. R. P. Harris et al.
Title Page
Abstract Introduction
Conclusions References
Tables Figures
◭ ◮
◭ ◮
Back Close
Full Screen / Esc
Printer-friendly Version
Interactive Discussion Atmos. Chem. Phys. Discuss., 10, 6681–6712, 2010
www.atmos-chem-phys-discuss.net/10/6681/2010/ © Author(s) 2010. This work is distributed under the Creative Commons Attribution 3.0 License.
Atmospheric Chemistry and Physics Discussions
This discussion paper is/has been under review for the journal Atmospheric Chemistry and Physics (ACP). Please refer to the corresponding final paper in ACP if available.
A closer look at Arctic ozone loss and
polar stratospheric clouds
N. R. P. Harris1, R. Lehmann2, M. Rex2, and P. von der Gathen2
1
European Ozone Research Coordinating Unit, Department of Chemistry, University of Cambridge, Lensfield Rd, Cambridge, CB2 1HE, UK
2
Alfred Wegener Institute, Potsdam, Germany
Received: 24 December 2009 – Accepted: 8 February 2010 – Published: 10 March 2010
Correspondence to: N. R. P. Harris ([email protected])
ACPD
10, 6681–6712, 2010Arctic ozone loss and polar stratospheric
clouds
N. R. P. Harris et al.
Title Page
Abstract Introduction
Conclusions References
Tables Figures
◭ ◮
◭ ◮
Back Close
Full Screen / Esc
Printer-friendly Version
Interactive Discussion
Abstract
The empirical relationship found between column-integrated Arctic ozone loss and the volume of polar stratospheric clouds inferred from meteorological analyses is updated and examined in more detail. The relationship is found to hold at different altitudes as well as in the column. Analysis of the photochemistry leading to the ozone loss shows
5
that the early winter activation is limited by the photolysis of nitric acid. This step pro-duces nitrogen dioxide which is converted to chlorine nitrate which in turn reacts with hydrogen chloride on any polar stratospheric clouds to form active chlorine. The rate-limiting step is the photolysis of nitric acid: this occurs at the same rate every year and so the interannual variation in the ozone loss is caused by the extent and persistence
10
of the polar stratospheric clouds. In early spring the ozone loss rate increases as the solar insolation increases the photolysis of the chlorine monoxide dimer. However the length of the ozone loss period is determined by the photolysis of nitric acid which also occurs in the near ultraviolet. As a result of these compensating effects, the amount of the ozone loss is principally limited by the extent of original activation rather than its
15
timing. In addition a number of factors, including the vertical changes in pressure and total inorganic chlorine as well as denitrification and renitrification, offset each other. As a result the extent of original activation is the most important factor influencing ozone loss. These results indicate that relatively simple parameterisations of Arctic ozone loss could be developed for use in coupled chemistry climate models.
20
1 Introduction
Polar ozone loss has been the subject of intense scientific and public interest since the discovery of the Antarctic ozone hole (Farman et al., 1985) and its relatively quick attribution to observations of chlorine compounds (de Zafra et al., 1987; Solomon et al., 1987; Anderson et al., 1989). Stratospheric ozone loss takes place in the polar
25
ACPD
10, 6681–6712, 2010Arctic ozone loss and polar stratospheric
clouds
N. R. P. Harris et al.
Title Page
Abstract Introduction
Conclusions References
Tables Figures
◭ ◮
◭ ◮
Back Close
Full Screen / Esc
Printer-friendly Version
Interactive Discussion stratospheric dynamics in the two hemispheres naturally lead to large interannual
vari-ations in vortex stability and in ozone in the dynamically active Arctic winter strato-sphere and to small interannual variations in the dynamically less active Antarctic. These differences lead to higher natural average amounts of total ozone over the Arctic (∼450 Dobson Units – DU) than over the Antarctic (∼300 DU – Dobson, 1968; Newman
5
and Rex, 2007). These differences in dynamics also lead to a much greater variability of polar ozone loss over the Arctic (where, for example, there were losses of <10% in 1998/99 (Schulz et al., 2001) and>65% in 1999/2000 (Rex et al., 2002) at around 18 km) than over the Antarctic where nearly complete ozone loss has taken place in nearly all winters since the early 1990s at altitudes between about 15 and 20 km. Even
10
in the anomalous year of 2002 when the Antarctic vortex was disturbed and broke up in mid-September the minimum daily ozone value south of 40◦S was ∼140 DU, 30% below the late July values (Bodeker et al., 2005). In percentage terms this loss is comparable with the largest losses observed in the Arctic.
This large variability in the Arctic dynamics coupled with a number of
microphysi-15
cal and photochemical thresholds has made it hard to reproduce ozone loss in past winters for which the meteorology is known and analyses are available, although 3-D chemical transport models (CTMs – e.g. Chipperfield et al., 2005) and data assimilation approaches (Jackson and Orsolini, 2008) are now doing a reasonable job. However the additional complication of calculating the stratospheric dynamics (coupled with the
20
sensitivity of the ozone loss processes to the dynamics and transport) means that it is even harder to predict Arctic ozone losses for the coming decades using coupled chem-istry climate models (CCMs) (Austin et al., 2003; Eyring et al., 2007). The sensitivity of ozone loss to changes in climate is thus hard to assess.
The basic mechanisms leading to ozone loss are the same over the two poles and
25
are generally well understood (e.g. Newman and Rex, 2007). As the polar vortex is established, the temperatures drop below a critical point, and polar stratospheric clouds (PSCs) can form. HCl and ClONO2react on the surface of PSCs, with these unreactive
ACPD
10, 6681–6712, 2010Arctic ozone loss and polar stratospheric
clouds
N. R. P. Harris et al.
Title Page
Abstract Introduction
Conclusions References
Tables Figures
◭ ◮
◭ ◮
Back Close
Full Screen / Esc
Printer-friendly Version
Interactive Discussion rapidly destroy ozone. In the absence of further exposure to PSCs, the ClO (chlorine
monoxide) formed continues to destroy ozone while it is gradually converted back to unreactive forms. The observed evolution of the main chemical species in the Arctic can be seen in Fig. 1 for the 2004/05 winter. The timing of the growth in ClO and ClOxcoincides with the onset of PSCs. Continued PSC occurrence leads to continued 5
formation of ClO and ClOx. Reversion to ClONO2 and HCl occurs after the vortex has
warmed and the PSCs have evaporated. Occasionally in Arctic winters, particularly large ozone losses can occur when air masses become depleted in HNO3as PSCs fall
to lower altitudes during prolonged cold periods, a process that delays the deactivation of the active chlorine species. The persistence of PSCs depends very strongly on the
10
dynamical situation in that winter and so is the main reason that ozone loss can vary so much from year to year in the Arctic.
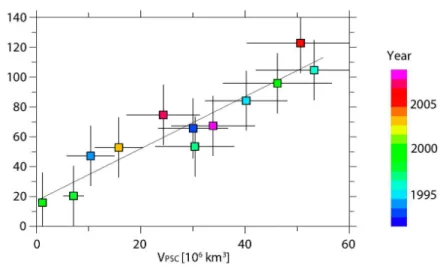
Given the mechanistic complexity and large variability, it came as a surprise to find that a compact, linear relation exists between ozone loss and the calculated volume of PSCs (VPSC) when each is integrated over the period of vortex existence (Fig. 2 –
15
see also Rex et al., 2004, 2006; Tilmes et al., 2004). The relation holds over a wide range of ozone losses and PSC volumes implying that the effects of many influences on ozone loss (e.g. denitrification, solar exposure, initial chemical fields, descent rates, in-mixing, vortex inhomogeneities, and vertical extent) must be offsetting to some extent. The existence of this relation (calculated from temperature fields and vortex average
20
descent rates derived from meteorological analyses and ozonesonde measurements) has been confirmed using HALOE satellite measurements and an independent ap-proach to calculating the ozone loss (Tilmes et al., 2004). Both Rex et al. (2004) and Tilmes et al. (2004) found larger than expected chemical ozone losses in the 1991/92 and 1992/93 winters which they attributed to the increase in stratospheric aerosol
fol-25
lowing the eruption of Mt Pinatubo.
ACPD
10, 6681–6712, 2010Arctic ozone loss and polar stratospheric
clouds
N. R. P. Harris et al.
Title Page
Abstract Introduction
Conclusions References
Tables Figures
◭ ◮
◭ ◮
Back Close
Full Screen / Esc
Printer-friendly Version
Interactive Discussion losses occur in warm winters when PSCs are less common. This explanation
does not really address either the compactness or the near-linearity of the rela-tion. The lack of explanation is one of the main reasons why it is not being used to evaluate the coupled climate models (CCMs) in the CCM Validation Activity for SPARC (CCMVal) (see Eyring et al., 2005, updated at http://www.pa.op.dlr.de/CCMVal/
5
CCMVal EvaluationTable.html), despite its empirical robustness and its implication that there is sensitivity of 15 DU column ozone loss for each 1◦C cooling (Rex et al., 2006). The relation has however been used to evaluate (a) the improvements made to the SLIMCAT 3-D Chemical Transport Model (CTM) which used to show a compact, linear relation of the wrong slope (Rex et al., 2004), and now can reproduce the slope as well
10
(Chipperfield et al., 2005; Fig. 4.13 in Newman and Rex, 2007), and (b) the ozone loss calculated in the Whole Atmosphere Community Climate Model (WACCM) (Tilmes et al., 2007).
The aim of the current study is to explain the compactness and linearity of this re-lationship and to identify its sensitivity to the range of possible influences discussed
15
above. Our earlier work (Harris et al., 2009) found that the rate-determining step for chlorine activation in early winter is the photolysis of HNO3, while the subsequent ozone loss depended on the competition between the photolysis of Cl2O2 (leading to
ozone loss) and HNO3 (leading to deactivation). Since both processes go faster as
the solar zenith angle decreases, the integrated ozone loss depends primarily on the
20
extent of the initial chlorine activation and not on the speed of the ozone loss. Here we investigate the empiricalVPSC/ozone loss relationship in more detail and extend the photochemical analysis to investigate the effect of multiple activations, denitrification and the vertical distribution of available chlorine (Cly).
In the next section the methodology and data sources are described. In Sect. 3,
25
ACPD
10, 6681–6712, 2010Arctic ozone loss and polar stratospheric
clouds
N. R. P. Harris et al.
Title Page
Abstract Introduction
Conclusions References
Tables Figures
◭ ◮
◭ ◮
Back Close
Full Screen / Esc
Printer-friendly Version
Interactive Discussion discussed in Sect. 5. Finally the relevance and context of these results is discussed
and summarised in Sect. 6.
2 Methodology
This study uses the values for ozone loss and VPSC calculated in Rex et al. (2006) updated with values for 2005/06, 2006/07 and 2007/08 using the same methodology.
5
Briefly, vortex averaged profiles of ozone loss have been determined as the differences between the end of March and early January, with an adjustment for the vortex average descent being made using diabatic heating rates from the SLIMCAT CTM. These have been converted into concentration versus altitude profiles, using the vortex averaged temperature and pressure profiles from late March. The total column loss was
calcu-10
lated as the vertical integral of the loss profiles between 14 and 24 km. The lower limit of this range (∼380 K) is close to the bottom of the well-isolated part of the polar vortex. For most winters ozone loss at this level is small. Also, the effect of any chemical loss in the vertical region below 14 km on the total ozone column in the Arctic would be limited because of rapid exchange with mid latitude air. Formation of PSCs above the vertical
15
range considered here is unlikely and consequently significant chemical loss of ozone is not expected above 24 km. The estimated uncertainty in the integrated ozone loss is∼10–15 DU (Rex et al., 2002), mainly due to uncertainties in the calculated cooling rates and the potential impact of mixing across the vortex edge.
PSCs are assumed to be nitric acid trihydrate (NAT), and VPSC is calculated from
20
the laboratory observations of Hanson and Mauersberger (1988), a water vapour mix-ing ratio of H2O=5 ppm, and an observed profile of HNO3 (Rex et al., 2002 for more
details of the methodology). In this paper temperatures from ECMWF ERA-Interim re-analyses are used in order to have a consistent vertical resolution and data quality across the whole period. The validity of this approach is discussed further in Sect. 3.
25
ACPD
10, 6681–6712, 2010Arctic ozone loss and polar stratospheric
clouds
N. R. P. Harris et al.
Title Page
Abstract Introduction
Conclusions References
Tables Figures
◭ ◮
◭ ◮
Back Close
Full Screen / Esc
Printer-friendly Version
Interactive Discussion 174 reactions. The formation of solid and liquid PSC particles is simulated according
to Murray (1967), Hanson and Mauersberger (1988) and Carslaw et al. (1995). For the photolysis of Cl2O2, the absorption cross sections from Burkholder et al. (1990)
are used, which are close to the values found in the most recent laboratory studies (Chen et al., 2009; Papanastasiou, et al., 2009; von Hobe et al., 2009). All remaining
5
information on rate constants is taken from the NASA-JPL 2006 Evaluation (Sander et al., 2006). The overhead ozone needed for the calculation of photolysis frequencies is the average of all ozonesonde measurements made between January and March from 1992–2007 at Ny-Alesund (79◦N). The numerical integration is performed using the kinetic preprocessor KPP (Damian et al., 2000).
10
Idealised trajectories are used which correspond approximately to the range of isen-tropic surfaces on which the observed ozone loss is derived. The trajectories are de-signed to mimic air toward the edge of an Arctic vortex which is displaced offthe North pole by 10◦: it is centred at 80◦N and has a sinusoidal 6 day cycle of 20◦. The main set of runs is performed at 50 hPa (∼475 K). Runs investigating the vertical dimension
15
were performed at 550 K (∼30 hPa), 500 K (∼40 hPa) and 450 K (∼55 hPa). The anal-ysis presented here is split into three main parts: the activation period (Sect. 4.1); the ozone loss period (Sect. 4.2); and aspects of the vertical dimension process (Sect. 5).
3 Altitude variation of relation and PSC composition
The original plots of integrated column ozone loss against integrated PSC volume (Rex
20
et al., 2004, 2006) were calculated using ECMWF operational analyses. The PSC volumes shown in Fig. 2 are calculated using ERA-Interim re-analyses. These give greater consistency between years. The general features of the plot are unchanged. The most notable is that the largest value forVPSCis now calculated to be in 1995/96 rather than 2004/05. However the changes are largely within the estimated
uncertain-25
ACPD
10, 6681–6712, 2010Arctic ozone loss and polar stratospheric
clouds
N. R. P. Harris et al.
Title Page
Abstract Introduction
Conclusions References
Tables Figures
◭ ◮
◭ ◮
Back Close
Full Screen / Esc
Printer-friendly Version
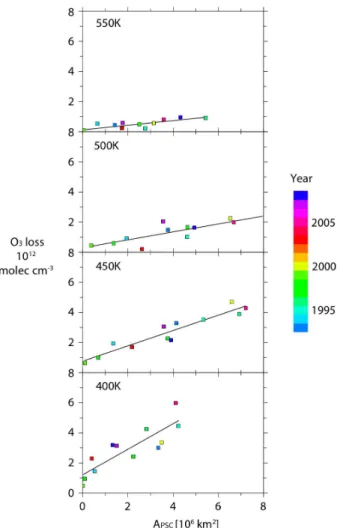
Interactive Discussion Figure 3 shows the ozone loss on individual isentropic surfaces (400, 450, 500 and
550 K) plotted against the area of PSCs (APSC), both integrated over the course of the winter. (As for the column ozone loss andVPSC, the isentropic surfaces “descend” over the course of the winter according to the diabatic heating rates calculated in the SLIMCAT model. The isentropic surface referred to is the one at the end of the winter.)
5
The ozone losses in Fig. 3 are shown in molec cm−3 (not ppm), so that their relative contributions to the column can be more easily seen. The plots for these levels are generally similar to the column plot of ozone loss vsVPSC, being reasonably linear and compact. The slopes (in molec cm−3km−2 or 1015molec km−1) are greatest at 400 K and 450 K, with smaller values at 500 K and 550 K, showing the importance of the lower
10
levels to the integrated column loss. The 550 K plot has the largest relative scatter. This is partly due to the smaller ozone losses found there and partly due to the poorer data quality (a significant fraction of ozonesondes do not reach that high especially early in winter as the descending layer starts at 600 or 700 K).
The values forVPSCandAPSCin Figs. 2 and 3 were calculated on the assumption that
15
PSCs are composed of nitric acid trihydrate. The true nature of PSCs, especially near the PSC formation threshold, has been studied extensively with considerable evidence that liquid sulphate aerosol and supercooled ternary solutions (STS) play an impor-tant role in chlorine activation in the Arctic (e.g. Drdla et al., 2002). STS is present at different temperatures to NAT so that the NAT threshold temperatures used here
20
might be misleading. The composition of large-scale fields of PSCs has been recently investigated using the MIPAS infrared sounder and the CALIPSO/CALIOP lidar mea-surements (H ¨opfner et al., 2009; Pitts et al., 2007, 2009). They find that the PSC fields can be described by four main types (ice, NAT-STS mixtures, STS-ICE mixtures, and just STS). The overall evolution of the observed PSCs is similar to that deduced
25
from meteorological analyses, but it is hard to make quantitative comparisons. Pitts et al. (2009) use observed HNO3and H2O fields to calculate possible PSC existence
ACPD
10, 6681–6712, 2010Arctic ozone loss and polar stratospheric
clouds
N. R. P. Harris et al.
Title Page
Abstract Introduction
Conclusions References
Tables Figures
◭ ◮
◭ ◮
Back Close
Full Screen / Esc
Printer-friendly Version
Interactive Discussion inferred from meteorological temperatures and the NAT thermodynamics. A closer
ex-amination of these issues in the Arctic is necessary to justify a change in our definition of PSC occurrence which relies solely on meteorological reanalyses and assumptions about the mixing ratios of H2O and HNO3.
The effect of this assumption on the ozone loss/VPSC relation was investigated by
5
Tilmes et al. (2008) who found significant differences only in winters with high sulphate aerosol loading, i.e. 1991/92 and 1992/93 following the Mt Pinatubo eruption. For com-parison, we have used the temperature dependent cold aerosol formation to calculate APSC (as in Fig. 3, but not shown). No real difference is found except at 400 K, where a slightly more compact relation is found. This is presumably related to the higher
10
amount of bacground aerosol at these altitudes. This is consistent with the CALIOP analysis in the Antarctic which shows the biggest discrepancy in a 1–2 km band at al-titudes below 15 km at the beginning of winter (Fig. 14c in Pitts et al., 2009). A similar feature can be seen in the comparison of calculated PSC occurrence usingTNAT with ground-based lidar observations in 1999/2000 Arctic winter (Fig. 2 in Rex et al., 2002).
15
Overall, we found no reason to change from using the NAT definition in our calculation ofAPSCandVPSC.
4 Idealised case: a single layer
We now examine the relationship of the ozone loss to the photochemical steps involved in the activation and deactivation of ClOx (=ClO+2*Cl2O2+2*Cl2) at 50 hPa using the
20
ACPD
10, 6681–6712, 2010Arctic ozone loss and polar stratospheric
clouds
N. R. P. Harris et al.
Title Page
Abstract Introduction
Conclusions References
Tables Figures
◭ ◮
◭ ◮
Back Close
Full Screen / Esc
Printer-friendly Version
Interactive Discussion
4.1 Activation
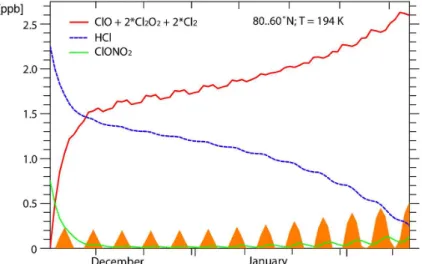
Figure 4 shows the mixing ratios of the chlorine reservoirs, ClONO2 and HCl and the
activated forms ClOx from 1 December to 14 February assuming that PSCs are
con-tinuously present. The assumed temperature is 194 K which is representative of the vortex as a whole. Two phases can be seen: (i) a rapid initial rise in ClOx associated 5
with equal decreases in both HCl and ClONO2; and (ii) a slower continued increase in
ClOxaccompanied by a continued decrease in HCl. By the end of the period, nearly all the available chlorine is in the form of ClOx. The two steps are now discussed in turn.
ClOx rises initially as a result of the fast heterogeneous reaction between ClONO2
and HCl, with the extent of the initial activation being determined by the amount of
10
ClONO2initially present (M ¨uller et al., 1994; Santee et al., 2008). The heterogeneous
reaction of ClONO2+HCl proceeds quicker at lower temperatures, while the photolysis
of HNO3 has only a weak temperature dependence. The main effect of lower temper-atures is thus to accelerate the initial activation (not shown).
If the initial mixing ratio of HCl is greater than that of ClONO2, further activation 15
depends on the formation of more ClONO2(e.g. M ¨uller et al., 1994) which depends in turn on the photolysis of HNO3producing NO2which reacts with ClO to form ClONO2.
In the presence of PSCs, the ClONO2reacts rapidly with HCl to produce more ClOx. In
the Arctic winter the slow step in the overall activation mechanism is the photolysis of HNO3, with a timescale of days to weeks. The slow, continued rise in ClOxin Fig. 4 thus 20
depends principally on the photolysis frequency, J(HNO3), and this factor is responsible
for the acceleration in the activation after mid-winter. Complete activation would take several weeks in the Arctic in the continued presence of PSCs. The full mechanism is thus
ClONO2+HCl→Cl2+HNO3 heterogeneous, so fast if PSCs are present (R1) 25
HNO3+hν→NO2+OH slow (R2)
ACPD
10, 6681–6712, 2010Arctic ozone loss and polar stratospheric
clouds
N. R. P. Harris et al.
Title Page
Abstract Introduction
Conclusions References
Tables Figures
◭ ◮
◭ ◮
Back Close
Full Screen / Esc
Printer-friendly Version
Interactive Discussion In the real Arctic vortex, the initial activation is patchy depending on the altitudes
and regions where the PSCs first form as well as on their extent. Vortex average ClOx initially rises slower in reality than in the idealised case, as indicated in Fig. 1. To illustrate this, Fig. 5 shows the same model calculation as in Fig. 4, except that the PSCs occur episodically (1 day in 6). The slow rise is still apparent, but the effect of
5
the fast initial activation is smeared out over time. The stabilisation of HCl between PSC exposures is a result of the lack of PSCs. Similarly each of the small rises in ClOx
results from exposure to PSCs, and the decreases occur during exposure to sunlight (orange). However none of these individual fast processes really influence the overall shape which is still determined by J(HNO3). Further, the initial rapid activation could 10
be responsible for the non-zero intercepts in Figs. 2 and 3, as any small-scale or sub-grid process leading to PSC formation (e.g. mountain waves) could rapidly activate a small but significant amount of air while barely contributing to VPSC. However this mechanism might not be the correct interpretation since a non-zero intercept is also seen in the SLIMCAT model calculations.
15
Overall, our analysis of the chlorine activation shows that activation in Reaction (R1) is fast and that the rate limiting factor for any continued activation is the photolysis of HNO3 to form NO2 in Reaction (R2) and then ClONO2 in Reaction (R3). To first
order the photolysis of HNO3does not vary much from year to year, and so interannal
variations in activation depend on the presence of PSCs for activation to occur through
20
Reaction (R1).
4.2 Deactivation and ozone loss
There have not been many studies explicitly looking at how the amount of ozone loss depends on the timing and extent of the initial activation. The main ozone loss period starts early in the year as the insolation increases. The instantaneous ozone loss rates
25
ACPD
10, 6681–6712, 2010Arctic ozone loss and polar stratospheric
clouds
N. R. P. Harris et al.
Title Page
Abstract Introduction
Conclusions References
Tables Figures
◭ ◮
◭ ◮
Back Close
Full Screen / Esc
Printer-friendly Version
Interactive Discussion in Harris et al. (2009), both the ozone loss and the chlorine deactivation are driven
by sunlight and so the ozone loss and chlorine deactivation processes accelerate as the insolation increases. The rate limiting step for ozone loss in the Arctic (for a given amount of total inorganic chlorine (Cly)) is:
Cl2O2+hν→ClOO+Cl (R4)
5
while in the absence of PSCs, Reactions (R2) and (R3) become the main deactivation mechanism.
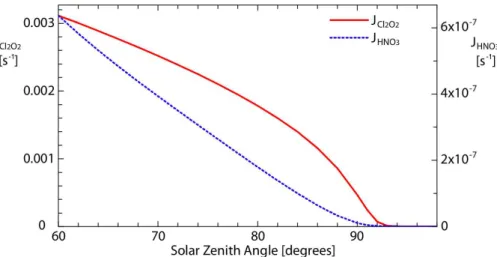
Both HNO3 and Cl2O2 are photolysed in the UV, and the atmospheric photolysis rates of both (R2) and (R4) in the Arctic polar lower stratosphere depend mainly on wavelengths longer than 300 nm as shorter wavelengths are absorbed by stratospheric
10
ozone.
Figure 6 shows these photolysis rates (integrated from 250–400 nm) as a function of solar zenith angle. They both increase markedly as the solar zenith angle decreases as winter turns into spring. To first order both the chlorine deactivation rate and the ozone loss rate are proportional to the solar intensity (as well as to each other), with both
15
processes having a timescale of several days at 70–75◦N in January and February. As a result the integrated ozone loss is, to first order, independent of the solar intensity and the timing of the activation, but is dependent on the original level of activation.
To illustrate this, Fig. 7 shows the ozone mixing ratios for three cases calculated by the AWI model. All cases have an initial activation of 3 ppb of Cly with the same
20
hypothetical trajectory used before (50 hPa centred at 80◦N with 20◦ deviation with a 6 day cycle). The only difference is in the start dates which are set three weeks apart: 11 January (red), 1 February (blue) and 22 February (green). Despite the large differences in the start dates, the ozone losses are within±10%.
While this analysis highlights the importance of the two photolysis Reactions (R2)
25
ACPD
10, 6681–6712, 2010Arctic ozone loss and polar stratospheric
clouds
N. R. P. Harris et al.
Title Page
Abstract Introduction
Conclusions References
Tables Figures
◭ ◮
◭ ◮
Back Close
Full Screen / Esc
Printer-friendly Version
Interactive Discussion rate to decreasing SZA at high SZA (∼90◦) and the greater sensitivity of the HNO3
photolysis rate at lower SZA (∼70–80◦) shown in Fig. 6. Also, the conversion of HNO3
to NOx via the alternative channel
OH+HNO3→NO3+H2O (R5)
depends on J(HNO3) since HNO3 photolysis is one of the main ways in which OH is 5
formed.
In addition, reactions which play an important role in Antarctic ozone loss are less significant in most Arctic winters. The highly temperature-dependent, heterogeneous reactivation of ClONO2through
ClONO2+H2O→HOCl+HNO3 (R6)
10
is unimportant in most Arctic winters.
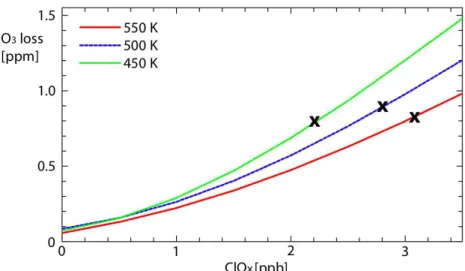
We have so far shown the direct relationship between VPSC and ClOx. A further important point about the degree of activation is that the ozone loss is close to linear with ClOx. The blue line in Fig. 8 shows the dependence of the accumulated ozone loss at 500 K (close to 50 hPa, the level of the calculations shown in Fig. 7) on the initial
15
amount of ClOx. The accumulated ozone losses for 1, 2 and 3 ppb ClOx at 500 K are
0.27, 0.59 and 1.00, respectively, so that there is a small, positive non-linearity in this relationship.
5 Extending to the 3-D view
The analysis discussed in Sect. 4 is concerned only with a single layer in the Arctic
vor-20
ACPD
10, 6681–6712, 2010Arctic ozone loss and polar stratospheric
clouds
N. R. P. Harris et al.
Title Page
Abstract Introduction
Conclusions References
Tables Figures
◭ ◮
◭ ◮
Back Close
Full Screen / Esc
Printer-friendly Version
Interactive Discussion
5.1 Pressure
For fixed ClOx, the potential for ozone loss depends slightly on pressure, with larger
ozone losses calculated at lower potential temperatures as shown in Fig. 8. For an initial ClOxof 3 ppb, the accumulated ozone losses at 450, 500 and 550 K are 1.2, 1.0 and 0.8 ppm. The reasons for the pressure dependence are as follows.
5
(a) At higher altitudes the ClO and BrO concentrations are smaller for the same mixing ratios, as is the overall pressure, thus reducing the rates of the reactions
ClO+ClO+M→Cl2O2+M (R7)
ClO+BrO→Br+Cl+O2. (R8)
(b) At higher altitudes the chlorine deactivation rate is higher, because NO2 produc-10
tion through both HNO3 photolysis and Reaction (R5) is faster. An increase of the HNO3mixing ratio with altitude, not considered in the present model runs, would
am-plify this effect.
Two counteracting effects at higher altitudes are the faster rate of the reaction
ClO+O→Cl+O2 (R9)
15
because the O concentration increases with altitude; and the faster photolysis of Cl2O2
(Reaction R4). However these are small compared to points (a) and (b).
5.2 Available chlorine
The amount of available chlorine increases rapidly with altitude in the Arctic vortex (Schmidt et al., 1994). As a result, more chlorine is activated for a given PSC exposure
20
ACPD
10, 6681–6712, 2010Arctic ozone loss and polar stratospheric
clouds
N. R. P. Harris et al.
Title Page
Abstract Introduction
Conclusions References
Tables Figures
◭ ◮
◭ ◮
Back Close
Full Screen / Esc
Printer-friendly Version
Interactive Discussion increases the additional Cly offsets the decreasing efficiency of the ozone loss
pro-cesses. The combined effect is to limit the importance of any interannual variations of PSC altitudes on the integrated ozone loss.
5.3 Vertical redistribution of NOy
The vertical redistribution of NOy through denitrification at higher altitudes and
renitri-5
fication at lower altitudes has been widely cited as having a major impact on the accu-mulated ozone loss as the removal of NOylimits the deactivation of ClOxthrough
Reac-tion (R3). Significant denitrificaReac-tion in the Arctic only occurs in a few winters (1994/95, Sugita et al., 1998; 1995/96, Rex et al., 1997; 1999/2000, e.g. Popp et al., 2001 and 2004/05, Kleinb ¨ohl et al., 2005), which are the winters with the larger ozone losses
10
in the top right of Fig. 2. Denitrification in the majority of winters is negligible, even non-existent. When large-scale denitrification does occur, the enhanced ozone loss in the denitrified layer tends to be offset by reduced ozone loss in a lower, renitrified layer (e.g. Rex et al., 1997). The magnitude of this effect is investigated here by assuming a denitrification at 550 K of 5 ppb (Fig. 9a) and a concurrent renitrification of 5 ppb at
15
450 K (Fig. 9b). For a given ClOx, there is a greater sensitivity of ozone loss to changes
in NOy at 450 K. However at this level, the Cly and ClOx are lower and so the overall effect of this hypothetical de/renitrification on the vertically integrated ozone loss is lim-ited. Interestingly (but not conclusively) if one looks at particular years in Fig. 3, one can see indications of both denitrification and renitrification. For example in 1999/2000,
20
a year of extensive ozone loss and well observed denitrification, Fig. 3b shows higher than “expected” ozone loss at 450 K and less than “expected” at 400 K, consistent with the altitudes of the observed denitrification/renitrification (Popp et al., 2001).
5.4 Interannual variations in transport
A further process which could affect the chemical recovery is any in-mixing of air with
25
ACPD
10, 6681–6712, 2010Arctic ozone loss and polar stratospheric
clouds
N. R. P. Harris et al.
Title Page
Abstract Introduction
Conclusions References
Tables Figures
◭ ◮
◭ ◮
Back Close
Full Screen / Esc
Printer-friendly Version
Interactive Discussion be a significant influence on ozone loss in the Arctic vortex (Newman and Pyle, 2003)
despite the identification of individual events (e.g. Pyle et al., 1994).
6 Discussion and summary
We have updated and extended the previous studies reporting the empirical relation between accumulated ozone loss and PSC volume in the Arctic vortex (Rex et al.,
5
2004, 2006; Tilmes et al., 2004). Not only do the calculated results still hold with addi-tional winters, but it is also shown to hold on individual potential temperature surfaces albeit with greater scatter. At 400 K, the relationship is found to be slightly more signif-icant when cold aerosol activation is assumed in the place of NAT. This is consistent with the larger amounts of aerosol at 400 K than at higher altitudes. At higher potential
10
temperatures, the correlation with PSC areas deduced from NAT existence is better. This finding implies a smaller sensitivity of ozone loss to stratospheric aerosol loading than that found by Tilmes et al. (2008) in their assessment of the deliberate mainte-nance of an enhanced stratospheric aerosol layer as a geo-engineering response to climate change.
15
The compactness and linearity of the empirical results are interpreted using a photo-chemical box model with standard photochemistry. The aim is to identify the important mechanisms, not to reproduce the losses from winter to winter. More complete recon-structions have been successfully reported elsewhere using a 3-D CTM and analysed meteorological fields (Chipperfield et al., 2005; Tilmes, 2007). We show that the
princi-20
pal timescale for the extensive activation of chlorine is not the fast reaction of ClONO2
and HCl on NAT particles but is the re-supply of ClONO2 with photolysis of HNO3 as
the rate determining step. As a result, extensive activation in the Arctic vortex takes place with a timescale of days to weeks, and the overall activation depends on the continued (though not necessarily the continuous) presence of PSCs. The use ofVPSC
25
ACPD
10, 6681–6712, 2010Arctic ozone loss and polar stratospheric
clouds
N. R. P. Harris et al.
Title Page
Abstract Introduction
Conclusions References
Tables Figures
◭ ◮
◭ ◮
Back Close
Full Screen / Esc
Printer-friendly Version
Interactive Discussion The extent of ozone loss in any particular winter is found to depend most strongly
on the degree of initial activation and not so much on its timing or vertical distribution. This somewhat surprising finding occurs as a result of a number of offsetting factors. For any given air mass, there is the almost cancelling competition between ozone loss and chlorine deactivation, both of which rely on the photolysis in the near UV and so
5
accelerate as the Sun becomes higher in the sky in early spring. In the vertical, the effect of the decreasing number density with altitude is offset by the increasing levels of Cly, and in the few winters where denitrification occurs the increased ozone loss at the denitrified altitudes is offset by the decreased ozone loss at the lower altitudes where re-nitrification takes place. The baroclinicity of the vortex affects the degree of
10
denitrification (Mann et al., 2003): this would affect our conclusions about denitrification if the cold region were sufficiently deep that the renitrification occurred below the region of ozone loss. However this is very rare in the Arctic and has probably not occurred even in the years of extensive denitrification.
These findings raise a number of interesting possibilities for the development of
sim-15
ple parameterisations of stratospheric Arctic (or even polar) ozone loss in coupled chemistry climate models (CCMs), a step beyond the use of simple models to investi-gate future sensitivities (Knudsen et al., 2004; Tilmes et al., 2008). For example, the relationship shown in Fig. 2, which is derived in a period of high and nearly constant Cly, could be scaled by the levels of Cly calculated in the CCMs. As Cly decreases
20
so will ozone loss – but the effect of any changes in the occurrence of PSCs resulting from climate change would be allowed for. A slightly more sophisticated, but still very simple approach would be to develop a photochemical model based around the main factors described above, namely photolysis of nitric acid and Cl2O2, an activation
in-volving ClONO2on PSCs and initial levels of Cly. Both of these schemes would depend 25
ACPD
10, 6681–6712, 2010Arctic ozone loss and polar stratospheric
clouds
N. R. P. Harris et al.
Title Page
Abstract Introduction
Conclusions References
Tables Figures
◭ ◮
◭ ◮
Back Close
Full Screen / Esc
Printer-friendly Version
Interactive Discussion Additionally this work underlines the value of more analysis of the existing models to
see where simplifying assumptions are justified and where parameterisations might be made.
Acknowledgements. This work was supported by the EU Integrated Project SCOUT-O3 (505390-GOCE-CT-2004) and by the BMBF DYCHO project (FKZ07ATC08). NRPH thanks
5
NERC for an Advanved Research Fellowship. We thank the many ozonesonde personnel who have launched the ozonesondes used in this analysis. Michelle Santee and Peter Bernath pro-vided useful and helpful advice. Meteorological data were propro-vided by ECMWF and FU-Berlin. The ACE mission is supported primarily by the Canadian Space Agency. EOS Aura MLS is supported by NASA.
10
References
Anderson, J. G., Brune, W. H., and Proffitt, M. H.: Ozone destruction by chlorine radicals within the Antarctic vortex: the spatial and temporal evolution of C1O-O3anticorrelation based on in situ ER-2 data, J. Geophys. Res., 94(D9), 11465–11479, 1989.
Austin, J., Shindell, D., Beagley, S. R., Br ¨uhl, C., Dameris, M., Manzini, E., Nagashima, T.,
15
Newman, P., Pawson, S., Pitari, G., Rozanov, E., Schnadt, C., and Shepherd, T. G.: Uncer-tainties and assessments of chemistry-climate models of the stratosphere, Atmos. Chem. Phys., 3, 1–27, 2003,
http://www.atmos-chem-phys.net/3/1/2003/.
Bodeker, G. E., Shiona, H., and Eskes, H.: Indicators of Antarctic ozone depletion, Atmos.
20
Chem. Phys., 5, 2603–2615, 2005,
http://www.atmos-chem-phys.net/5/2603/2005/.
Burkholder, J. B., Orlando, J. J., and Howard, C. J.: Ultraviolet absorption cross sections of Cl2O2between 210 and 410 nm, J. Phys. Chem., 94, 687–695, 1990.
Carslaw, K. S., Luo, B., and Peter, T.: An analytic expression for the composition of aqueous
25
HNO3-H2SO4stratospheric aerosols including gas phase removal of HNO3, Geophys. Res. Lett., 22, 1877–1880, 1995.
Chen, H.-Y., Lien, C.-Y., Lin, W.-Y., Lee, Y. T., and Lin, J. J.: UV absorption cross sec-tions of ClOOCl are consistent with ozone degradation models, Science, 324, 781–784, doi:10.1126/science.1171305, 2009.
ACPD
10, 6681–6712, 2010Arctic ozone loss and polar stratospheric
clouds
N. R. P. Harris et al.
Title Page
Abstract Introduction
Conclusions References
Tables Figures
◭ ◮
◭ ◮
Back Close
Full Screen / Esc
Printer-friendly Version
Interactive Discussion Chipperfield, M. P., Feng, W., and Rex, M.: Arctic ozone loss and climate
sen-sitivity: Updated three-dimensional model study, Geophys. Res. Lett., 32, L11813, doi:10.1029/2005GL022674, 2005.
Damian, V., Sandu, A., Damian, M., Potra, F., and Carmichael, G. R.: The kinetic preprocessor KPP – a software environment for solving chemical kinetics, Comput. Chem. Eng., 26, 1567–
5
1579, 2000.
De Zafra, R. L., Jaramillo, M., Parrish, A., Solomon, P., Connor, B., and Barrett, J.: High concentrations of chlorine monoxide at low altitudes in the Antarctic spring stratosphere: diurnal variation, Nature, 328, 408–411, 1987.
Dobson, G. M. B.: Forty years’ research on atmospheric ozone at Oxford: a history, Appl.
10
Optics, 7(3), 387–405, 1968.
Drdla, K., Gandrud, B. W., Baumgardner, D., Wilson, J. C., Bui, T. P., Hurst, D., Schauffler, S. M., Jost, H., Greenblatt, J. B., and Webster, C. R.: Evidence for the widespread presence of liquid-phase particles during the 1999–2000 Arctic winter, J. Geophys. Res., 107, 8318, doi:10.1029/2001JD001127, 2002.
15
Eyring, V., Harris, N. R. P., Rex, M., Shepherd, T. G., Fahey, D. W., Amanatidis, G. T., Austin, J., Chipperfield, M. P., Dameris, M., Forster, P., Gettelman, A., Graf, H.F., Nagashima, T., Newman, P. A., Prather, M. J., Pyle, J. A.., Salawitch, R. J., Santer, B. D., and Waugh, D. W.: A strategy for process-oriented validation of coupled chemistry-climate models, Bull. Am. Met. Soc., 86, 1117–1133, 2005.
20
Eyring, V., Waugh, D. W., Bodeker, G. E., Cordero, E., Akiyoshi, H., Austin, J., Beagley, S. R., Boville, B. A., Braesicke, P., Br ¨uhl, C., Butchart, N., Chipperfield, M. P., Dameris, M., Deckert, R., Deushi, M., Frith, S. M., Garcia, R. R., Gettelman, A., Giorgetta, M. A., Kinnison, D. E., Mancini, E., Manzini, E., Marsh, D. R., Matthes, S., Nagashima, T., Newman, P. A., Nielsen, J. E., Pawson, S., Pitari, G., Plummer, D. A., Rozanov, E., Schraner, M., Scinocca, J. F.,
25
Semeniuk, K., Shepherd, T. G., Shibata, K., Steil, B., Stolarski, R. S., Tian, W., and Yoshiki, M.: Multimodel projections of stratospheric ozone in the 21st century, J. Geophys. Res., 112, D16303, doi:10.1029/2006JD008332, 2007.
Farman, J. C., Gardiner, B. G., and Shanklin, J. D.: Large losses of total ozone in Antarctica reveal seasonal ClOx/NOxinteraction, Nature, 315, 207–210, 1985.
30
ACPD
10, 6681–6712, 2010Arctic ozone loss and polar stratospheric
clouds
N. R. P. Harris et al.
Title Page
Abstract Introduction
Conclusions References
Tables Figures
◭ ◮
◭ ◮
Back Close
Full Screen / Esc
Printer-friendly Version
Interactive Discussion Harris, N. R. P., Kyr ¨o, E., Staehelin, J., Brunner, D., Andersen, S.-B., Godin-Beekmann, S.,
Dhomse, S., Hadjinicolaou, P., Hansen, G., Isaksen, I., Jrrar, A., Karpetchko, A., Kivi, R., Knudsen, B., Krizan, P., Lastovicka, J., Maeder, J., Orsolini, Y., Pyle, J. A., Rex, M., Vanicek, K., Weber, M., Wohltmann, I., Zanis, P., and Zerefos, C.: Ozone trends at northern mid- and high latitudes – a European perspective, Ann. Geophys., 26, 1207–1220, 2008,
5
http://www.ann-geophys.net/26/1207/2008/.
Harris, N. R. P., Lehmann, R., Rex, M., and von der Gathen, P.: Understanding the relation between Arctic ozone loss and the volume of polar stratospheric clouds, Int. J. Rem. Sens., 30(15), 4065–4070, 2009.
H ¨opfner, M., Pitts, M. C., and Poole, L. R.: Comparison between CALIPSO and
MI-10
PAS observations of polar stratospheric clouds, J. Geophys. Res., 114, D00H05, doi:10.1029/2009JD012114, 2009.
Jackson, D. R. and Orsolini, Y. J.: Estimation of Arctic ozone loss in winter 2004/05 based on assimilation of EOS MLS and SBUV/2 observations, Q. J. R. Meteorol. Soc., 134, 1833– 1841, doi:10.1002/qj.316, 2008.
15
Kleinb ¨ohl, A., Bremer, H., K ¨ullmann, H., Kuttippurath, J., Browell, E. V., Canty, T., Salaw-itch, R. J., Toon, G. C., and Notholt, J.: Denitrification in the Arctic mid-winter 2004/2005 observed by airborne submillimeter radiometry, Geophys. Res. Lett., 32(19), L19811, doi:10.1029/2005GL023408, 2005.
Knudsen, B. M., Harris, N. R. P., Andersen, S. B., Christiansen, B., Larsen, N., Rex, M., and
20
Naujokat, B.: Extrapolating future Arctic ozone losses, Atmos. Chem. Phys., 4, 1849–1856, 2004,
http://www.atmos-chem-phys.net/4/1849/2004/.
Mann, G.W., Davies, S., Carslaw, K. S., and Chipperfield, M. P.: Factors controlling Arctic denitrification in cold winters of the 1990s, Atmos. Chem. Phys., 3, 403–416, 2003,
25
http://www.atmos-chem-phys.net/3/403/2003/.
M ¨uller, R., Peter, Th., Crutzen, P. J., Oelhaf, H., Adrian, G. P., von Clarmann, Th., Wegner, A., Schmidt, U., and Lary, D.: Chlorine chemistry and the potential for ozone depletion in the arctic stratosphere in the winter of 1991/92, Geophys. Res. Lett., 21, 1427–1430, 1994. Murray, F. W.: On the computation of saturation vapor pressure, J. Appl. Meteor., 6, 203–204,
30
ACPD
10, 6681–6712, 2010Arctic ozone loss and polar stratospheric
clouds
N. R. P. Harris et al.
Title Page
Abstract Introduction
Conclusions References
Tables Figures
◭ ◮
◭ ◮
Back Close
Full Screen / Esc
Printer-friendly Version
Interactive Discussion Newman, P. A., Pyle, J. A., Austin, J., Braathen, G. O., Canziani, P. O., Carslaw, K. S., de F.
Forster, P. M., Godin-Beekmann, S., Knudsen, B. M., Kreher, K., Nakane, H., Pawson, S., Ramaswamy, V., Rex, M., Salawitch, R. J., Shindell, D. T., Tabazadeh, A., and Toohey, D. W.: Polar Stratospheric Ozone: Past and Future in Scientific Assessment of Ozone Depletion: 2002, Global Ozone Research and Monitoring Project – Report No. 47, World Meteorological
5
Organization, Geneva, Switzerland, 2003.
Newman, P. A., Rex, M., Canziani, P. O., Carslaw, K. S., Drdla, K., Godin-Beekmann, S., Golden D. M., Jackman, C. H., Kreher, K., Langematz, U., M ¨uller, R., Nakane, H., Orsolini, Y. J., Salawitch, R. J., Santee, M. L., von Hobe, M., and Yoden, S.: Polar Ozone: Past and Present in Scientific Assessment of Ozone Depletion: 2006, Global Ozone Research and Monitoring
10
Project – Report No. 50, World Meteorological Organization, Geneva, Switzerland, 2007. Papanastasiou, D. K., Papadimitriou, V. C., Fahey, D. W., and Burkholder, J. B.: UV absorption
spectrum of the ClO dimer (Cl2O2) between 200 and 420 nm, J. Phys. Chem. A., 113(49), 13711–13726, doi:10.1021/jp9065345, 2009.
Pitts, M. C., Thomason, L. W., Poole, L. R., and Winker, D. M.: Characterization of Polar
Strato-15
spheric Clouds with spaceborne lidar: CALIPSO and the 2006 Antarctic season, Atmos. Chem. Phys., 7, 5207–5228, 2007,
http://www.atmos-chem-phys.net/7/5207/2007/.
Pitts, M. C., Poole, L. R., and Thomason, L. W.: CALIPSO polar stratospheric cloud observa-tions: second-generation detection algorithm and composition discrimination, Atmos. Chem.
20
Phys., 9, 7577–7589, 2009,
http://www.atmos-chem-phys.net/9/7577/2009/.
Popp, P. J., Northway, M. J., Holecek, J. C., Gao, R. S., Fahey, D. W., Elkins, J. W., Hurst, D. F., Romashkin, P. A., Toon, G. C., Sen, B., Schauffier, S. M., Salawitch, R. J., Webster, C.R., Herman, R. L., Jost, H., Bui, T. P., Newman, P. A., and Lait L. R.: Severe and extensive
25
denitri?cation in the 1999–2000 Arctic winter stratosphere, Geophys. Res. Lett., 28, 2875– 2878, 2001.
Rex, M., Harris, N. R. P., von der Gathen, P., Lehmann, R., Braathen, G. O., Reimer, E., Beck, A., Chipperfield, M. P., Alfier, R., Allaart, M., O’Connor, F., Dier, H., Dorokhov, V., Fast, H., Gil, M., Kyro, E., Litynska, Z., Mikkelsen, I. S., Molyneux, M. G., Nakane, H., Notholt, J.,
30
ACPD
10, 6681–6712, 2010Arctic ozone loss and polar stratospheric
clouds
N. R. P. Harris et al.
Title Page
Abstract Introduction
Conclusions References
Tables Figures
◭ ◮
◭ ◮
Back Close
Full Screen / Esc
Printer-friendly Version
Interactive Discussion Rex, M., Salawitch, R. J., Harris, N. R. P., von der Gathen, P., Braathen, G. O., Schulz, A.,
Deckelmann, H., Chipperfield, M. P., Sinnhuber, B.-M., Reimer, E., Alfier, R., Bevilacqua, R., Hoppel, K., Fromm, M., Lumpe, J., Kuellmann, H., Kleinbohl, A., Bremer, H., von Konig, M., Kunzi, K., Toohey, D., Vomel, H., Richard, E., Aikin, K., Jost, H., Greenblatt, J. B., Loewen-stein, M., Podolske, J. R., Webster, C. R., Flesch, G. J., Scott, D. C., Herman, R. L., Elkins,
5
J. W., Ray, E. A., Moore, F. L., Hurst, D. F., Romashkin, P., Toon, G. C., Sen, B., Margitan, J. J., Wennberg, P., Neuber, R., Allart, M., Bojkov, B. R., Claude, H., Davies, J., Davies, W., De Backer, H., Dier, H., Dorokhov, V., Fast, H., Kondo, Y., Kyro, E., Litynska, Z., Mikkelsen, I. S., Molyneux, M. J., Moran, E., Nagai, T., Nakane, H., Parrondo, C., Ravegnani, F., Skri-vankova, P., Viatte, P., and Yushkov, V.: Chemical loss of Arctic ozone in winter 1999/2000,
10
J. Geophys. Res., 107(D20), 8276, doi:10.1029/2001JD000533, 2002.
Rex, M., Salawitch, R. J., von der Gathen, P., Harris, N. R. P., Chipperfield, M. P., and Naujokat, B.: Arctic ozone loss and climate change, Geophys. Res. Lett., 31, LO4116, doi:10.1029/2003GL018844, 2004.
Rex, M, Salawitch, R. J., Deckelmann, H., von der Gathen, P., Harris, N. R. P., Chipperfield,
15
M. P., Naujokat, B., Reimer, E., Allaart, M., Andersen, S. B., Bevilacqua, R., Braathen, G. O., Claude, H., Davies, J., De Backer, H., Dier, H., Dorokov, V., Fast, H., Gerding, M., Godin-Beekmann, S., Hoppel, K., Johnson, B., Kyr ¨o, E., Litynska, Z., Moore, D., Nakane, H., Parrondo, M. C., Risley, A. D., Skrivankova, P., St ¨ubi, R., Viatte, P., Yushkov, V., and Zerefos, C.: Arctic winter 2005: Implications for stratospheric ozone loss and climate change,
20
Geophys. Res. Lett., 33, L23808, doi:10.1029/2006GL026731, 2006.
Sander, S. P., Finlayson-Pitts, B. J, Friedl, R. R., Golden, D. M., Huie, R. E., Keller-Rudek, H., Kolb, C. E., Kurylo, M. J., Molina, M. J., Moortgat, G. K., Orkin, V. L., Ravishankara, A. R., and Wine, P. H.: Chemical kinetics and photochemical data for use in atmospheric studies, evaluation number 15, JPL Publication 06-2, Jet Propulsion Laboratory, Pasadena, 2006.
25
Santee, M. L., MacKenzie, I. A., Manney, G. L., Chipperfield, M. P., Bernath, P. F., Walker, K. A., Boone, C. D., Froidevaux, L., Livesey, N.J., and Waters, J. W.: A study of stratospheric chlorine partitioning based on new satellite measurements and modeling, J. Geophys. Res., 113, D12307, doi:10.1029/2007JD009057, 2008.
Schmidt, U., Bauer, R., Engel, A., Borchers, R., and Lee, J.: The variation of available chlorine
30
ACPD
10, 6681–6712, 2010Arctic ozone loss and polar stratospheric
clouds
N. R. P. Harris et al.
Title Page
Abstract Introduction
Conclusions References
Tables Figures
◭ ◮
◭ ◮
Back Close
Full Screen / Esc
Printer-friendly Version
Interactive Discussion Schulz, A., Rex, M., Harris, N. R. P., Braathen, G. O., Reimer, E., Alfier, R., Kilbane-Dawe,
I., Eckermann, S., Allaart, M., Alpers, M., Bojkov, B., Cisneros, J., Claude, H., Cuevas, E., Davies, J., De Backer, H., Dier, H., Dorokhov, V., Fast, H., Godin, S., Johnson, B., Kondo, Y., Kosmidis, E., Kyro, E., Litynska, Z., Mikkelsen, I. S., Molyneux, M., Murphy, G., Nakane, H., Connor, F. O., Parrondo, C., Schmidlin, F. J., Skrivankova, P., Varotsos, C., Vialle, C.,
5
Viatte, P., Yushkov, V., Zerefos, C., and von der Gathen, P.: Arctic ozone loss in threshold conditions: Match observations in 1997/98 and 1998/99, J. Geophys. Res., 106, 7495–7503, 2001.
Solomon, P. M., Connor, B., de Zafra, R. L., Parrish, A., Barrett, J., and Jaramillo, M.: High concentrations of chlorine monoxide at low altitudes in the Antarctic spring stratosphere:
10
secular variation, Nature, 328, 411–413, 1987.
Sugita, T., Kondo, Y., Nakajima, H., Schmidt, U., Engel, A., Oelhaf, H., Wetzel, G., Koike, M., and Newman, P. A.: Denitrification observed inside the Arctic vortex in February 1995, J. Geophys. Res., 103, 16221–16223, 1998.
Tilmes, S., M ¨uller, R., Grooß, J.-U., and Russell III, J. M.: Ozone loss and chlorine activation
15
in the Arctic winters 1991–2003 derived with the tracer-tracer correlations, Atmos. Chem. Phys., 4, 2181–2213, 2004,
http://www.atmos-chem-phys.net/4/2181/2004/.
Tilmes, S., Kinnison, D. E., Garcia, R. R., M ¨uller, R., Sassi, F., Marsh, D. R., and Boville, B. A.: Evaluation of heterogeneous processes in the polar lower stratosphere
20
in the Whole Atmosphere Community Climate Model, J. Geophys. Res., 112, D24301, doi:10.1029/2006JD008334, 2007.
Tilmes, S. and M ¨uller, R.: The sensitivity of polar ozone depletion to proposed geoengineering schemes, Science, 320, 1201, doi:10.1126/science.1153966, 2008.
von der Gathen, P., Rex, M., Harris, N. R. P., Lucic, D., Knudsen, B., Braathen, G. O., de Backer,
25
H., Fabian, R., Fast, H., Gil, M., Kyro, E., Mikkelsen, I. S., Rummukainen, M., Staehelin, J., and Varotsos, C.: Chemical depletion of ozone observed in the Arctic Vortex during the 1991/1992 winter, Nature, 375, 131–134, 1995.
von Hobe, M., Stroh, F., Beckers, H., Benter, T., and Willner, H.: The UV/Vis absorption spec-trum of matrix-isolated dichlorine peroxide, ClOOCl, Phys. Chem. Chem. Phys., 11, 1571–
30
ACPD
10, 6681–6712, 2010Arctic ozone loss and polar stratospheric
clouds
N. R. P. Harris et al.
Title Page
Abstract Introduction
Conclusions References
Tables Figures
◭ ◮
◭ ◮
Back Close
Full Screen / Esc
Printer-friendly Version
Interactive Discussion Fig. 1.Evolution of chlorine species inside the Arctic vortex at 460 K in the 2004/05 winter. The
ACPD
10, 6681–6712, 2010Arctic ozone loss and polar stratospheric
clouds
N. R. P. Harris et al.
Title Page
Abstract Introduction
Conclusions References
Tables Figures
◭ ◮
◭ ◮
Back Close
Full Screen / Esc
Printer-friendly Version
Interactive Discussion Fig. 2. Integrated ozone loss as a function of VPSC for 1992/93 to 2008/09. No values are
ACPD
10, 6681–6712, 2010Arctic ozone loss and polar stratospheric
clouds
N. R. P. Harris et al.
Title Page
Abstract Introduction
Conclusions References
Tables Figures
◭ ◮
◭ ◮
Back Close
Full Screen / Esc
Printer-friendly Version
Interactive Discussion Fig. 3.Integrated ozone loss as a function ofAPSCfor 1992/93 to 2008/09. Other details given
ACPD
10, 6681–6712, 2010Arctic ozone loss and polar stratospheric
clouds
N. R. P. Harris et al.
Title Page
Abstract Introduction
Conclusions References
Tables Figures
◭ ◮
◭ ◮
Back Close
Full Screen / Esc
Printer-friendly Version
Interactive Discussion Fig. 4.The evolution of ClOx(=ClO+2Cl2O2+2Cl2), HCl and ClONO2for an idealised trajectory
ACPD
10, 6681–6712, 2010Arctic ozone loss and polar stratospheric
clouds
N. R. P. Harris et al.
Title Page
Abstract Introduction
Conclusions References
Tables Figures
◭ ◮
◭ ◮
Back Close
Full Screen / Esc
Printer-friendly Version
Interactive Discussion Fig. 5.The evolution of ClOx, HCl and ClONO2for an idealised trajectory at 50 hPa with a one
ACPD
10, 6681–6712, 2010Arctic ozone loss and polar stratospheric
clouds
N. R. P. Harris et al.
Title Page
Abstract Introduction
Conclusions References
Tables Figures
◭ ◮
◭ ◮
Back Close
Full Screen / Esc
Printer-friendly Version
Interactive Discussion Fig. 6.The photolysis rates of HNO3and Cl2O2at 50 hPa in the Arctic vortex as a function of
ACPD
10, 6681–6712, 2010Arctic ozone loss and polar stratospheric
clouds
N. R. P. Harris et al.
Title Page
Abstract Introduction
Conclusions References
Tables Figures
◭ ◮
◭ ◮
Back Close
Full Screen / Esc
Printer-friendly Version
Interactive Discussion Fig. 7. Ozone loss calculated for an air parcel with an initial chlorine activation of 3 ppb ClOx
ACPD
10, 6681–6712, 2010Arctic ozone loss and polar stratospheric
clouds
N. R. P. Harris et al.
Title Page
Abstract Introduction
Conclusions References
Tables Figures
◭ ◮
◭ ◮
Back Close
Full Screen / Esc
Printer-friendly Version
Interactive Discussion Fig. 8.Integrated ozone loss as a function of initial activation on the 450 K (green), 500 K (blue)
ACPD
10, 6681–6712, 2010Arctic ozone loss and polar stratospheric
clouds
N. R. P. Harris et al.
Title Page
Abstract Introduction
Conclusions References
Tables Figures
◭ ◮
◭ ◮
Back Close
Full Screen / Esc
Printer-friendly Version
Interactive Discussion Fig. 9.The integrated ozone loss as a function of initial activation on the(a)550 K and(b)450 K