THE MATERIAL FLOW ON AGRICULTURAL FARMS
MATERIÁLOVÝ TOK V ZEMEDELSKÝCH PODNICÍCH
D. VANECEK, KALÁB D.
ABSTRAKT
Prestože význam logistiky v prumyslu, obchodu a dalších oborech je všeobecne uznáván, v zemedelství není tato problematika systematicky zkoumána. Predpokladem podrobných analýz je znalost objemu a struktury materiálového toku. Autori k tomuto úcelu navrhli vlastní metodiku, která vychází z technologických ukazatelu, publikovaných Ministerstvem zemedelství CR pro jednotlivé plodiny a kategorie zvírat. Tyto publikované normativní hodnoty Ministerstva pak slouží jako základní kameny, jejichž kombinací lze zjistit objem materiálového toku a jeho strukturu v podniku behem jednoho roku. Výhodou metodiky je rychlé zjištení potrebných dat a možnost zohlednení nekterých specifických podmínek ve zkoumaných podnicích.
KLÍCOVÁ SLOVA: materiálový tok, manipulace s materiálem, logistika v zemedelství.
Príspevek vzniknul na základe financování výzkumu z grantu MSM122200002
ABSTRACT
In spite that the great importance of logistics in industry, business and other branches is generally acknowledged, this problem is not systematically investigated in agriculture. As a presumption of detailed analysis, the knowledge of the volume and structure of the material flow is necessary. The authors have proposed their own methodical procedure which issues from technological indicators, published by the Czech Ministry of Agriculture for individual plants and categories of animals and which makes possible further classification of these data for enterprises with different level of farming. These published standards of the Ministry serve as basic stones and by means of their combination, the volume of material flow and its structure is possible to calculate during one year's periods. The advantage of proposed method is a fast finding out of necessary data and possibility of taking into account some specific conditions in investigated enterprises.
KEY WORDS: material-flow, manipulation with material, logistics in agriculture.
D. VANECEK, KALÁB D.
DETAILED ABSTRACT
Logistika je pomerne nová vední disciplina, která se zabývá rízením materiálového toku od dodavatele surovin, pres vlastní výrobní transformaci až ke konecnému spotrebiteli. Autori se zamerili na tu cást materiálového toku, která se realizuje v podniku. Aby se mohl tento tok úspešne rídit, je treba znát jeho objem a strukturu v prubehu kalendárního roku.
Stanovit objem a strukturu materiálového toku lze nekolika zpusoby, napríklad odhadem dle zkušeností nebo na základe úcetních dokladu. Každá z techto metod má své výhody a nevýhody. Proto jsme navrhli metodu, vycházející z normativních technologických ukazatelu pro jednotlivé plodiny a druhy hospodárských zvírat. Normativní ukazatele publikoval v roce 1998 KAVKA a kol.. Jsou stanoveny nejen pro odlišné výrobní procesy, ale i pro tri ruzné úrovne intenzity výroby. Na základe techto normativu jsme sestavili tabulky pro jednotlivé výrobky, obsahující konkrétní vstupy a jejich množství na hektar oseté plochy nebo na jedno zvíre, chované po celý kalendární rok. Vynásobením techto materiálových normativu konkrétními výmerami jednotlivých plodin nebo poctem zvírat v dané kategorii lze zjistit celkovou potrebu jednotlivých materiálu za kalendární rok.
Navržená metoda je jednoduchá, vyžaduje však urcité úpravy po konzultaci vedoucími pracovníky podniku. V zemedelství totiž hraje velkou úlohu meziprodukt (výroba píce pro živocišnou výrobu, využití vyrobené chlévské mrvy nebo kejdy pro hnojení v rostlinné výrobe). Mechanické použití normativu materiálového toku by mohlo vést k tomu, že by výroba píce mohla být vetší ci menší než je potreba ustájených zvírat nebo že by výroba chlévské mrvy byla vetší ci menší než je potreba v rostlinné výrobe. Tyto prípadné rozdíly je treba pred výpoctem dalších ukazatelu konzultovat a upravit.
Metoda byla vyzkoušena v zemedelském podniku CIZ-AGRO, a.s., okres Jindrichuv Hradec. Zemedelský podnik má 2 858 ha zemedelské pudy a chová skot a prasata. Celkový objem materiálového toku za rok cinil (bez vody) 72 996 t, to je v prepoctu 25,54 t/ha z.p. Voda zaujímá nejvetší objem, at již se jedná o chemické postriky nebo o spotrebu ve stájích. Protože však manipulace s vodou je snadná (vodovodní kohoutek), rozhodli jsme se s ní dále nepocítat, aby tak nedocházelo k jistému zkreslování. Z ostatních materiálu byla na prvním míste kejda (25,4 %, chlévská mrva 16,9 , obilní zrno 11,0, sláma 10,4, kukurice na siláž 9,1, zelené krmení 8,3 atd.).
Protože z hlediska logistiky není rozhodující jen velikost a struktura materiálového toku, ale též pocet manipulací, kterým jsou jeho jednotlivé složky podrobeny, zabývali jsme se i tímto problémem. Za jednu manipulaci bylo považováno jedno naložení a jedno složení urcitého materiálu. Napríklad s kejdou se manipulovalo jen 1x, s chlévskou mrvou 2x, s obilním zrnem 3x. V prumeru se s každým materiálem manipulovalo 1,53x. Pro podnik je však duležitejší, zda tyto manipulace jsou provádeny mechanizovane nebo rucne a všechny zbytecné manipulace a na ne navazující skladování by mely být odstraneny. Použití metodiky vedlo k odhalení nekterých slabých míst, na které by se logistika v podniku mela dále zamerovat. Pro použití navržené metody navrhli autori následující postup:
Provést kalkulaci pro výpocet objemu a struktury materiálového toku.
Upresnit získané výsledky s vedením podniku, predevším s ohledem na velikost meziproduktu.
S ohledem na pocet manipulací vypocítat celkový objem manipulovaného materiálu a urcit základní ukazatele, charakterizující materiálový tok.
Vyjádrit a posoudit rozsah rucní manipulace a navrhnout opatrení k jejich snížení. Posoudit vhodnost meziskladu z hlediska skladovaného materiálu
1. INTRODUCTION
At present time the importance of logistics is increasing in many economic branches, especially in industry and business. Logistics is considered to be a science, dealing with integrated management of all the material and corresponding information flow from suppliers through transformation of input materials till to the final consumer. Though there are no unified definitions of logistics, most of the authors agree with this explanation. The importance and the volume of material and information flow increases especially in contemporary global environment, when subjects from different countries and continents integrate into production and business. To manage the material and information flow successfully, it is necessary to have a good overview concerning its volume and structure. This article dealt with these problems, applied on agricultural enterprises.
2. THE MATERIAL FLOW
Material flow in agriculture has some specifications, which result from:
?? The choice of planted cultures and breeding animals [specialization of production], ?? The percentage share of different plants and
sorts of animals in the enterprise [production structure],
?? The chosen production intensity In the prevailing part of industrial production, dealing with rough-working of input materials or their assemblage, we can see, that concerning the volume of material flow:
?? Inputs = outputs, or: ?? Inputs = outputs + waste
But in plant production, as a consequence of photosynthesis, the volume of harvested plants substantially exceeds the volume of all input elements [seeds, fertilizers, chemicals for plant protection]. Here:
?? Inputs ? output + waste
This is valid both for market cultures and interproduct, which is in agriculture fodder for own animal production. As waste there is usually straw or a percentage of the production, which doesn't
In animal production, the situation is opposite. Fattening of young animals lasts weeks, months and so inputs exceed outputs, considered as the weight of animals for slaughterhouse. The same situation is in milk production too, when a cow needs daily a grand quantity of green fodder, but gives us only 10 - 20 liter milk daily. For this situation there is valid:
?? Inputs ? output + waste
We see, that according to the chosen production structure, the enterprise will have preponderance of outputs over inputs [enterprises specialized in plant production only] or inputs will preponder over outputs [enterprises with universal production or oriented on animal production]. The number of different inputs and outputs is in agriculture limited in comparison with industrial production.
Inputs are mostly seed for sowing, seed potatoes, industrial fertilizers, chemicals for plant protection or agriculture interproduct [hay, silage, haylage for animal production, farm manure and farm sewage for plant production and also drinkable and technological water]. With regard to a complicated financial situation of our agricultural enterprises in the last years, the volume of purchased inputs decreased, especially these concerning industrial fertilizers.
Outputs are planned market products, for example wheat, potatoes, milk, meat, eggs. But at the same time, with demanded products produces agriculture logistical waste too, for example farm manure, sewage. These materials are reversibly processed as inputs for plant production.
Calculation of material flow volume and structure in agricultural enterprises can be carried out by means of three main methods:
?? by estimation of staff management, ?? on the basis of accounting data, ?? on the basis of standards
D. VANECEK, KALÁB D.
Tab. 1: Necessary material volume for 1 ha wheat [kg/ha].
low intensity medium intensity high intensity material
inputs outputs inputs outputs inputs outputs
limestone 500 --- 500 --- 500 ---
industrial fertilizers 486 --- 704 --- 699,8 --- organic fertilizers 800 --- 800 --- 800 ---
seed for sowing 210 --- 210 --- 210 ---
plant protection
[chemicals +water] 645 --- 948 --- 1 824 --- harvested grain ---- 4 000 --- 5 500 --- 6 500
straw ---- 4 800 --- 6 600 --- 7 800
TOTAL 2 641 8 800 3 162 12 100 4 033,8 14 300
Next materials participating in the material flow in other cultures can be: potatoes, flax, dry forage [hay], haulage, silage etc.
Tab. 2: Necessary material volume for 1 cow per year
low intensity medium intensity high intensity material
input output input output input output manipulation [loading,
unloading and transfer of cows
to stables] 306 210 371 246 423 275
straw 3 000 --- 3 000 --- 3 000 ---
concentrated fodder 1 136 --- 1 317 --- 1 696 --- water [drinking +
technological] 20 075 --- 22 995 --- 25 500 ---
conserved + fresh fodder 12 045 --- 12 775 --- 13 505 ---
milk production --- 5 200 --- 5 800 --- 7 500
farm manure --- 10 000 --- 11 000 --- 12 000
TOTAL 44 174 19 969 40 458 17 046 36 562 15 416
Tab. 3: Necessary material volume for elected agricultural commodities, high intensity [kg/ha] and agricultural animals [kg/head/year]
plant inputs outputs animals inputs outputs potatoes 22 270 21 000 cow 41 735,80 19 768,50 sugar beat 19 241 50 000 cattle breading 16 322,74 444,50 spring barley [for
breweries] 14 547 11 000 cattle fattening 27 335,00 5 146,20 winter barley 10 366 12 900 sow 6 571,60 7 621,60 maize - silage 18 109 40 000 pigg - fattening 5 209,25 7 725,77
meadows 1 950 5 600
leguminose-grain mixture
[fresh forage] 9 165 27 000
oats 9 849 11 000
pastures 742 30 000
wheat - grain 11 253 14 800
rape 17 365 4 000
3. MATERIAL AND METHOD
Necessary steps for evaluating of material flow per year in agricultural enterprise
To calculate the volume of material flow [with regard to cultivated plants and breeding animals]. As the result we can see, what kinds of material have the biggest volume and these should be later analyzed in details.
To specify the calculated volume of material flow in consultations with managers, especially problems which concern the volume of interproducts. There must be a balance between production of produced straw and needed volume of straw as a litter, between production of fodder [fresh and conserved] and its necessary needed volume for animals as fodder. It is not possible to consume more than is produced and produce more than is necessary. To arrange the sequence of materials according to their tons- volume and indicate for every material the necessary number of manipulations [one manipulation = one loading and one unloading]. One manipulation is for example: loading of sacks at the railroad station from wagons into tractor trailers and later their unloading in the store, transport of grain from harvester to the drying equipment, transport of silage maize from the field [loading by harvester] to the silage pit etc. By multiplying these values by actual material flow in tons we receive the total volume of one times manipulated materials. Special regard should be focused on manual manipulation. Manipulations carried out by suppliers or customers are not calculated.
To evaluate all store capacities from the view of their construction, used technology, used mechanization, loses on quality and quantity of stored material and their capacity.
To propose some rationalization alternatives. As a result of these steps we receive following indicators:
Resulting indicators:
a] volume of material flow/ha of agricultural land in tons and in % [volume of material inputs and outputs separately and as a complex]
b] volume of material flow/worker [t]
c] relation of material outputs to material inputs, [productivity of material]
d] number of manipulations with individual material kinds and total volume of once manipulated
materials
- volume of the material flow [t/ha] x number of manipulations
e] total volume of 1x manipulated material/ha of agricultural land,
f] total volume of 1x manipulated material/ worker g] volume of material 1x manipulated manually
4. RESULTS
Application of proposed method in agricultural farm
For application the cooperative ZD Telc was chosen, which manages its 2858 ha of agricultural land in the region 480 m above the sea level. The total number of employees is 160, from this amount 103 are active in plant and animal production. There was following production structure in 2001:
Tab. 4: Production structure in plant production and in animal production
Plant hectares Category of animals number of heads
wheat 560 dairy cows 631
rye 145 calves [to 6 months of age] 290
barley 445 heifers 365
oats 151 bulls for fattening 582
rape 224 sows 454
peas 52 fattening pigs 2 147
potatoes 95
maize for silage 297 other fodder crops 107
meadows 687
D. VANECEK, KALÁB D.
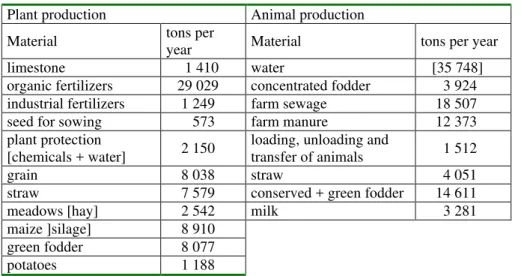
Tab. 5: The material-flow volume in the year 2001
Plant production Animal production
Material tons per year Material tons per year
limestone 1 410 water [35 748]
organic fertilizers 29 029 concentrated fodder 3 924 industrial fertilizers 1 249 farm sewage 18 507 seed for sowing 573 farm manure 12 373 plant protection
[chemicals + water] 2 150 loading, unloading and transfer of animals 1 512
grain 8 038 straw 4 051
straw 7 579 conserved + green fodder 14 611
meadows [hay] 2 542 milk 3 281
maize ]silage] 8 910 green fodder 8 077
potatoes 1 188
Calculation of material-flow volume on the basis of proposed standards
2. Specifying the material - flow calculation
Calculation on the basis of standards must be discussed with the farm management and adjusted if needed, because every enterprise adjusts technological processes, which can then differ from the basic standard processes. In our investigation there were following specifications needed:
Agriculture enterprise ZD Telc doesn't manage plant protection with own machines and application of industrial fertilizers too, but orders them from a specialized service enterprise. For this reason there is a cut - down of 2 150 t [mostly transport of water for applying of chemicals] and 1 249 t of industrial fertilizers.
Calculated volume of straw has been adjusted, because production makes 7 579 t, but consumption only at about a half [4 051 t]. For next calculation wee took higher value because the surplus can be stored on the fields.
Similar difference is at green and conserved fodder, mostly because of different specific weights of these kinds of fodder in this way of calculation. For next
calculation wee took the necessary demand for fodder in animal production, not the calculated harvested quantity. The production must be adjusted not only in calculation, but in reality, too.
The sequence of most important kinds of material [after adjustment]
The biggest part of material flow falls on drinking and technological water in animal production. But because manipulation with water is easy [by means of water tap], this liquid material will not be taken next into consideration. But it has a great economic importance, 1m3 of water costs environ 40 crowns,
that is in our case nearly 1,5 million crowns per year. Calculation of indicators
Share of material flow per 1 ha of agricultural land: 72 996 / 2 858 = 25,54 tons
Share of material flow per 1 worker in plant or animal production:
72 996 /103 = 708,7 t / worker Share of outputs: inputs
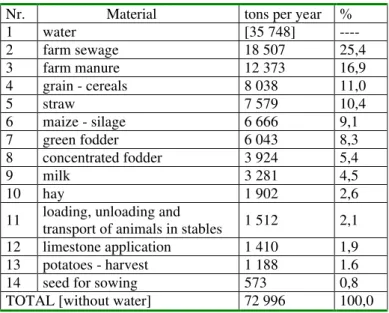
Tab. 6: Adjusted calculation of material flow in ZD Telc in 2001
Nr. Material tons per year %
1 water [35 748] ----
2 farm sewage 18 507 25,4
3 farm manure 12 373 16,9
4 grain - cereals 8 038 11,0
5 straw 7 579 10,4
6 maize - silage 6 666 9,1
7 green fodder 6 043 8,3
8 concentrated fodder 3 924 5,4
9 milk 3 281 4,5
10 hay 1 902 2,6
11 loading, unloading and transport of animals in stables 1 512 2,1 12 limestone application 1 410 1,9
13 potatoes - harvest 1 188 1.6
14 seed for sowing 573 0,8
TOTAL [without water] 72 996 100,0
Tab. 7: Manipulated inputs and outputs without interproduct
Inputs Outputs
Material tons Material tons
concentrated fodder 3 924 grain [cereals] 8 038
limestone 1 410 milk 3 281
seed for sowing 573 potatoes 1 188
Total 5 907 Total 12 507
Relation [outputs]: [inputs] = 1,53
This indicator indicates the effect of biological process in agriculture and share of outsorcing services, too.
3. Number of manipulations with material
Not only the volume of materials, but also the number of manipulation with them is necessary,
D. VANECEK, KALÁB D.
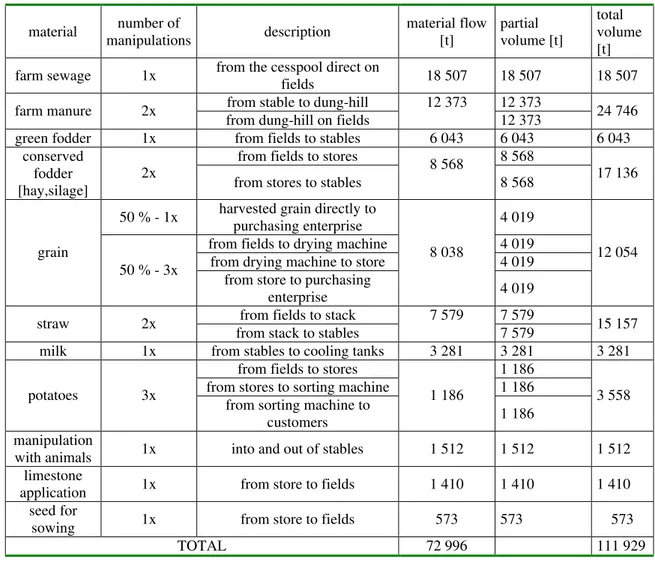
Tab. 8: Number of manipulations
material manipulations number of description material flow [t] partial volume [t] total volume [t] farm sewage 1x from the cesspool direct on fields 18 507 18 507 18 507
from stable to dung-hill 12 373
farm manure 2x from dung-hill on fields 12 373 12 373 24 746
green fodder 1x from fields to stables 6 043 6 043 6 043
from fields to stores 8 568
conserved fodder
[hay,silage] 2x from stores to stables
8 568
8 568 17 136
50 % - 1x harvested grain directly to purchasing enterprise 4 019 from fields to drying machine 4 019 from drying machine to store 4 019 grain
50 % - 3x
from store to purchasing enterprise
8 038
4 019
12 054
from fields to stack 7 579
straw 2x
from stack to stables
7 579
7 579 15 157 milk 1x from stables to cooling tanks 3 281 3 281 3 281
from fields to stores 1 186
from stores to sorting machine 1 186 potatoes 3x
from sorting machine to customers
1 186
1 186
3 558
manipulation
with animals 1x into and out of stables 1 512 1 512 1 512 limestone
application 1x from store to fields 1 410 1 410 1 410
seed for
sowing 1x from store to fields 573 573 573
TOTAL 72 996 111 929
In average, every material is manipulated 1,53 times [111 929 : 72 996]. This cannot be seen as
disadvantage, if manipulation is carried out by means of machines. The volume of manipulated materials per 1 hectare increases so to 25,54 x 1,53 = 39,08 tons and per one worker in production to 111 929: 103 = 1 087 tons.
4. Manual manipulation
Manual manipulation prevails at seed for sowing. Firstly sacks with this material are loaded on tractors and transported to fields. On fields the material is transferred to machines manually. By means of new technologies this activity can be carried out mechanically, too.
Other sphere of manual work is when loading and unloading animals in stables. There no mechanization can be used, but some arrangement must be used to decrease the manual effort and to avoid the stress of animals.
The last points of proposed method [store capacities and rationalization] are not a part of this article.
5. CONCLUSIONS
material-flow, which occupies the greatest volume or on the greatest volume of manually manipulated materials.
LITERATURE
?1? KAVKA a kol.: Technologické, technické a ekonomické normativní ukazatele pro zemedelství CR. MZ CR, Praha 1998. ?2? GROS, I.: Logistika. VŠCHT Praha, 1996 ?3? PERNICA P.: Logistický management.
Radix, Praha, 1998
?4? PERNICA P., MOSOLF H.J.: Partnership in logistics. Radix, Praha 2000
?5? KORTSCHAK B.: Úvod do logistiky. Babtext Praha, 1994
D. VANECEK, KALÁB D.
Prof.Ing. Drahoš Vanecek, e-mail: [email protected]
CSc., Jihoceská univerzita, zemedelská fakulta, Katedra rízení, Studentská 13, 370 05 Ceské Budejovice, Ceská republika
Tel: +420 38 777 2484,
Ing. Dalibor Kaláb, e-mail: [email protected]
Jihoceská univerzita, zemedelská fakulta, Katedra rízení, Studentská 13, 370 05 Ceské Budejovice, Ceská republika
![Tab. 3: Necessary material volume for elected agricultural commodities, high intensity [kg/ha] and agricultural animals [kg/head/year]](https://thumb-eu.123doks.com/thumbv2/123dok_br/18332132.350991/4.892.184.766.772.1061/necessary-material-elected-agricultural-commodities-intensity-agricultural-animals.webp)