Simultaneous Hypoxia and Low Extracellular
pH Suppress Overall Metabolic Rate and
Protein Synthesis In Vitro
Brita Singers Sørensen*, Morten Busk, Jens Overgaard, Michael R. Horsman, Jan Alsner
Department of Experimental Clinical Oncology, Aarhus University Hospital, Aarhus, Denmark
*bsin@oncology.au.dk
Abstract
Background
The tumor microenvironment is characterized by regions of hypoxia and acidosis which are linked to poor prognosis. This occurs due to an aberrant vasculature as well as high rates of glycolysis and lactate production in tumor cells even in the presence of oxygen (the War-burg effect), which weakens the spatial linkage between hypoxia and acidosis.
Methods
Five different human squamous cell carcinoma cell lines (SiHa, FaDuDD, UTSCC5,
UTSCC14 and UTSCC15) were treated with hypoxia, acidosis (pH 6.3), or a combination, and gene expression analyzed using microarray. SiHa and FaDuDDwere chosen for further
characterization of cell energetics and protein synthesis. Total cellular ATP turnover and rel-ative glycolytic dependency was determined by simultaneous measurements of oxygen consumption and lactate synthesis rates and total protein synthesis was determined by autoradiographic quantification of the incorporation of35S-labelled methionine and cysteine into protein.
Results
Microarray analysis allowed differentiation between genes induced at low oxygen only at normal extracellular pH (pHe), genes induced at low oxygen at both normal and low pHe,
and genes induced at low pHeindependent of oxygen concentration. Several genes were
found to be upregulated by acidosis independent of oxygenation. Acidosis resulted in a more wide-scale change in gene expression profiles than hypoxia including upregulation of genes involved in the translation process, for example Eukaryotic translation initiation factor 4A, isoform 2 (EIF4A2), and Ribosomal protein L37 (RPL37). Acidosis suppressed overall ATP turnover and protein synthesis by 50%. Protein synthesis, but not total ATP production, was also suppressed under hypoxic conditions. A dramatic decrease in ATP turnover (SiHa) and protein synthesis (both cell lines) was observed when hypoxia and low pHewere
combined.
a11111
OPEN ACCESS
Citation:Sørensen BS, Busk M, Overgaard J, Horsman MR, Alsner J (2015) Simultaneous Hypoxia and Low Extracellular pH Suppress Overall Metabolic Rate and Protein Synthesis In Vitro. PLoS ONE 10(8): e0134955. doi:10.1371/journal.pone.0134955
Editor:Ester Hammond, University of Oxford, UNITED KINGDOM
Received:April 13, 2015
Accepted:July 15, 2015
Published:August 14, 2015
Copyright:© 2015 Sørensen et al. This is an open access article distributed under the terms of the Creative Commons Attribution License, which permits unrestricted use, distribution, and reproduction in any medium, provided the original author and source are credited.
Data Availability Statement:All relevant data are within the paper and its Supporting Information files. All included array data is available at GEO, NCBI, with the accession number GSE70051.
Conclusions
We demonstrate here that the influence of hypoxia and acidosis causes different responses, both in gene expression and in de novo protein synthesis, depending on whether the two factors induced alone or overlapping, and as such it is important for in vivo studies to take this into account.
Introduction
Solid malignant tumors are characterized by an inadequate vascular system, which can give rise to microregional areas deprived in nutrients and oxygen and enriched with acidic waste products [1,2]. This leads to a tumor microenvironment characterized by hypoxia and low pH. The physiological stresses of hypoxia and acidosis have shown to lead to a more malignant tumor phenotype linked with metastasis, invasion, and treatment resistance [3–6].
Acidosis in solid tumors is mainly caused by lactic acid accumulation. Hypoxia stimulates glycolysis and the formation of lactic acid in order to compensate for reduced mitochondrial ATP production in a process resembling the influence oxygen exerts on fermentation in yeast, referred to as the Pasteur effect after its discoverer Louis Pasteur [7]. Since tumor cells maintain a high rate of glycolysis even in the presence of oxygen, a phenomenon known as aerobic gly-colysis or the Warburg effect [8], significant disparities in the spatial and temporal distribution of areas with low pO2and low extracellular pH (pHe) in tumors exist [9,10]. Studies have
shown microregional tumor pHelevels in the range of 6.15 to 7.5 [2,9], and a lack of correlation
between pH and oxygen levels [9]. Acidosis has previously demonstrated to influence cellular responses, such as stimulating autophagy [11], and to effect gene expression [12–14]. Hypoxia induces multiple responses, including elevated glycolysis, reduction of cell proliferation, and stimulation of angiogenesis and erythropoiesis. These effects are orchestrated by the hypoxia inducible factor (HIF), which is the main hypoxic switch [15].
Studies addressing hypoxia and acidosis have demonstrated an interaction of these two fac-tors. Mekhail et al. showed that VHL, the protein that controls degradation of HIF-1α, was affected by low pHe(6.3), in that acidosis triggered a nucleolar sequestration of VHL, and thereby
neutralizing the HIF-1 degrading function [16]. Previous studies have shown a different cellular response in term of gene expression and of DNA repair following hypoxia and acidosis in combi-nation compared to either hypoxia or acidosis alone [12]. Furthermore, studies have demon-strated that extracellular pH influences hypoxia related gene expression to a large extent [13,14], with low pHesuppressing the hypoxia induced up-regulation of gene expression in a number of
genes, especially CA9. A recent study has observed additive effects of hypoxia, acidosis and inter-stitial fluid pressure on a range of factors in tumor cell biology [17]. These findings highlight the importance of considering the two factors, hypoxia and acidosis, both separately and in combina-tion. This is both in order to obtain solid biological markers for both conditions, but also to understand their distinct contributions to tumor phenotype. Clearly, being able to accurately dis-tinguish the relevant microenvironmental factors and unravel how these factors interact or act independently will help us to understand the biology of the tumor microenvironment.
We have previously published anin vitrostudy where five carcinoma cell lines (SiHa,
FaDuDD,UTSCC5, UTSCC14 and UTSCC15) were exposed to different micro-environmental
factors followed by gene expression analysis to identify a cell-line and pHeindependent
hyp-oxia profile [18]. In the present study, we have used the same dataset to identify genes affected by acidosis.
Methods and Materials
1. Cell culture and hypoxia treatment
The cell culture and hypoxia treatment has previously been described in [18]. The human uter-ine cervix squamous cell carcinoma (SiHa) cell luter-ine was obtauter-ined from the American Type Cul-ture Collection (ATCC, Rockville, MD). The head and neck squamous cell carcinomas
FaDuDD, a subline of FaDu (an undifferentiated hypopharygeal SCC), UtScc5, UtScc14,
UTSCC15 and UTSCC33 (established by Dr. Reidar Grenman, University of Turku, Finland, and previously described in [19]), were obtained from Dr. Michael Baumann. Cells were cul-tured in Eagle’s minimal essential medium with glutaMAX I and Earle's balanced salt solution (Gibco) containing 1.5g/L sodium bicarbonate, 0.1 mM nonessential amino acids, 1.0 mM sodium pyruvate, 10% fetal calf serum, 100,000 U/L penicillin, and 100 mg/L streptomycin (SiHa), or in Dulbeccos modified Eagle medium with glutaMAX I containing 1.5g/L sodium bicarbonate, 2% HEPES, 0.1 mM nonessential amino acids, 1.0 mM sodium pyruvate, 10% fetal calf serum, 100,000 U/L penicillin, and 100 mg/L streptomycin (FaDuDD, UTSCC5,
UTSCC14 and UTSCC15), with 5% CO2in a well humidified incubator. Prior to experiments,
2x10⁵cells were transfered into 60mm glass Petri dishes three days before start of experiment. Cells were in the log-phase of growth at the time of experiment. Hypoxia was induced by con-tinually gassing the cells in an airtight chamber for 24 hours with 21, 5, 1, 0.1, 0.01 or 0% oxy-gen, supplemented with 5% CO2and nitrogen as balance, at 37°C. To induce acidosis, pH of
the medium (without sodium bicarbonate) was buffered with 20mM tris(hydroxymethyl)ami-nomethane (TRIS) base (Sigma), 20mM 2-(N-morpholino)ethanesulfonic acid (MES) (Sigma) and 0.52 g/l NaHCO3(Sigma) and titrated to 6.3 or 7.5. The pH adjusted media was applied
immediately before the induction of hypoxia. Cell mortality under all conditions was below 5%. As a control of the potential influence of the buffer system on gene expression, an addi-tional experiment with convenaddi-tional sodium bicarbonate buffered cell media with added lac-tate, and the pH titrated to 7.3, 7.15 and 6.7, was performed.
2. RNA extraction and oligonucleotide microarray analysis
The RNA extraction and microarray analysis has previously been described in [18]. Immedi-ately after removal from the airtight chamber, media was removed and 350μl RTL buffer
(Qia-gen) containing 10 ml/lβ-mercaptoethanol (Merch, Germany) was added to the Petri dishes. Cells were homogenized in a QiaShredder filter (Qiagen) at 10,000 g for 2 minutes. RNA was extracted using the RNeasy Mini Kit (Qiagen) according to the manufactures instructions. RNA eluted in RNase free water was quantified using a spectrophotometer (SmartSpec Plus, Biorad). To analyse gene expression across the whole genome, the samples was analyzed on the Human Genome U133 Plus 2.0 Array (AROS Applied Biotechnology, Aarhus, Denmark). All array data was MAS 5.0 global scaled using Affymetrix Expression Console 3.1 Software pack-age. For the gene clustering analysis, data, including probesets with known unique gene ID, was analyzed with Gene Cluster 2.11 (Michael Eisen, rana.lbl.gov/EisenSoftware.htm) using Pearsons correlation and complete linkage, Java Treeview (ver 1.1.3) and SAM (ver 3.02).
All array data is available at GEO, NCBI (Accesion number GSE70051).
Data sets were subjected to enrichment analysis (Geneontology.org, Analysis type: PANTHER Overrepresentation Test (release 20150430), GO Ontology database Released 2015-06-06).
3. Reverse transcription and qPCR
instructions. Total RNA (2μg) was reverse transcribed using random hexamer primers. To
detect transcripts of interest, TaqMan Gene Expression assay (ABI) was used for EIF4A2 (Hs01115195_g1) and JOSD3(Hs00936351_g1). For each reaction, cDNA (corresponding to 20ng RNA), 1x assay mix and 1x Taqman Universal PCR mastermix (ABI) in a total of 25μl
was mixed. Reactions were performed on an ABI Prism 7000 Sequence Detector (ABI) (40 cycles). All reactions were performed in triplicate. Results were normalized to the three refer-ence genes TFRC (4333770F), GUSB (4333767F), and HPRT1 (4333768T). These referrefer-ence genes was selected on the basis of a TaqMan Human Endogenous control plate (ABI) on which cDNA from the different treatments was analyzed against 12 common reference genes [14], and the geNORM Visual Basic application available in RealTime Statminer (Intergromics). Data analysis was performed using the RealTime Statminer software (Intergromics), and the Com-parative CTmethod. To test for whether genes were significantly upregulated under hypoxia
and acidosis relatively to the control conditions (Atmospheric air + pH 7.5), a two-tailed T-test was used. To correct for multiple comparisons, Bonferroni-Holm corrections was applied.
4. Pulse-labelling assay and immunoblotting
To determine whether cells modified the level of protein synthesis during the period of anoxia and/or acidosis, cell media (pH 7.5 and pH 6.3) was supplemented with 0.1 mCi EasyTag EXPRESS35S Protein Labeling Mix (Perkin Elmer). The media was applied to the cells immedi-ately before the induction of anoxia/acidosis. The cells were incubated in either atmospheric air (controls) or 0% oxygen supplemented with 5% CO2for 24 hours at 37°C. Cells were
imme-diately after treatment rinsed in 2x D-PBS, and lysed in 400μl lysis buffer (Complete Lysis-M
(Roche)). Protein quantity was quantified using DC protein assay (Biorad). Equal quantities of protein were resolved on 10–20% Tris-Glycine gels (Invitrogen). Quantitative autoradiography analysis of gel samples was performed using a Bas5000 laser-excited image analyzer (Fuji Film, Tokyo, Japan) and quantitated using the ImageGauge 4.0 software. As loading control, an iden-tical gel were blotted onto nitrocellulose membranes (Invitrogen), which were incubated with antibody against beta actin (Abcam ab8226, 1:5000 dilution), followed by incubation with per-oxidase-conjugated secondary antibody (anti-rabbit, DAKO, dilution 1:5000). Protein signal was detected using the Super Signal West Pico kit (Pierce). To test for significant differences in protein levels under hypoxia and acidosis relatively to the control conditions (Atmospheric air + pH 7.5), a two-tailed T-test was used.
5. In vitro oxygen consumption and lactate formation rates
Rates of oxygen consumption (OCR) and lactate production (LPR) were measured in attached cells approximately 12h (i.e., midway in the period over which protein synthesis rate was mea-sured) after initiation of exposure to the conditions of interest. In experiments involving cells exposed to atmospheric conditions at a normal (7.5) or low (6.3) medium pH, OCR and LPR were measured simultaneously in a custom built cellular respirometer (described in detail in [20]). In anoxic experiments, cells in medium with a normal or low pH were placed in air-tight boxes and flushed with a gas mixture of 5% CO2and 95% N2. LPR was calculated from the
generating sources, the relative contribution from glycolysis to the total ATP energy budget can be calculated as: LPR/(LPR + 4.5×OCR). This formula assumes that (a) lactate originates from sources other than endogenous glycogen resulting in the production of 1 mole ATP per 1 mole of lactate accumulated and (b) passive mitochondrial proton leakiness (causing no ATP-synthesis) dissipates 25% of the energy stored in the proton gradient, leading to the generation of only ~4.5 mole of ATP per mole O2consumed. Proton leakiness is now a generally accepted
phenomenon (for a review see [21]). It may vary between different organs and cell types but its exact magnitude will not affect our conclusions, since we are interested in quantifying relative differences between the different incubation conditions for a given cell line.
To test for significant differences in lactate production rate and oxygen consumption rate, a two-tailed T-test was used, comparing high vs low pH in oxygenated and high vs low pH in anoxic conditions, respectively.
Results
1. Gene expression response in cells treated with hypoxia and acidosis
A panel of human squamous cell carcinoma cell lines (SiHa, FaDuDD,UTSCC5, UTSCC14 and
UTSCC15) was treated with different grades of hypoxia and pHe, and gene expression was
ana-lyzed by Affymetrix Gene Expression Microarray. Data for all cell lines was anaana-lyzed by unsuper-vised hierarchical clustering (Fig 1). This demonstrated that the genes separated into main groups representing the five cell lines. Within all cell line, samples then clustered into high and low pH, showing that acidosis affected cellular gene expression profiles more profoundly than hypoxia.
To specifically select for pH regulated genes across more cell lines, data were analyzed to select genes based on different criteria. For genes to be considered as pH induced, expression had to be at least 2 fold upregulated at low pH under both hypoxic and normoxic conditions. InTable 1, the number of upregulated genes in the individual cell lines, and the biological pro-cesses the genes are involved in, are given. For each cell line, between 221 and 662 genes were more than 2 fold upregulated at low pH, whereas 107–289 genes were upregulated at low pH, both at normoxia and hypoxia.
When comparing across the cell lines, 14 probesets, representing 10 different genes, were upregulated more than 2 fold under low pH independent of hypoxia in 4 out of 5 cell lines (Fig 2andS3 Fig), with three of the genes being upregulated in all 5 cell lines (TXNIP, GAS5 and RPL37). The fold changes at different conditions is presented inS1 Table.
The included microarray data for FaDuDD and SiHa cells were part of a larger study, were the following conditions were investigated: 21, 5, 1, 0.1, 0.01 or 0% oxygen at pH 6.3 or 7.5 (S1 Fig). This data was analyzed with a multiclass Significance Analysis of Microarray (SAM), with the samples combined into four groups:“Normal oxygen, normal pH”(21%, pH 7.5; 5%, pH 7.5),“Low oxygen, normal pH”(0.1%, pH 7.5; 0%, pH 7.5;),“Normal oxygen, low pH”(21%, pH 6.3; 5%, pH 6.3),“Low oxygen, low pH”(0.1%, pH 6.3; 0%, pH 6.3). More details on this analysis is given inS1 Methods. The group of genes that was induced at low pH independent of oxygen concentration in this analysis (S2 Fig), included a subset of genes common between the two analysis (e.g. EIF4A2, JOSD3 and RPL37).
2. Expression levels of EIF4A2 and JOSD3
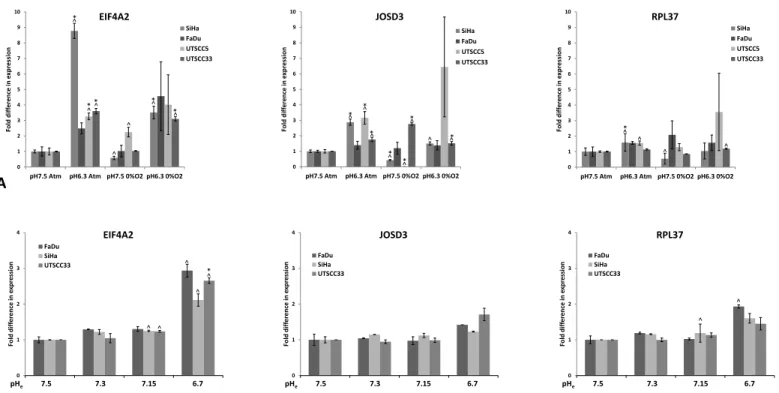
The expression of three of the genes from the analysis, EIF4A2, JOSD3 and RPL37 was further explored by qPCR at different oxygen concentrations, presenting the relative expression levels normalized to the control sample (21%O2at pH 7.5), in four different HNSCC cell lines (SiHa,
FaDuDD, UTSCC5 and UTSCC33) as shown inFig 3A. 21%O2and 0%O2were chosen for this
EIF4A2 increased significantly for three out of four cell lines at low pH with normal oxygen concentrations, and for two of the tested cell lines at low pH with 0% oxygen, relative to the control samples (cells at pH 7.5 at normal oxygen concentration). The expression of JOSD3 increased significantly for three out of four cell lines at low pH with normal oxygen concentra-tions. At pH 6.3, 0% O2the expression of JOSD3 was only significantly increased in one out of
four cell lines. A decrease in expression for two of the cell lines at pH 7.5, 0% O2, relative to the
levels at pH 7.5, normal oxygen concentration was observed. Expression of RPL37 was only sig-nificantly increased in one out of four cell lines at pH 6.3, atm air.
In an additional experiment, the expression of EIF4A2, JOSD3 and RPL37 was tested in SiHa, FaDuDDand UTSCC33 at normal oxygen concentration at a pH range from 7.5 to 6.7
(Fig 3B), which was obtained using a different buffering system and changing the lactate con-centration. In these experiments EIF4A2 showed a significant increase at pH 6.7 for one of the three cell lines, whereas JOSD3 and RPL37 did not exhibit a significant increase in expression at pH 6.7, compared to expression levels at pH 7.5.
Fig 1. Effect of tumor microenvironmental factors on gene expression.Unsupervised hierarchical clustering (median centred genes, complete linkage) of gene expression data from SiHa, FaDuDD, UTSCC5, UTSCC14 and UTSCC15 cells treated with combinations of oxygen concentrations (0.1%O2and 5%O2) and pHe(6.3 and 7.5).
3. Effect of anoxia and acidosis on protein synthesis
Several of the genes identified to be upregulated by low pH are involved in protein translation. We therefore wanted to see how a change in pH and/or oxygen concentration affected the level of protein synthesis. In a pulse labeling experiment using SiHa and FaDuDDcells,35S labeled
amino acids were added in the cells growth media at the time of inducing acidosis and/or Table 1. Number of upregulated genes in individual cell lines and top five of GO Biological Processes for each gene set.
Cell line Number of genes upregulated at low
pH
GO Biological Processes Number of genes upregulated at low pH—
independent of hypoxia
GO Biological Processes
SiHa 437 Cellular response to arsenic-containing substance
215 Response to hydrogen peroxide
Response to arsenic-containing substance
Response to reactive oxygen species
Positive regulation of smooth muscle cell proliferation
Response to oxidative stress
Regulation of smooth muscle cell proliferation
Positive regulation of programmed cell death
Negative regulation of cysteine-type endopeptidase activity involved in apoptotic process
Blood vessel development
FaDu 300 Myoblast differentiation 139 Regulation of signaling
Negative regulation of protein serine/ threonine kinase activity
Regulation of cell communication
Reproductive system development Response to organic substance
Reproductive structure development Regulation of signal transduction Monocarboxylic acid metabolic process Organ development
UTSCC5 221 Response to arsenic-containing substance
107 Cellular response to organic substance
Response to zinc ion Response to organic substance
Regulation of cysteine-type endopeptidase activity involved in apoptotic process
Signal transduction
Cellular response to external stimulus Single organism signaling
Response to metal ion Signaling
UTSCC14 662 Sequestering of metal ion 289 Regulation of extrinsic apoptotic signaling pathway via death domain receptors
Type I interferon signaling pathway Response to interferon-gamma Cellular response to type I interferon Cytokine-mediated signaling pathway Response to type I interferon Regulation of apoptotic signaling
pathway Regulation of extrinsic apoptotic
signaling pathway via death domain receptors
Cellular response to cytokine stimulus
UTSCC15 615 Antigen processing and presentation of exogenous peptide antigen via MHC class I, TAP-independent
286 Antigen processing and presentation of exogenous peptide antigen via MHC class I, TAP-independent
Response to zinc ion Type I interferon signaling pathway
Type I interferon signaling pathway Cellular response to type I interferon Cellular response to type I interferon Response to type I interferon Response to type I interferon Negative regulation of viral genome
replication
anoxia. The cells were incubated at these conditions for 24 hours and harvested. Equal levels of total protein were resolved on a polyacrylamide gel, and protein levels were determined by digi-tal autoradiography.Fig 4shows representative gels depicting the levels of protein synthesized during treatment of FaDuDDcells. To ensure equal levels of total protein in the samples,β
-actin levels were measured by immunoblots of identical gels. Three independent experiments for both cell lines have been conducted (additional gel pictures are shown inS4 Fig). All experi-ments showed a significant decrease in protein synthesis level (around 50–60%) when the cells had been treated with either low pH or anoxia, whereas a combination of the two factors in both cell lines led to a drastic decrease in the level of protein synthesized (>90% decrease).
4. Effect of anoxia and acidosis on ATP generation
To assess whether the reduction in protein synthesis rate is part of an overall metabolic rate depression, lactate production rate (LPR) and oxygen consumption rate (OCR) was measured in cells exposed to either anoxia, low pH or a combination of both. In oxygenated tumor cells acidosis caused highly significant decreases in LPR (in fmol/cell/min) from 13.6±3.8 to -0.03 ±0.30 (P = 0.02) and from 1.2±0.3 to -0.6±0.6 (P = 0.01) in FaDuDDand SiHa cells, respectively,
suggesting that acidosis minimizes or even reverts the lactate flux (Fig 5). Similarly, the transi-tion from pH 7.5 to 6.3 caused decreases in OCR (in fmol/cell/min) from 2.3±0.3 to 1.3±0.3 (P = 0.07) and from 1.5±0.03 to 0.9±0.08 (P = 0.003) in FaDuDDand SiHa cells, respectively.
As expected, anoxia stimulated anaerobic glycolysis, especially in SiHa which is consistent with previous observations [20]. Under anoxic conditions, LPR dropped significantly from 20.8±2.3 to 9.3±0.7 in FaDuDD(P = 0.01) and from 10.7±1.2 to 0.6±0.2 (P = 0.001) in SiHa when pH
was lowered from 7.5 to 6.3. From these data sets, the number of ATP equivalents generated in glycolysis from the conversion of glucose to lactate (lactate-coupled) and oxidative
Fig 2. pH induced genes across cell lines.Expression (microarray data) of genes found to be more than 2 fold upregulated under low pH independent of hypoxia in 4 out of 5 cell lines (SiHa, FaDuDD, UTSCC5, UTSCC14 and UTSCC15). Data displayed is log transformed and median centered.
phosphorylation (OXPHOS), respectively, were calculated as described in materials and meth-ods. This basal energy budget is depicted inFig 5. It is evident that low pH induces an overall metabolic rate depression (the sum of glycolytic and OXPHOS generated ATP), and shifts the cells towards a non-glycolytic phenotype. As expected, anoxia caused a compensatory increase in glycolytic flux (Pasteur effect), but for SiHa the combination of anoxia and low pH sup-pressed overall metabolic rate dramatically.
Discussion
The tumor microenvironment is characterized by hypoxia, low pH and high lactate. Hypoxia stimulates anaerobic energy production and the formation of lactic acid as a compensation for reduced mitochondrial ATP production (Pasteur effect), but high intrinsic glycolytic depen-dency (Warburg effect) weakens the Pasteur effect in tumor cells and thus the spatial link between low pH and hypoxia, in the sense that areas with low pH despite of normoxic condi-tions exists. It is therefore important to distinguish between the phenotypes of cells exposed to either or both, hypoxia and acidosis. It has previously been observed for a number of genes, that gene expression during hypoxia can be affected by low extracellular pH [12–14,22]. In a previous in vitro study the gene expression patterns of squamous cell carcinoma cell lines under hypoxia and/or low extracellular pH was studied. Based on these data, 29 genes charac-terized by being upregulated under hypoxic conditions and furthermore being independent of pH fluctuations were identified as potential classifier genes across a range of cell lines [18]. These genes have been evaluated in a clinical material, which has led to the development of a Fig 3. pH induction of identified genes.Relative levels of EIF4A2, JOSD3 and RPL37 mRNA measured by qPCR in SiHa, FaDuDD, UTSCC5 and UTSCC33 cells under different conditions. Levels are normalized to the control samples (pH 7.5, atmospheric oxygen level). Results are mean of three independent experiments (+/-SEM). (^) indicates p values<0.05 compared to the control level. (*) indicates p values which are significant different from the control levels, when correction for multiple comparisons is applied.
15-gene hypoxia classifier, which attain both prognostic and predictive impact for hypoxic modification in head and neck cancer [23].
The cellular effects of acidosis has been evaluated in a range of studies in connection to ischaemia, which is known to reduce pH in local tissue. In some of the studies an effect on pro-tein translation rate as a function of low pH has been shown [24,25]. In the present study we have both investigated the combined effect of hypoxia and acidosis, and sought to unravel the responses caused by the two tumor microenvironmental factors. We have identified a group of genes, which are induced by acidosis—independent of hypoxia. Several of the genes that were identified as upregulated by severe acidosis in a number of cell lines are involved in the transla-tion process. Eukaryotic translatransla-tion initiatransla-tion factor 4A2,EIF4A2, is involved in the initiation
phase of translation, which is required for the assembly of a complete ribosome at the start codon of the mRNA. Ribosomal protein L37,RPL37, encodes a ribosomal protein that is a
component of the large 60S ribosomal subunit. JOSD3 (TATA box binding protein (TBP)-Fig 4. Pulse-labelling assay.To determine whether the cells modified their levels of protein synthesis,35 S-labelled methionine and cysteine was added during treatment, and de novo protein levels were determined by autoradiography. The gels shown in A (FaDu) and B (SiHa) are representative gels with equal amounts of total protein loaded (two lanes are loaded with each sample).βactin levels was measured on similar gels. C: Mean values from three independent experiments for SiHa and FaDuDDcells (+/-SEM). (*) indicates p values <0.05 compared to the control level.
associated factor, RNA polymerase I, D, 41kDa (TAF1D)) plays a role in transcription of RNA polymerase I, which synthesizes pre-rRNA. Other genes identified to be upregulated during acidosis were involved in process such as transcription and signal transduction. Other studies have identified acidosis-induced genes [12,26,27], but there is however no overlap with the genes identified in the present study. This could be due to the analysis in the present study aim-ing at identifyaim-ing pH induced genes not affected by hypoxia. In this study cells were treated with hypoxia and/or acidosis for 24 hours. Previous data has shown hypoxia induced gene expression to be affected after short term hypoxia (down to 3 hours) [14], pointing towards fluctuation in hypoxic level, and hence fluctuations in pH, to affect the gene expression patterns.
Since many of the genes we identified are involved in gene translation, we analyzed the effect of acidosis on the level of protein synthesis. Down regulation of protein synthesis have previously been reported as an effect of hypoxia [28–30], and is thought to be a mechanism to preserve energy and protect against the stress of hypoxia. In our study a combination of acido-sis and hypoxia affected the cells to a much higher extent than any of the factors alone, and led to an almost complete shutdown of protein synthesis. Experimental data has shown acidosis (pH 6.4) in HK-2 cells to inhibit genes involved in protein translation [31]. The reason we find increased expression of genes associated with translation, even though translation is shown to be down-regulated, may be due to a feedback mechanism of the translation machinery. A pre-vious in vitro study has demonstrated low pH to protect against oxygen–glucose deprivation induced cellular injury [31]. The proteins that remain to be translated during hypoxia and aci-dosis may be involved in mechanisms for cell survival.
Protein synthesis arrest was occurring simultaneously to an overall ATP- sparing metabolic rate depression (Fig 5). This supports that cells under simultaneous acidosis and hypoxia are responding with a different mechanism, than cells under hypoxia alone, which is also shown by the different gene expression patters that cells express in vitro depending on whether they are exposed to hypoxia alone, or hypoxia together with acidosis [12,18].
Whereas hypoxia force cells towards a glycolytic phenotype acidosis has oppositely been shown to stimulate a transition to a more efficient energetic phenotype with a mitochondrial ATP synthesis, and under some conditions, lactate may even be taken up and oxidized [32]. Furthermore, acidosis can override the glycolytic change induced during mild hypoxia of 1% Fig 5. Energy metabolism following acidosis.The cellular ATP budget was calculated from OCR and LPR as detailed in Methods and Materials. The total bar height represents total ATP production, which consists of the sum of ATP generated from OXPHOS (dark gray) and ATP generated from glycolysis (light gray). The data is the mean values from three to four independent experiments (+/- SEM). (*) indicates p values<0.05 between the indicated treatments.
O2and this may be an adaptive strategy to survive in an energy-restricted microenvironment
[33]. During severe hypoxia, cells are forced to a glycolytic energy production (Fig 5), but the large decrease in macromolecule synthesis and total ATP requirement may serve as an adaptive response under such stressful conditions. The signal transduction pathways that fine tunes energy metabolism and metabolite fluxes under these opposing microenvironmental stresses are not fully understood, but interfering with them may make tumor cells vulnerable to ener-getic stress.
We demonstrate here that the influence of hypoxia and acidosis causes different responses, both in gene expression and in de novo protein synthesis, depending on whether the two fac-tors induced alone or overlapping, and as such it is important for in vivo studies to take this into account.
Supporting Information
S1 Fig. Unsupervised hierarchical clustering of microarray data for FaDuDDand SiHa cells (21, 5, 1, 0.1, 0.01 or 0% oxygen at pH 6.3 or 7.5).
(PDF)
S2 Fig. Multiclass Significance Analysis of Microarray (SAM).The top 25 of probe sets induced at low pH independent of oxygen concentration, at low oxygen independent at pH, and induced at low oxygen only at normal pH.
(PDF)
S3 Fig. Data fromFig 2, analyzed within each pH. (PPTX)
S4 Fig. Additional gels from pulse experiments. (PPTX)
S1 Methods. Supplementary Methods. (DOCX)
S1 Table. Array data: Fold difference of genes found to be differentially expressed by low pH.Blue columns indicates oxygen regulation, green columns indicates pH regulation. (DOCX)
Acknowledgments
The authors would like to thank Inger Marie Thuesen, Bente Kierkegaard and Alice Baden for excellent technical help. Financial support was received from the Danish Cancer Society, EC FP7 project METOXIA (project no. 222741), CIRRO—The Lundbeck Foundation Center for Interventional Research in Radiation Oncology and The Danish Council for Strategic Research.
Author Contributions
References
1. Bussink J, Kaanders JH, van der Kogel AJ. Tumor hypoxia at the micro-regional level: clinical relevance and predictive value of exogenous and endogenous hypoxic cell markers. Radiother Oncol 2003; 67: 3–15. PMID:12758235
2. Vaupel P, Kallinowski F, Okunieff P. Blood flow, oxygen and nutrient supply, and metabolic microenvi-ronment of human tumors: a review. Cancer Res 1989; 49: 6449–6465. PMID:2684393
3. Gatenby RA, Gillies RJ. Why do cancers have high aerobic glycolysis? Nat Rev Cancer 2004; 4: 891– 899. PMID:15516961
4. Raghunand N, Gatenby RA, Gillies RJ. Microenvironmental and cellular consequences of altered blood flow in tumours. Br J Radiol 2003; 76 Spec No 1:S11–22.: S11–S22. PMID:15456710
5. Harris AL. Hypoxia—a key regulatory factor in tumour growth. Nat Rev Cancer 2002; 2: 38–47. PMID:
11902584
6. Justus CR, Dong L, Yang LV. Acidic tumor microenvironment and pH-sensing G protein-coupled recep-tors. Front Physiol 2013; 4: 354. doi:10.3389/fphys.2013.00354PMID:24367336
7. Barnett JA. A history of research on yeasts 2: Louis Pasteur and his contemporaries, 1850–1880. Yeast 2000; 16: 755–771. PMID:10861901
8. Koppenol WH, Bounds PL, Dang CV. Otto Warburg's contributions to current concepts of cancer metabolism. Nat Rev Cancer 2011; 11: 325–337. doi:10.1038/nrc3038PMID:21508971
9. Helmlinger G, Yuan F, Dellian M, Jain RK. Interstitial pH and pO2 gradients in solid tumors in vivo: high-resolution measurements reveal a lack of correlation. Nat Med 1997; 3: 177–182. PMID:9018236 10. Vaupel P, Hockel M. Blood supply, oxygenation status and metabolic micromilieu of breast cancers:
characterization and therapeutic relevance. Int J Oncol 2000; 17: 869–879. PMID:11029486 11. Wojtkowiak JW, Rothberg JM, Kumar V, Schramm KJ, Haller E, Proemsey JB et al. Chronic autophagy
is a cellular adaptation to tumor acidic pH microenvironments. Cancer Res 2012; 72: 3938–3947. doi:
10.1158/0008-5472.CAN-11-3881PMID:22719070
12. Chen JL, Lucas JE, Schroeder T, Mori S, Wu J, Nevins J et al. The genomic analysis of lactic acidosis and acidosis response in human cancers. PLoS Genet 2008; 4: e1000293. doi:10.1371/journal.pgen. 1000293PMID:19057672
13. Sørensen BS, Alsner J, Overgaard J, Horsman MR. Hypoxia induced expression of endogenous mark-ers in vitro is highly influenced by pH. Radiother Oncol 2007; 83: 362–366. PMID:17512623
14. Sørensen BS, Hao J, Overgaard J, Vorum H, Honore B, Alsner J et al. Influence of oxygen concentra-tion and pH on expression of hypoxia induced genes. Radiother Oncol 2005; 76: 187–193. PMID:
16098620
15. Weljie AM, Jirik FR. Hypoxia-induced metabolic shifts in cancer cells: moving beyond the Warburg effect. Int J Biochem Cell Biol 2011; 43: 981–989. doi:10.1016/j.biocel.2010.08.009PMID:20797448 16. Mekhail K, Gunaratnam L, Bonicalzi ME, Lee S. HIF activation by pH-dependent nucleolar
sequestra-tion of VHL. Nat Cell Biol 2004; 6: 642–647. PMID:15181450
17. Matsubara T, Diresta GR, Kakunaga S, Li D, Healey JH. Additive Influence of Extracellular pH, Oxygen Tension, and Pressure on Invasiveness and Survival of Human Osteosarcoma Cells. Front Oncol 2013; 3: 199. doi:10.3389/fonc.2013.00199PMID:23914349
18. Sørensen BS, Toustrup K, Horsman MR, Overgaard J, Alsner J. Identifying pH independent hypoxia induced genes in human squamous cell carcinomas in vitro. Acta Oncol 2010; 7: 895–905. 19. Eicheler W, Zips D, Dorfler A, Grenman R, Baumann M. Splicing mutations in TP53 in human
squa-mous cell carcinoma lines influence immunohistochemical detection. J Histochem Cytochem 2002; 50: 197–204. PMID:11799138
20. Busk M, Horsman MR, Kristjansen PE, van der Kogel AJ, Bussink J, Overgaard J. Aerobic glycolysis in cancers: implications for the usability of oxygen-responsive genes and fluorodeoxyglucose-PET as markers of tissue hypoxia. Int J Cancer 2008; 122: 2726–2734. doi:10.1002/ijc.23449PMID:
18351643
21. Brand MD, Chien LF, Ainscow EK, Rolfe DF, Porter RK. The causes and functions of mitochondrial pro-ton leak. Biochim Biophys Acta 1994; 1187: 132–139. PMID:8075107
22. Dregoesc D, Rainbow AJ. Differential effects of hypoxia and acidosis on p53 expression, repair of UVC-damaged DNA and viability after UVC in normal and tumor-derived human cells. DNA Repair (Amst) 2009; 8: 370–382.
23. Toustrup K, Sorensen BS, Nordsmark M, Busk M, Wiuf C, Alsner J et al. Development of a hypoxia gene expression classifier with predictive impact for hypoxic modification of radiotherapy in head and neck cancer. Cancer Res 2011; 71: 5923–5931. doi:10.1158/0008-5472.CAN-11-1182PMID:
24. Vantelon N, Rioux-Bilan A, Ingrand S, Pain S, Page G, Guillard O et al. Regulation of initiation factors controlling protein synthesis on cultured astrocytes in lactic acid-induced stress. Eur J Neurosci 2007; 26: 689–700. PMID:17686044
25. Crean D, Felice L, Pierre P, Jennings P, Leonard MO. Inhibition of protein translation as a mechanism of acidotic pH protection against ischaemic injury through inhibition of CREB mediated tRNA synthe-tase expression. Exp Cell Res 2013; 319: 3116–3127. doi:10.1016/j.yexcr.2013.07.017PMID:
23896026
26. Bumke MA, Neri D, Elia G. Modulation of gene expression by extracellular pH variations in human fibro-blasts: a transcriptomic and proteomic study. Proteomics 2003; 3: 675–688. PMID:12748947 27. Kato Y, Lambert CA, Colige AC, Mineur P, Noel A, Frankenne F et al. Acidic extracellular pH induces
matrix metalloproteinase-9 expression in mouse metastatic melanoma cells through the phospholipase D-mitogen-activated protein kinase signaling. J Biol Chem 2005; 280: 10938–10944. PMID:15657063 28. Koumenis C, Wouters BG. "Translating" tumor hypoxia: unfolded protein response (UPR)-dependent
and UPR-independent pathways. Mol Cancer Res 2006; 4: 423–436. PMID:16849518
29. Wouters BG, van den BT, Magagnin MG, Koritzinsky M, Fels D, Koumenis C. Control of the hypoxic response through regulation of mRNA translation. Semin Cell Dev Biol 2005.
30. Koritzinsky M, Magagnin MG, van den Beucken T, Seigneuric R, Savelkouls K, Dostie J et al. Gene expression during acute and prolonged hypoxia is regulated by distinct mechanisms of translational control. EMBO J 2006; 25: 1114–1125. PMID:16467844
31. Crean D, Felice L, Pierre P, Jennings P, Leonard MO. Inhibition of protein translation as a mechanism of acidotic pH protection against ischaemic injury through inhibition of CREB mediated tRNA synthe-tase expression. Exp Cell Res 2013; 319: 3116–3127. doi:10.1016/j.yexcr.2013.07.017PMID:
23896026
32. Sonveaux P, Vegran F, Schroeder T, Wergin MC, Verrax J, Rabbani ZN et al. Targeting lactate-fueled respiration selectively kills hypoxic tumor cells in mice. J Clin Invest 2008; 118: 3930–3942. doi:10.
1172/JCI36843PMID:19033663