Abstract—There is currently no consensus on the effectiveness of preprocessing methods used in pooled DNA (Deoxyribonucleic Acid) microarray analysis of SNP (Single Nucleotide Polymorphism) data. We investigated two normalization methods, cyclic loess and quantile, before identifying susceptibility genes of type 2 diabetes mellitus (T2DM). The probe data set is filtered by discrimination score and range of estimate allele frequency to remove unreliable probe intensities. The results show that both normalizations can reduce variation; however, there is no significant difference in identifying significant SNPs. The probe data set that uses only perfect match intensity is preferred. The mismatch probe intensities are used to exclude unreliable SNPs in the step of filtering.
Index Terms—Cyclic loess normalization, discrimination score, pooled DNA, quantile normalization, relative allele signal, SNP microarray, type 2 diabetes mellitus.
I. INTRODUCTION
Type 2 diabetes mellitus (T2DM) is a complex disease that represents a major public health concern around the world. Although we already know that alteration of the environmental and lifestyle risk factors can substantially reduce progression of this disease, the prevalence of diabetes is increasing every year. T2DM is frequently not diagnosed until complications appear because the effectiveness of early diagnosis through screening of asymptomatic individuals has not been established [1]. It is hoped that better understanding of the genetic and molecular etiology of the disease would help to improve treatment and prevention.
Manuscript received January 7, 2008.
Tanaporn Uengwetwanit is with the School of Bioresources and Technology and School of Information Technology, King Mongkut’s University of Technology Thonburi, Bangkok, Thailand 10140 (e-mail: [email protected]).
Asawin Meechai is with the Department of Chemical Engineering, Facutly of Engineering, King Mongkut’s University of Technology Thonburi, Bangkok, Thailand 10140 (e-mail:[email protected]).
Wallaya Jongjaroenprasert is with the Faculty of Medicine, Ramathibodi Hospital, Bangkok, Thailand 10400 (e-mail: [email protected]).
Boonsong Ongphiphadhanakul is with the Faculty of Medicine, Ramathibodi Hospital, Bangkok, Thailand 10400 (e-mail: [email protected]).
Jarukit Lertbantanawong is with the Department of Information Technology, Faculty of Science and Technology, Assumption University, Bangkok, Thailand 10240 (e-mail: [email protected]).
Jonathan H. Chan is with the School of Information Technology, King Mongkut’s University of Technology Thonburi, Bangkok, Thailand 10140 (phone: 66-2-470-9819; fax: 66-2-872-7145; e-mail: [email protected]).
Genome-wide association study that used Single Nucleotide Polymorphisms (SNPs) has the potential to revolutionize the identification of genetic influences of complex traits and diseases. SNPs are popular for genome-wide association because they have high abundance in human genome, a low mutation rate and accessibility to high-throughput genotyping [2]. SNP microarray is a widely acceptable method for whole genome genotyping; however it requires a large number of samples to genotype. To address the cost, time and labor that are involved in large-scale genotyping, pooling techniques have been proposed. DNA pooling may be used to estimate the allele frequency of SNPs and map disease susceptibility genes. Researchers reported this technique as reliable and offers cost savings relative to individual genotyping studies [2, 3].
In this study, we used a pooling approach with Affymetrix SNP arrays in order to screen for susceptible genes of T2DM. Since environmental factors are likely to have a major impact and obesity frequently co-occurs with T2DM, type 2 diabetes pools were classified into two subpools, non-obese T2DM and obese T2DM, based on body mass index (BMI).
Any human DNA sample generally has one of three genotypes at a SNP: AA, AB or BB, where A and B are the conventional names for the alleles at the SNP. The Affymetrix SNP array is composed of allele-specific hybridization probes called perfect match of A allele (PA) and perfect match of B allele (PB). For each oligo-probe, these arrays also contain a negative control oligo called mismatch (MM). With this approach, probe redundancy accounts for discrimination between signal and noise.
In order to identify SNPs associated with diabetes from array data, a suitable analysis method has to be investigated. Preprocessing is a necessary step to remove obscurities that affect accuracy and validity of downstream analysis. However, there is currently no consensus on which processing method is the most efficient or effective. Moreover, literature that has thoroughly examined the influence of each of these preprocessing stages on Affymetrix SNP array is rare. Therefore we investigated the suitable method for our data before identifying susceptible genes of type 2 diabetes mellitus.
The main preprocessing steps are background correction, normalization, and summarization. This work focused on normalization method and probe set data used for analysis. Besides these, two criteria of filtering data, discrimination scores and range of relative allele signal, were also used.
An Analytical Process for Screening
Susceptibility Genes of Type 2 Diabetes
Mellitus Using Pooled DNA Microarray Data
II. MATERIALS AND METHODS
The data set used in this study was obtained from the project "Study on the Genetic Susceptibility to Type 2 Diabetes in Thais", Ramathibodi Hospital, Thailand.
A. Pooled DNA Preparation
Genomic DNA for each individual was extracted from white blood cells following in house DNA extraction method. Each individual DNA sample was quantified using a spectrophotometer and fluorimeter, and diluted to a concentration of 10 ng/µL before pooling. T2DM pools were generated as two subpools classified by BMI. Diabetic patients that have BMI greater than 25 kg/m2 are classified into the obese T2DM pool group; otherwise they are in the non-obese T2DM pool group. Samples (DNA pools) were prepared for hybridization to standard GeneChip® microarrays using Affymetrix protocols and recommended reagents as documented in the GeneChip Mapping 10K 2.0 Assay Manual. Each pool consisting of 50 individuals was assayed on a separate microarray. Each microarray was scanned using the GeneChip® scanner and GeneChip® Operating software (GCOS) v.1.4. Cell intensity (.cel) files were generated and exported as text files. There are five independent pooled data of control, four pools data of non-obese T2DM and three pooled data of obese T2DM.
B. Generation of Estimated Allele Frequency
The SNPs on Affymetrix SNP array have redundant probes to represent the SNP. Probe intensities have to be summarized to a single value for analysis. Based on the analysis method of pooling, the difference in the allele frequency of each pool was used for analysis instead of clustering into genotype as well as individual sample on SNP array. Allele frequency is the proportion of one allele relative to all alleles at the locus in the population. Usually, the measure of probe intensity of A allele to the probe intensity of
A and B allele on SNP array is called relative allele signal, or RAS [2, 4, 5].
C. Filtering Data
Before data transformation, the SNPs which have unreliable probe intensities were removed from this study by using a discrimination filter. The filter used is the discrimination score (DS) which is the ratio of the difference between perfect match and mismatch to the sum of perfect match and mismatch intensities. More details are provided in the Affymetrix manual [5]. Moreover, DS was used to assess the quality of the microarray. If the percent of the number of SNPs that passed the discrimination filter to total number of SNPs on an array was less than 90 percent, this array was discarded. In this study, we set DS threshold to 0.08, following the guideline of the Affymetrix manual.
The probe intensities of SNPs that passed the discrimination filter were normalized and then transformed to RAS for further analysis.
In the part of statistical analysis, the appropriate test to use in the determination of the difference in the estimated allele frequency of the two pools is studied. The results from the
Pearson χ2
test is unrealistic for pooled DNA because the variance would be inflated by experimental error that is specific to DNA pooling studies [6]. Therefore, we used a two-sample t-test, a general statistic, in this study. The t-test has been successfully applied in pooled DNA SNP array data in other works [4, 7].
The RAS values can be used separately or as an average value. When we considered the number of group to give an accurate estimate of the true value of interest in the absence of a systemic bias, the RAS of sense and antisense were manipulated as replicated array i.e. two data set of one array. To avoid minor allele frequency that substantially reduced the power of statistical detection, the RAS values of interest were taken to be in the range of 0.05-0.95.
D. Stage 1: Evaluation of Cyclic Loess & Quantile Normalizations
The purpose of data normalization is to minimize the effects of experimental and technical variations so that meaningful biological comparisons can be made and true biological changes can be found among multiple experiments [7]. Due to technical biases, normalization of the intensity levels is a pre-requisite to performing further statistical analyses. Therefore, choosing a suitable approach for normalization is essential. In the study of Bolstad et al. [7], various normalization methods were compared. Quantile normalization was recommended and cyclic loess was comparable with quantile normalization in their study. Following their study, we evaluated cyclic loess and quantile normalizations using our data set. We used quantile to normalize the probe intensities across arrays within group (Control, Non-obese T2DM and Obese T2DM) while the cyclic loess was used to normalize whole array.
The probe data sets of both PM and MM were used to calculate RAS following these steps:
B
A
A
RAS
quarter
(1)]
0
,
max[
PA
M
avA
(2)]
0
,
max[
PB
M
avB
(3)2
]
[
MA
MB
M
av
(4)where:
MA = Mismatch A allele intensity value
MB = Mismatch B allele intensity value
Thealgorithm calculates the median of the RAS values for the sense direction probe quartets and uses this value as the Median RAS value for the sensedirection (RAS1). Then, the algorithm calculates the median of the RAS values for the antisense direction probe quartets and uses this value as the RAS valuefor the antisense direction (RAS2).
E. Stage 2: Evaluation of Probe Data Set
Therefore we investigated three different methods of probe data set treatment. First, according to stage 1, the probe intensities of both PM and MM were normalized before RAS computation. This probe data set is denoted PM&MM. Second, the probe intensities of PM in each quartet were subtracted by MM following (2), (3) and (4), then normalization before calculating RAS following (1). This probe data set is denoted PMsub. Third, only PM probe intensities were normalized and the calculation of RAS was done using the following equation
PB
PA
PA
RAS
quarter
(5)where:
PA = normalized perfect match A allele intensity value
PB = normalized perfect match B allele intensity value The last probe data set is denoted PM.
III. RESULTS AND DISCUSSION
A. Evaluation of Cyclic Loess & Quantile Normalizations
The plot between standard deviation (SD) and mean intensities (Fig. 1) allows us to discern deviation-mean dependence. The pointed clouds of data, which are enlarged on the right side of the figure, become approximately horizontal after loess or quantile normalization. This shows that the normalized data is less deviation-mean dependent than non-normalized data. However, there is no difference between cyclic loess and quantile normalizations, as can be seen in the distribution of RAS values for each normalization method (Fig. 2).
Fig. 1. Scatter plot of standard deviation (SD) versus mean intensities for all arrays in the control group.
Fig. 2. Box plots of RAS of sense and antisense strands across array in each normalization method.
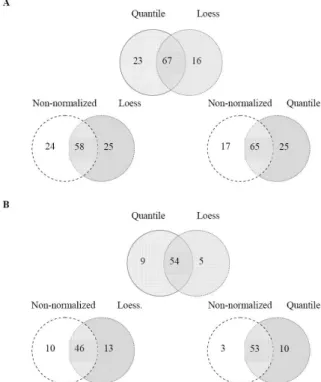
Fig. 3. Venn-Euler diagram representation of the number of significant candidate SNPs at p-value of 0.003. A) Significant SNPs of non-obese T2DM group. B) Significant SNPs of obese T2DM group.
implies that normalization methods have no significant impact on identifying significant SNPs. Our result also agrees with the study of Barbacioru et al. [11] which used Applied Biosystems expression arrays. Nevertheless, normalization is preferable in preprocessing data because the variation of normalized data is lower than that of non-normalized one. Given that the two normalization methods produced similar results, quantile normalization is preferred in this work due to its simplicity and faster processing time.
B. Evaluation of Probe Data Set
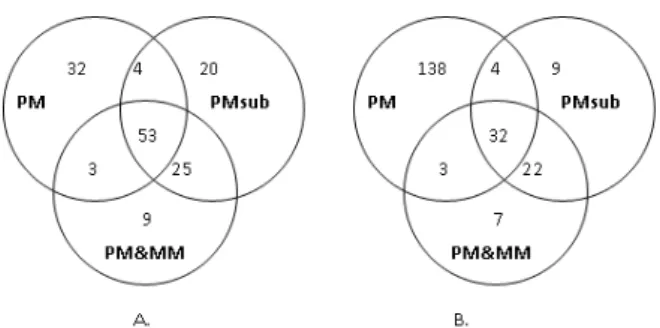
Fig. 4 presents the number of overlapping significant SNPs at p-value of less than 0.003 and the number of unique SNPs identified by each method. No SNPs from PM method were excluded from the criterion of RAS range. The Spearman's rank correlation of RAS values across array in each pooled group is significant in all methods (data not shown). However, the data that used only PM show good distribution and rank correlation between RAS of sense and antisense strands within the pooled groups, as shown in Fig. 5. That is, there is less scattering in the upper parts of the diagonal line, which represent the distribution of RAS values from PM method in each pooled group, compared with subtracted MM method in the lower parts. We conclude that using only PM probe intensities for further analysis is preferable and MM values may be ignored. It is suitable to use MM only to remove unreliable hybridization in the step of discrimination filter.
Fig. 4. Venn-Euler diagram representation of the number of significant candidate SNPs from different probe data sets studied at p-value of 0.003. A) Significant SNPs of non-obese T2DM group. B) Significant SNPs of obese T2DM group.
In this study, we suggest a suitable analysis method for pooled DNA on Affymetrix SNP array as follows. The probe intensities of both perfect match and mismatch should pass discrimination filter to block unreliable intensities. The increasing of threshold will give more reliable hybridization, however we will lose possible candidate SNPs. Next, only perfect match probe intensities were used to normalize across arrays within group by the quantile method. Then, probe intensity values of individual SNP in each chip were transformed to relative allele signal by ignoring MM. The RAS values of sense and anti-sense should be used separately to increase power of detection, if t-test was performed.
Fig. 5. Scatter plots of RAS values (sense and anti-sense strands) across arrays in each pooled group A) Control group B) Non-obese T2DM group and C) Obese T2DM group. The upper part of diagonal line or in triangle is scatter plot of RAS values from PM method and lower part from subtracting MM method.
An aim of this work is to screen for the susceptibility genes of type 2 diabetes in order to nominate SNPs for individual genotyping, which is necessary for validation of results. Based on the procedure from this study, the number of candidate SNPs of non-obese T2DM and obese T2DM are 92 and 177 SNPs, respectively, at a cutoff p-value of 0.003.
Although screening can reduce the number of SNPs to be validated, genotyping all screened candidate SNPs would still require a high cost. Therefore, we decided to select a smaller number of candidates for validation. In order to narrow down the number of candidate SNPs, we first focused on nonsynonymous SNPs (nsSNPs), which presume that a change in amino acid will lead to change in protein function. However we found only 15 nsSNPs in our Affymetrix 10k array that matched in the LS-SNP database, an annotated database of SNPs (http://alto.compbio.ucsf.edu/LS-SNP/). Also, nsSNPs do not account for all SNP that can cause disease or susceptibility to disease. SNPs located in the promoters region, introns, splice site, and intragenic region, or even synonymous SNPs, may have functional consequences via unknown mechanisms. For these reasons, we assume that all candidate SNPs are capable to affect T2DM.
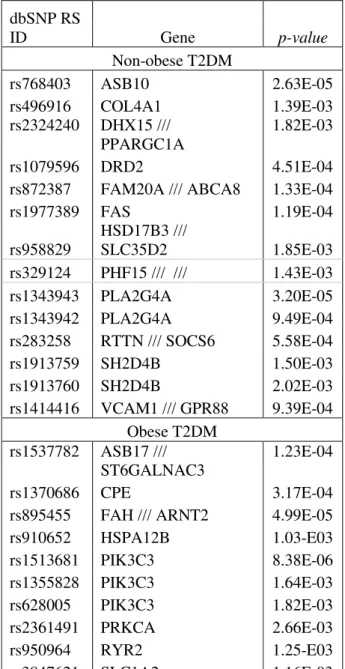
Table I shows the list of candidate SNPs of non-obese T2DM and obese T2DM that we nominated for validation based on biological function support and the fact that they overlapped all three methods at p-value of 0.003. Some of these genes, where the candidate SNPs are located, have been proposed to be associated with T2DM, but the subgroups of genes are different.
Table I. List of susceptibility genes that varied significantly in type 2 diabetes mellitus patients.
dbSNP RS
ID
Gene
p-value
Non-obese T2DM
rs768403
ASB10
2.63E-05
rs496916
COL4A1
1.39E-03
rs2324240
DHX15 ///
PPARGC1A
1.82E-03
rs1079596
DRD2
4.51E-04
rs872387
FAM20A /// ABCA8
1.33E-04
rs1977389
FAS
1.19E-04
rs958829
HSD17B3 ///
SLC35D2
1.85E-03
rs329124
PHF15 /// ///
1.43E-03
rs1343943
PLA2G4A
3.20E-05
rs1343942
PLA2G4A
9.49E-04
rs283258
RTTN /// SOCS6
5.58E-04
rs1913759
SH2D4B
1.50E-03
rs1913760
SH2D4B
2.02E-03
rs1414416
VCAM1 /// GPR88
9.39E-04
Obese T2DM
rs1537782
ASB17 ///
ST6GALNAC3
1.23E-04
rs1370686
CPE
3.17E-04
rs895455
FAH /// ARNT2
4.99E-05
rs910652
HSPA12B
1.03-E03
rs1513681
PIK3C3
8.38E-06
rs1355828
PIK3C3
1.64E-03
rs628005
PIK3C3
1.82E-03
rs2361491
PRKCA
2.66E-03
rs950964
RYR2
1.25-E03
rs3847621
SLC1A2
1.16E-03
IV. CONCLUSION
Previous works on the analysis of preprocessing were performed on well-controlled data sets such as the dilution or spike-in data in expression array. Whereas in this study, real-life data sets were used. As there are no standard evaluation methods of preprocessing and the different methods can provide conflicting results, therefore, the candidate SNPs obtained from this study have to be validated to confirm the suitability of this method. Currently, one candidate SNP (rs329124) has been confirmed to be associated with type 2 diabetes.
ACKNOWLEDGMENT
Study on the genetic susceptibility to T2DM in Thais was supported by Thailand Research Fund.
REFERENCES
[1] M.M. Engelgau, K.M. Narayan, W.H. Herman, “Screening for type 2 diabetes”, Diabetes Care, vol.23, 2000, pp.1563–1580.
[2] H. Matsuzaki, H. Loi, S. Dong, Y. Tsai, J. Fang, J. Law, X. Di, W. Liu, G. Yang., G. Liu., J. Huang, G.C. Kennedy, T.B. Ryder, G.A. Marcus, P.S. Walsh, M.D. Shriver, J.M. Puck, K.W. Jones, and R. Mei, ”Parallel genotyping of over 10,000 SNPs using a one primer assay on a high-density oligonucleotide array”, Genome Res,vol. 14, 2004, pp.414-425.
[3] G.C. Kennedy, H. Matsuzaki, S. Dong, W.M. Liu, J. Huang, G. Liu, X. Su, M. Cao, W. Chen, J. Zhang,, W. Liu, G. Yang, X. Di, T. Ryder, Z. He, U. Surti, M.S. Phillips, M.T. Boyce-Jacino, S.P. Fodor, K.W. Jones, “Large-scale genotyping of complex DNA”, Nat Biotechnol, vol 21, no.10, 2003, pp.1233-1237.
[4] L.M. Butcher, E. Meaburn, J. Knight, P.C. Sham, L.C. Schalkwyk, I.W. Craig, and R. Plomin, “SNPs, microarrays and pooled DNA: identification of four loci associated with mild mental impairment in a sample of 6000 children”, Hum Mol Genet, vol.14, no.10, 2005, pp.1315-1325.
[5] Affymetrix, “Affymetrix®GeneChip® Genotyping Analysis Software User’s Guide Version 4.0”, 2005.
[6] P. Sham, J.S. Bader, I. Craig, M. O’Donovan, and M. Owen, “DNA pooling: a tool for large scale association studies”, Nat Rev Genet, vol. 3, no.11, 2002, pp.862-71.
[7] E. Meaburn, L.M. Butcher, L.C. Schalkwyk, and R. Plomin, “Genotyping pooled DNA using 100K SNP microarrays:a step towards genomewide association scans”, Nucleic Acids Res, Vol. 34, No. 4, e27, 2006.
[8] C. Lu, “Improving the scaling normalization for high-density oligonucleotide GeneChip expression microarrays”, BMC
Bioinformatics, vol.5, 2004, pp.103.
[9] B.M. Bolstad, R.A. Irizarry, M. Astrand, and T.P. Speed, “A comparison of normalization methods for high density oligonucleotide array data based on variance and bias”, Bioinformatics, vol.19, no.2 , 2003, pp 185-193.
[10] R.A. Irizarry, B. Hobbs, F. Collin, Y.D. Beazer-Barclay, K.J. Antonellis, U. Scherf, T.P. Speed, “Exploration, Normalization, and Summaries of High Density Oligonucleotide Array Probe Level Data”, Biostatistics, vol.4, no.2,2003, pp.249-264.
[11] C.C. Barbacioru, Y. Wang, R.D. Canales, Y.A. Sun, D.N. Keys, F. Chan, K.A. Poulter, and R.R. Samaha, “Effect of various normalization methods on Applied Biosystems expression array system data”, BMC
Bioinformatics, vol.7, 2006, pp.533S.