A Work Project, presented as part of the requirements for the Award of a Master in
Management from the NOVA – School of Business and Economics.
TV advertisement and Social Networks: an
empirical study with young adults
Luca Sigot, nº 1050
Booklet I
A Project carried out on the Children Consumer Behavior course
Under the supervision of:
Professor Luisa Agante
Professor Michele Quintano
ABSTRACT
The aim of this research is to investigate the possible synergies between TV
commercials and a brand Facebook profile. Different executional cues were tested to
determine which one could create the greatest awareness of a brand profile and if, by
choosing one cue over another, the intention to visit a brand profile could be influenced
too. The experiment involved 400 young adults who were invited to watch a video
online and, subsequently, to complete a survey. Results suggest that while the different
cues were able to create different level of awareness, no effect could be observed on the
intention to visit the brand profile.
Keywords: Cross-media synergies, executional cues, Young Adults, brand Facebook
INTRODUCTION
Cross media campaigns are promotions that employ two or more communication
vehicles. The aim of this typology of strategies is to create synergies, whereby the
overall persuasion effect exceeds the sum of the single media effects (Caywood, Schultz,
& Wang, 1991; Naik & Raman, 2003 not in the references list). The current dominant
trend is moving away from the assumption that advertising effectiveness equals the
simple media exposure and is inquiring about the role of media integration and media
engagement (Calder & Malthouse, 2005). Since especially in the last decade new media
have been introduced to the general public, several studies (Ha & Chan-Olmsted, 2004;
Trappey & Woodside, 2005; Wang, 2011) have already started to investigate whether
the new and the traditional media could be linked to obtain synergetic effects.
The aim of this study is to explore if by combining the TV commercials and the brand
Facebook profiles there is some potential to achieve synergies. This has been done in
two steps. At first it was investigated whether TV viewers could recognize and
remember the invitation made in a commercial to visit the brand profile on the social
network. Given that the majority of commercials are nowadays using several different
executional cues to reach this objective, this study tends to verify which cue among the
most utilized are used in the advertising world. As a further step, it was analyzed if
those cues could also elicit different level of willingness to visit the brand Facebook
LITERATURE REVIEW AND FORMULATION OF AN HYPOTHESYS
Cross media campaigns are promotions that employ two or more communication
vehicles. The aim of this typology of strategies is to create synergies, whereby the
overall persuasion effect exceeds the sum of the single media effects (Caywood, Schultz,
& Wang, 1991; Naik & Raman, 2003).
Today the vast majority of advertising campaigns are designed to reach consumers
through several different media (Bronner, Neijens & Van Raaij 2003), but while
advertisers are fervent to boost audiences’ media experiences with cross-channel
integration (Ha & Chan-Olmsted, 2004; Trappey & Woodside, 2005; Wang, 2006b),
this field has received relatively little attention, since the prevailing focus has been the
research on single medium campaigns (Feichtinger, Hartl & Sethi, 1994). Different
sources of synergies have been identified over the years. Historically, the first one that
had been under study was the repetition effect, followed by the positive effect of
transmitting the same message through different sources. In the last decade the focus
has been shifted to the integration of the different media, taking into account especially
the various media engagements.
The repetition effect
The repetition effect is the result of a repeated exposure of the same advertisement
(Pechmann & Stewart 1988). The selective attention theory states that a repetition of the
same ad leads to increased attention (Kahneman, 1973). This has been proven by
several studies to strengthen the attitude toward the brand (Petty et al., 1983; Chaiken &
Maheswaran, 1994). The side effect of this strategy is that as the consumers are
exposed to the same commercial, they eventually reach a point from which they become
commercial, even though the approach or concept of the commercial is the same, will
revive interest level, increasing significantly the viewer's cognitive response activity
(Grass and Wallace, 1969; McCullough & Ostrom, 1974).
Transmitting the same message through different sources
Synergies also occur by the simple reason that consumers are exposed to different
sources of information. Consumers see the messages as independent bits of information
and consider the media exposure as viewing the information from different orientations.
Harkins & Petty (1981a, 1981b, 1987) were the firsts to conclude that by increasing the
number of message sources there was an intensification of the consumer information
and processing activity. For Maheswaran & Chaiken (1991) the notion that messages
from different sources, regarding a brand or a product, could produce a stronger brand
or product attitude, is based on the premise that consumers try to make sense of
multiple-source messages..
The Wang and Nelson (2006) study extended those results, stating that different media,
having in the same campaign varied messages for each media, resulted into an increase
on consumers’ purchase intentions.
Chatterjee (2011) observed that in the prior researches, synergy occurred only when
media differed in modality or in the number of sensory modes they possessed, and
concluded that even a simple variation of quantity and quality of information between
relatively similar media is a reliable source of synergies.
Dijkstra, Buijtels and Van Raaij (2005) challenged the concept that a multi-media
campaign could be more effective than a single-media promotion. They revealed that
multi media campaigns were stimulating more cognitive responses than Internet only
however, they recognized that in their experiment the participants in the TV-only group
had been exposed three times, while the participants in the multiple-media group were
only forced to see the ad once.
Chang and Thorson (2004) in their laboratory experiment found that exposing viewers
once to TV and once to Web did produce an effect that was superior to exposing the
viewer twice to the same media. To them cross media led not only to higher attention,
higher perceived message credibility and a greater number of total and positive
thoughts, but also to higher processing level than did repetition. The greater numbers of
positive thoughts were generated by perceived brand credibility and message credibility,
which resulted from the combined influence of both cognitive and social psychological
factors.
The integration of the different media
Media planners and advertising agencies need to grasp the strengths and weaknesses of
each media so to successfully transmit a message in a cross media campaign advertisers.
Of vital importance is a deep understanding about the process information intrinsic to
each media (Buchholz and Smith, 1991; Vakratsas and Ambler, 1999) and the
engagement level offered.
Synergy, in this optic, occurs when heterogeneous media with their particular strengths
are able to complement each other in a campaign or when the strength of one media
compensates for the weakness of another media (Dijkstra, Buijtels & Van Raaij, 2005).
A practical example of this concept is provided by Wang (2007). Because of the greater
media engagement and integration, consumers perceived stronger message strength
about his results can be retrieved in his later work (Wang, 2011), when he additionally
detected an improvement also of the attitude towards the media.
Schultz, Block and Raman (2012) recently tried to renovate the concept of cross media
synergies. They observed that the historical and traditional method of their
determination was primarily based on the marketers’ expenditures and provided little useful knowledge about the consumers. They argued that, especially in the digital and
interactive era, media synergy is as dependent on the actions of consumer as well as
what the marketer does. They discovered that even from the consumer perspective
synergies were clearly identifiable.
Redirecting from one media to another one
All those researches underline the role that one or more media held to direct a consumer
to another, more engaging media. Ha and Chan-Olmsted (2001) were the firsts to study
the possibility that the consumer could be redirected. In the specific case, their concern
was whether the TV could be a driver to Web visits. Contrary to the expectations, the
TV had no significant impact on the time invested on the web site. A different, even
contrary, conclusion was reached in their following article (Ha & Chan-Olmsted, 2001),
where they noticed that cable subscribers visited frequently and for a considerable
amount of time their network web site. Those contrasting results between the two
studies were explained by the authors as the result of the different designs of the two
investigations.
Both studies acknowledged that cross-promotion on TV is to be considered the most
out that the order of the driver to a web site is exactly the opposite, with word of mouth
being at the first place and TV at the third.
Calder and Malthouse (2005), discovered the existence of 22 different types of
engagement possible with the Web media. In a second moment, they widened their
research to ascertain how much the print media and the internet media were affecting
each other. According to their conclusions, the more printed usage- the stronger online
experiences related to online usage become, but it does not correlate otherwise with
online usage.
Trappey and Woodside (2005) attempted to discover the possibility to use SMS in a
cross media strategy. In their findings, a conspicuous part of the respondents reported
that they actually followed a TV program as a consequence of having received a SMS
prompting them to follow the show, and a small but relevant percentage even admitted
to have encouraged friends to behave in the same way.
Even if the simple reception of SMS encouraged viewer to watch an upcoming TV
program and significantly increased their abilities to report awareness, SMS was found
not suitable to provoke a change in people's attitudes toward the brand. The SMS media
appeared to be effective only in the function of redirecting the viewer to the more
engaging and effective media.
Indirectly complementing the previous study, Wouters and Wetzels (2006) evinced that
TV commercial and online advertisements were able to redirect consumers to the SMS
media, hence refusing the impossibility that SMS could become the engaging media.
Features to enhance redirecting
What has not been studied until now is which characteristics of one media are effective
analyze which feature of a TV commercial are the most entitled to create awareness of
the brand Facebook page and if different executional cues will have different impacts on
the willingness to visit the brand page on the social network.
There are already studies that have explored the TV advertisement cues, identifying the
most effective ones. However, the focus has solely been on the brand itself, and not on
other informative elements, like a fair trade logo, a sponsorship to the Olympic Games
or, as it will be under evaluation on this study, the link to the brand Facebook profile.
Logo VS text
From the branding literature, it can be deducted that visual symbols are an effective tool
to communicate with customers (MacInnis et al., 1999). Generally, symbols can convey
more substantial benefits than text or names (Park et al., 2012).
Esthetically attractive symbols promote favorable attitude formation and memory
retrieval by enabling brands to become more prominent and vivid in the consumers'
minds (Fischer et al., 1991; Henderson & Cote, 1998). Furthermore they stimulate
strong affective and behavioral responses (Bloch, 1995). Nonetheless, Chandon et al.
(2003) found the presence of the image not producing any significant impact.
RQ 1: The Facebook logo has a higher positive impact on the awareness of the link to
the brand Facebook page than the text reference.
Audio VS video
Studies about television communication (Gunter, 1983; Katz, Adoni, & Parness, 1977)
pointed out that the dominant information is generally carried by audio channels, while
Confirmation of the primacy of the audio mode over the video mode was offered by
Kyffin (1988), who discerned that the former stimulation prevailed over the latter in
terms of easiness to remember. Grimes (1994) results contrast with the previous
analysis, offering evidence that visual advisories were the most effective in helping
viewers to remember and recommended the use of distinctive video to draw the
consumer attention. However, since the advent of multitasking, audio is once more
regarded as the most effective channel (Voorveld et al., 2011).
RQ2: The audio reference to the Facebook page has a higher positive impact on the
awareness of the brand Facebook page than the text reference.
RQ3: The audio reference to the Facebook page has a higher positive impact on the
awareness of the brand Facebook page than a logo reference.
Dual mode
Dual mode is the execution of both visual and verbal cues. Earlier researches did show a
partial effectiveness, although the results were indirectly contrasting. Gupta and Lord
(1998) witnessed that when the visual clue was prominent, the verbal clue did not add
any incremental benefit. Brennan and Babin (2004) contemplated that dual mode scored
higher level of awareness only when compared to the sole visual modality, but not
against the verbal-only modality. However, more recent researches (Romaniuk, 2008;
Romaniuk & Lock, 2008; Romaniuk, 2009) supported the hypothesis that dual mode
produced a stronger impact on viewers that the sum of the two cues would achieve
RQ4: Dual mode, or the presence of both visual and verbal cues of the link to the
Facebook page, has a greater impact on the awareness of the brand Facebook page than
any of the audio/video only mode.
Duration
Duration as an executional clue has been researched over the years with different
outcomes. The first to assess its impact were Stewart and Furse (1986), who did not
find any correlation between the variable and the level of consumer awareness. In
Stewart and Koslow (1989) the authors reached the same conclusion: more branding
does not mean more effective branding. More recently Romaniuk (2008) at first seemed
to converge at the same verdict, but in Romaniuk and Lock (2008) it was discovered that
positive effects on awareness became statistically significant if the logo appeared in the
TV commercial for more than 10 seconds and seemed to be the most efficient
executional clue.
Therefore:
RQ 5: The duration of the link to the Facebook page has the strongest positive impact
on the awareness of the brand Facebook profile.
Finally, this study will investigate whether by using different executional cues TV
commercial could redirect the viewers to the Social Networks, creating in this way
significant synergies. Since the different executional cues do have different impacts on
the consumers, it is expected that choosing a given clue, it will also vary the level of
RQ6: Different executional cues have a different impact on the intention to visit the
Brand Facebook profile.
Methodology
The population we chose to study was the young adults. The literature has different
definitions of this population age range, with the upper limit ranging from the age of 24
years to the age of 36 years. We adopted the most used definition of Young Adults from
Freedman et al. (2012), since it appears to be the most common in practice, and which
defines them as people aged between 18 and 25 years old,.
Proceeding
The experiment was designed in order to deliver a natural experience of TV viewing
(Chang & Thorson, 2004; Dikistra et al., 2005; Voorveld, Neijens & Smith, 2011). We
requested each participant to watch a short collection of news. They were divided into 5
groups, one for each stimulus under study. All groups were exposed to a total of three
news stories, with a cluster of four commercials inserted between the second and the
third stories. The first new story was related to the revived interest in Japan of the
traditional national game in the younger generation, while the second one described the
addiction fighting through the use of sports. The third and last news story reported the
results of the Unicef educational program in Sri-Lanka. All the news stories were in
English and taken from the CNN or BBC channels.
For the commercial cluster, special attention was paid to avoid the bias existing from
prior knowledge of a brand or commercial, proven to influence people's information
processing and message elaboration (Celsi and Olson 1988; Yang et al., 2004).
Thorson, 2004; Voorveld, Neijens & Smith, 2012), the possible bias was minimized with
the adoption of commercial with unfamiliar brands. Only North American and Eastern
commercials brands were deployed in the experiment. The brands were not advertised
in Europe and a manipulation check revealed that none of the participants had seen the
ads before. The TV commercials were in English and lasted about 30s. Following
Voorveld et al. (2012) methodology the target commercial (Exel) was shown in the third
position. The stimuli were placed in the commercial in the following way:
For the text reference, a written invitation “Follow us on Facebook.com/Exel” was added in the top right of the screen. The duration of the text coincided with the last
scene of the commercial and lasted 2.11 seconds started at minute 5.34 of the entire
video. The actual screenshot can be seen in the Annex, Fig. 1.
For the logo reference, a symbol of Facebook was placed in the bottom right of the
screen, appearing in the commercial only for the final 2.11 seconds and started at
minute 5.34 of the entire video. The actual screenshot can be seen in Annex, Fig. 2.
For the audio reference, a female voiceover invited the viewers to “Follow us on Facebook”. The sentence had length of 2.25 seconds, and started at minute 5.33. The
actual screenshot can be seen in the Annex, Fig. 3.
The Dual mode variable was the simple combination of the logo reference and the audio
reference. Finally, to test the duration cues, the Facebook symbol employed in the logo
reference was shown for the whole duration of the commercial (of 30 seconds), which
Variables
Attention to the commercial
The attention to the commercial was measured with Bulchoz (1991) and Lacziak (1993)
methodology. The participants were required to answer five different questions,
evaluating the answers with 5-point Likert scale ranging from 1 (strongly disagree) to 5
(strongly agree). The questions were: “How much attention did you pay to the third
(Exel) commercial?”, “How much did you notice the third (Exel) commercial?”, “How
much thought did you put into evaluating the third (Exel) commercial?”, “How much
were you involved with the third (Exel) commercial”, “How much did you concentrate
on the third (Exel) commercial?”.
In order not to create too much awareness about the target commercial in the
participants and distorting the results of this study, the attention to the commercial
cluster was also tested by assessing the attention paid to the Dove commercial (located
in the second position).
Recognition
For the recognition measure, it was employed the methodology developed by Shapiro et
al. (1997). Participants were exposed to four different characteristics that could have
been showed in the commercials and were asked to select the ad that was in the target
commercial. Only one had been actually showed and the other three were shown only as
distracters. Specifically, the distracters were the Fair Trade logo, the 2012 Olympic
game sponsor logo and a boat logo present in the first commercial.
All distracters needed to be relevant to the buying situation. The distracter ads needed
to be sufficiently different from one another and from the target ad in order to make it
unlikely that subjects, who actually saw the ad, could not discriminate which variant in
The recognition measure was supplemented by a confidence measure asking subjects to
indicate how confident they were in identifying the correct reference (1 = not at all
confident; 9 = very confident). With the aim to construct the weighted recognition
measure, it was given to the recognition scores a code of 0 if subjects did not correctly
identify the target ad and a code of 1 if they did it. This value was then multiplied by the
confidence rating response.
Intention to visit the Brand profile on Facebook
The intention to visit the Brand profile on Facebook was estimated with two different
approaches. The first, suggested by Rise, Kovac, Kraft, and Moan (2008), inquired
about the general intention, the expectation and the possibility to visit the brand profile.
The second, as per Wong and Capella (2009), asked the participants the likeness in a
specific time-frame, the following week, to enact this decision. All the responses were
measured on a 5-point Likert scale ranging from 1 (very unlikely) to 5 (very likely).
Facebook usage
To provide a measure of Facebook usage, participants were asked to estimate their time
spent on Facebook as well as how often they checked Facebook (Junko, 2012). They
were asked, in a first moment, to estimate the time spent on an average day and the time
spent the day before. The response options were categorized into five groups: less than
1 hour, 1 to 2 hours, 2 to 3 hours, 3 to 4 hours and more than 4 hours. Similarly, the
average number of times they logged in Facebook was also measured both on the daily
and on the day before basis. The answers ranged from none to more than 8 times.
Attitude toward brand profiles on Facebook
The evaluation of his variable was adapted from several previous studies regarding the
attitude towards online advertisement (Pollay & Mittal, 1993; Yang et al., 2004; Azeem
agree) was developed for several items chosen from different dimensions of belief
including informative (The brand profiles on Facebook are a valuable source of
information), materialistic (The brand profiles on Facebook promote a materialistic
society), irritating (The brand profiles on Facebook are annoying), consumers’ welfare (The brand profiles on Facebook are essential ), hedonic (The brand profiles on
Facebook are entertaining and enjoyable), credible (The brand profiles on Facebook are
trustworthy and believable), manipulative (The brand profiles on Facebook persuade
people to buy things they should not buy), values distortion (The brand profiles on
Facebook promote undesirable values in our society).
Descriptive results
The survey comprehended 427 respondents, of which only 400 were considered valid
since they reached completion. The sample was composed by young adults, split quite
evenly in the gender (50,2 females and 49,8 males), having a mean age corresponding to
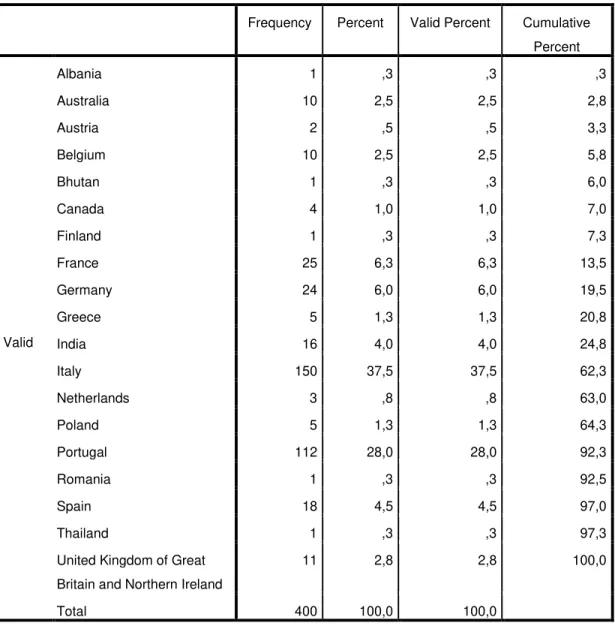
21,2 years (SD=0,996) and having 19 different nationalities, of which the majority
being from the European Union1.
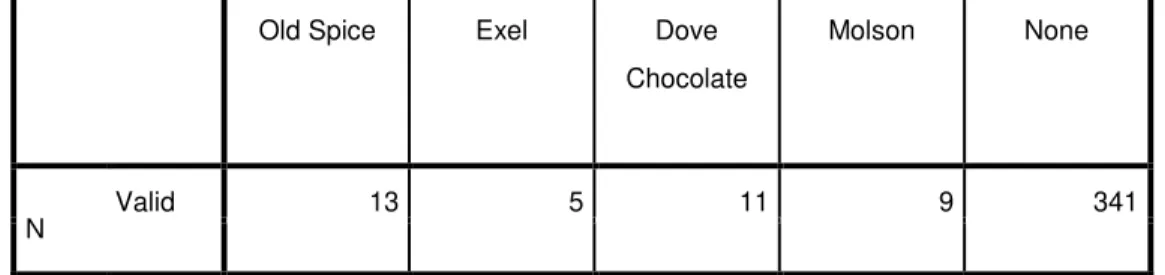
The effect of prior brand knowledge can be considered inexistent, since only 5 people of
the 45 participants that stated to know one or more of the brands shown, declared some
familiarity with the Exel brand2.
Mean comparisons
Anova tests were employed to verify the research questions3. In order to proceed with
an Anova omoschedastic test, a Levene’s test for homogeneity of variances was run
beforehand to ensure its adequacy. The Levene statistic resulted to be 0,81, having a p
1 Only x participants were from non-EU countries. See Tables 1, 2 and 4 in Appendix aa – Booklet 2: 2 See Table 3 in Appendix aa – Booklet 2
value equal to 0,519, validating the acceptability of the selected tests. There was a
statistically significant difference at the p<0.001 level in LOT scores for the 5 different
variable: F (5; 394)= 18,107, p < 0,001. Once differences were ascerned, further
post-hoc comparisons were made to compare the effects of the various stimuli and to
determine their significance. All the complete results can be seen in the Booklet 2:
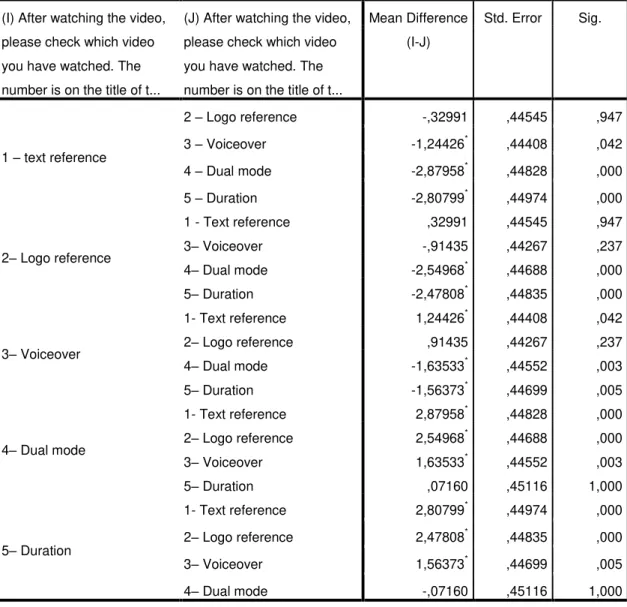
Appendix 2.2. The main results can be seen in table 1, resuming the mean differences
between the various stimuli and highlighting them when significant.
Table 1 – Main Results
The difference was calculated as Mean of the Column minus the mean of the row, and
the significance level threshold was set with p=0,05.
On those basis, the assumption made in RQ1, stating that the Facebook logo has
significantly higher positive impact on the awareness to the brand Facebook profile than
a text reference, is to be refused since the mean difference between the text reference
(1,6076) and the logo (1,9375) was non-significant (p=0,947).
The audio reference alone (mean = 2,8519) had a higher impact on the awareness than
observed with the logo reference, since the mean difference resulted to be
non-significant (p=0,237). Therefore, while RQ2 was accepted, RQ3 was rejected.
RQ4 enunciated that dual mode, or the presence of both a visual and audio cues, had a
greater impact than any of the single variable taken alone. The dual mode mean
(4,4872) differed significantly from the logo variable (p = 0) and from the Audio
variable (p = 0). Hence, RQ4 was validated.
RQ5 considered the duration (mean = 4,4156) as the most effective variable. Since
against the dual mode no significant difference was observable (p=1), this hypothesis
has to be rejected. Nevertheless, substantial disparity could be found when comparing
the duration either with the text reference (p=0,000), the logo (p=0,000.) or the audio
stimuli (p=0,005), confirming its overall efficacy.
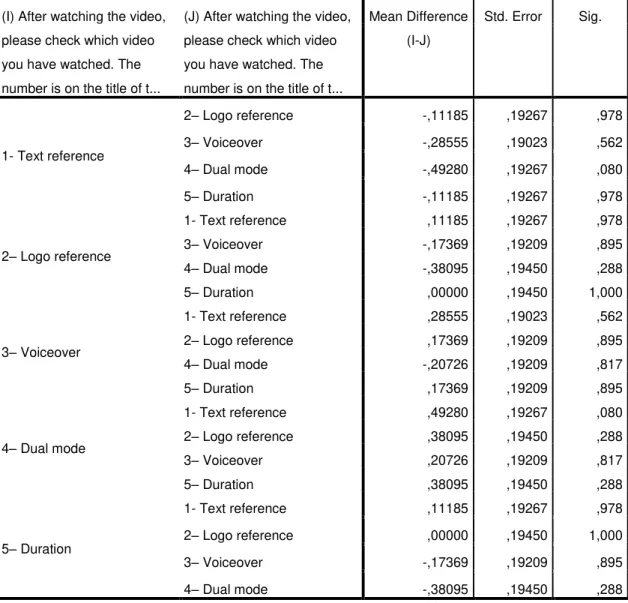
The analysis of the impact on the intentions to visit the Facebook page, depending on
the different variables was conducted with the same initial procedures described in the
previous paragraph4. Levene’s test results were 0,169, and the p value (0,954) allowed the use of the Anova test. The Anova test rejected the possibility of the different
features to have significant different impacts on the intention to visit the Brand
Facebook profiles. The result of the test was F(5, 394)= 2,124, but, inexpertly, at this
point the p value (0,077) was well above the accepted limit of 0,05. Moreover, the
multiple comparisons did not find any significant difference in the outcomes of the
different cues5. Therefore RQ6 is to be considered rejected.
Discussion
This study had two different focuses. In the first part of this work several different
executional cues were compared in order to find which ones were the most apt to create
awareness in the viewers and in the second part it was inspected whether different cues
could have different persuasive impact on the willingness to visit the Brand Facebook
profile.
When comparing the two visual cues taken into consideration, no difference on the
consumers’ level of awareness was discerned. Whether in the last second of a TV
commercial a text reference, like the written internet address, or the Facebook logos
appeared, the ex-post recollection of the aforementioned cues remained unchanged.
Those results differ with the previous researches since the added benefits that an image
could have over the test, promoted by several authors (Park et al., 2012 not in the list,
Fischer et al., 1991; Henderson & Cote, 1998), did not find any support ground in this
study.
Regarding the audio reference, enacted through voice over, it was validated that it had a
significant higher impact on the viewer than the test reference, following the same
pattern found in Gunter (1983) and Voorveld et al. (2011). At the same time, the use of
a logo reference or of a voice over could be considered equivalent since they had the
same impact on the awareness of the viewers.
Dual mode, or the presence of both visual and audio executional cues, was proven to be
the most effective modality to create awareness in the viewer. Contrary to Brennan and
Babin (2005) findings, it scored not only higher level of awareness when compared to
the visual-only modality, but also against the verbal-only modality. Furthermore, as the
pointed out, the impact on viewers resulted to be stronger that the sum of the two cues
would achieve separately.
Duration also appeared to be a particularly effective executional clue, showing a
significant better performance than the text reference, the logo and the audio mode,
confirming the findings of the recent study of Romaniuk and Lock (2008).
Therefore, advertisers that want their audience to be aware of the Brand profile on the
social networks should opt either for the dual mode or for the Facebook logo with
duration of 10 seconds or more. However, since space and time are precious for TV
commercials, especially in the 30 seconds format, having executional cues for an
extended period of time may impose some opportunity costs, deriving for example from
the possible deviation of important attention from the product itself.
The second part of this research suggests that different executional cues do not possess
the ability to stimulate different levels of intention to visit the brand Facebook profile.
This study was unable to observe any significant difference on the willingness to visit
the brand profiles, and no apparent synergy between the television media and the social
media was found. This notion could be particularly helpful when considering that an
increasing number of TV commercial are promoting their Facebook profile. If this link
is, as investigated, insufficient to redirect consumers from one platform to another,
improvements or other alternative actions should be taken into consideration.
Limitation and further research
This study explored the effect on the awareness of the Brand Facebook profile and on
the intention to visit it. The results presented in this paper provide insights to
capability of informing the TV viewer about a brand profile on a social network.
Nevertheless, neither a link nor some synergy was individuated between the TV
commercial and the profile on the social Networks. Consumers may be affected by the
first and may visit the second, but they are not redirected from one to the other.
This study has several limitations. For example, different results could be obtained with
a bigger sample of the population. Moreover, investigations taking into consideration
not only the young adults segment but the more mature adults as well could bring
further benefits. Indeed, while the young adults are considered the heaviest user of the
new media, they appear, in the literature, to be also the ones with the shortest attention
span. Furthermore, the subjects where tested only in a normal and traditional viewing
experience. Further research could investigate whether in presence of multitasking or
interactive television, the responses to the TV commercial would differ. Finally, to the
author knowledge, this is the first study that tries to investigate the potential synergies
that social media could have with other media. Synergies could be possibly discovered
between the social networks and more involving media, such as Blogs or specialized
Website, or more targeting media, like SMS.
References
Azeem A. and Haq Z., 2012, Perception towards Internet Advertising: A Study With Reference to Three Different Demographic Groups, in “Global Business and Management Research: An International Journal”, Vol. 4, N. 1.
Bloch P. H., 1995, Seeking the Ideal Form: Product Design and Consumer Response, in “Journal of Marketing”, Vol. 59, N. 3, p 16–29.
Brennan I. and Babin L. A., 2004, Brand Placement Recognition: The Influence of Presentation Mode and Brand Familiarity, in “Handbook of Product Placement in the Mass Media”, Vol 10, N 1
Bronner A. E., Neijens P.C. and Van Raaij W.F., 2003, Multimedia campagnes: Populair maar
Calder B. J. and Malthouse E. C., 2005, Managing media and advertising change with integrated marketing, in “Journal of Advertising Research”, Vol 45, N.4, 356– 361.
Caywood C. L., Schultz D. E. and Paul Wang, 1991, A Survey of Consumer Goods Manufacturers, New York: American Association of Advertising Agencies.
Celsi R. and Olson J., 1988, The role of involvement in attention and comprehension processes, in “The Journal of consumer research”, Vol 15, 210 - 224.
Chaiken S. and Maheswaran D., 1994, Heuristic Processing Can Bias Systematic Processing: Effects of Source Credibility, Argument Ambiguity and Task Importance on Attitude Judgment, in “Journal of Personality and Social Psychology”, Vol 66, N. 3, 460–73.
Chandon J. L., Chtourou M. S., and Fortin D. R., 2003, Effects of configuration and exposure levels on responses to web advertisements, in “Journal of Advertising Research”, Vol 43, N. 2, 217-229. Chang Y. and Thorson E., 2004, Television and web advertising synergies, in “Journal of Advertising”, Vol. 33, N. 2, 75–84.
Chan-Olmsted S.M., 2004, In search of partnerships in a changing global media market: Trends and drivers of international strategic alliances, in “Strategic Responses to Media Market Changes”, Picard, R. G., ed. Jonkoping, Sweden: Jonkoping International Business School, Ltd
Chatterjee P., 2012, The role of varying information quantity in ads on immediate and enduring cross-media synergies, in “Journal of Marketing Communications”, Vol. 18, N. 3, 217-240
Coffey S., and Stipp H., 1997, The interactions between computer and television usage, in “Journal of Advertising Research”, Vol. 37, N. 2, 61-67.
Deloitte, 2012, State of media democracy 2012, available at http://www.deloitte.com/assets/Dcom- UnitedKingdom/Local%20Assets/Documents/Industries/TMT/uk-tmt-state-of-the-media-democracy-report-2012.pdf
Dijkstra M., 2002, An experimental investigation of synergy effects in multiple-media advertising campaigns, PhD diss., University of Tilburg. 170 P.C. Neijens and P. de Pelsmacker
Dijkstra M., Buijtels H. and Van Raaij W. F., 2005, Separate and joint effects of medium type on consumer responses: A comparison of television, print, and the Internet, in “Journal of Business Research”, Vol. 58,N. 3, 377–86.
Edell J.A. and Keller K. L., 1989, The information processing of coordinated media campaigns, in
“Journal of Marketing Research”, Vol. 26, N. 2, 149–63.
Edell J.A. and Keller K. L., 1999, Analyzing media interactions: The effects of coordinated TV-print advertising campaigns, Cambridge, MA: Marketing Science Institute.
Enoch G. and Johnson K., 2010, Cracking the Cross-Media Code: How to Use Single-Source Measures to Examine Media Cannibalization and Convergence, in -2Journal of Advertising Research”, Vol. 50, N. 2 125–136.
Feichtinger G., Hartl R. and Sethi S. P., 1994, Dynamic Optimal Control Models in Advertising: Recent Developments, in Management Science, Vol. 40, N. 2, 195–226.
Freedman K. S., Nelson N. M. and Feldman L. L., 2012, Smoking initiation among young adults in the United States and Canada, 1998-2010: a systematic review. , available at
http://www.cdc.gov/pcd/issues/2012/11_0037.htm
Gilder G., 1994, Life After Television, Updated, in “Forbes”, February 28.
Grass R. C. and Wallace W. H., 1969, Satiation Effects of TV Commercials, in “Journal Advertising Research”,Vol. 9, N. 3, 3-8.
Grimes T., Rimmerb T. and Boiarskyc G. , 1994, TV news simulations and their interaction with viewer memory, in “Communication Reports” , Vol. 7, Issue 1.
Gunter B., 1983, Forgetting the news, in E. Wartella & D.C. Whitney (Eds.), Mass Communication Gupta P. B. and Lord K. R., 1998, Product Placement in Movies: The Effect of Prominence and Mode on Audience Recall, in “Journal of Current Issues and Research in Advertising”, Vol. 20, N. 1, 47-59. Ha L. and Chan-Olmsted S. M., 2001, Enhanced television as brand extension: Television viewers’
perception of enhanced television features and television commerce on broadcast networks’ Web sites, in
“International Journal on Media Management”, Vol. 3, N. 4, 202–213.
Harkins S. G. and Petty R. E. , 1981a, Effects of Source Magnification of Cognitive Effort on Attitudes: An Information-Processing View, in “Journal of Personality and Social Psychology”, Vol. 40, N. 3, 401-413.
Harkins S. G. and Petty R. E. , 1981b, The Multiple Source Effect in Persuasion: The Effects of Distraction, in "Personality and Social Psychology Bulletin”, Vol. 7, N. 4, 627-635.
Harkins S. G. and Petty R. E. , 1987, Information Utility and the Multiple Source Effect, in “Journal of Personality and Social Psychology”, Vol. 52, N. 2, 260-268.
Henderson P.W. and Cote J.A, 1998, Guidelines for selecting or modifying logos, in “Journal of Marketing”, Vol. 62, N. 2, 14-30.
Havlena, W., R. Cardarelli, and M. De Montigny. 2007. Quantifying the isolated and synergistic effects of exposure frequency for TV, print, and internet advertising. Journal of Advertising Research 47: 215– 21.
Junco R., 2012, The relationship between frequency of Facebook use, participation in Facebook activities, and student Engagement, in “Computers & Education”, Vol. 58, N. 1, 162–171 Kahneman D., 1973, Attention and effort, Englewood Cliffs, NJ: Prentice-Hall.
Kyffin D., 1988, Direct marketing: Plugging the phone, Marketing, 55
Katz E., Adoni H. and Parness P., 1977, Remembering the news: What the picture adds to recall, In
“Journalism Quarterly”, Vol. 54, 231–239
Lacziak R. N., 1993, The relationship between experimental manipulations and tests of theory in an advertising message involvement context, in “Journal of Advertising”, Vol. 22, N. 3.
MacInnis D. J., Moorman C. and Jaworski B. J., 1991, Enhancing and Measuring Consumers Motivation, Opportunity, and Ability to Process Brand Information From Ads, in "Journal of Marketing”, Vol. 55, N. 4, 32-53.
Maheswaran D. and Chaiken S., 1991, Promoting systematic processing in low involvement settings: Effect of incongruent information on processing and judgment, in “Journal of Personality and Social Psychology”, Vol. 61, N. 1, 13–25.
McCullough, J. L. and Ostrom T. M., 1974, Repetition of highly similar messages and attitude change,
Naik P. A. and Raman K., 2003, Understanding the Impact of Synergy in Multimedia Communications, in Journal of Marketing Research, Vol. 40, N. 4, 375-388.
Park C.W., et al., 2012, The role of brand logos in firm performance, in “Journal of Business Research” , available at http://dx.doi.org/10.1016/j.jbusres.2012.07.011
Pechmann C. and Stewart D. W., 1988, Advertising Repetition: A Critical Review of Wearing and Wearout, in “Current Issues and Research in Advertising”, Vol. 11, N. 2, 285-329.
Petty R. E., Cacioppo J. T. and Schumann D., 1983, Central and Peripheral Routes to advertising Effectiveness: The Moderating Role of Involvement, in "Journal of Consumer Research”, Vol. 10, 135-146.
Pollay R. W. and Mittal B., 1993, Here’s the beef: Factors, determinants and segments in consumer
criticism of advertising, in “Journal of Marketing”, Vol. 57, N. 7, 99-114.
Rise J., Kovač V. B., Kraft P. and Moan I. S., 2008, Predicting the intention to quit smoking and quitting behaviour: extending the theory of planned behavior, in “British Journal of Health Psychology” ,Vol. 13, 291-310.
Romaniuk J., 2008, The Effectiveness of Branding Execution Tactics within Television Advertisements, Ehrenberg-Bass Institute Working Paper.
Romaniuk J. and Lock C., 2008, The Recall of Brand Placements with Television Shows, Ehrenberg-Bass Institute Working Paper.
Romaniuk J., 2009, The Efficacy of Brand-Execution Tactics in TV Advertising, Brand Placements, and Internet Advertising, in “Journal of Advertising Research”, Vol. 49, N. 2, 143-159.
Schultz D.E., Block M.P. and Raman. K., 2009b, Media synergy comes of age, part 2, in “Journal of Direct, Data and Digital Marketing Practice”, Vol. 11,N. 2, 88–99.
Schultz D.E., Block M.P. and Raman. K., 2012, Understanding consumer-created media synergy, in
“Journal of Marketing Communications”, Vol. 18, N. 3, 173-187.
Sengupta J. and Johar G. V., 2002, Effects of inconsistent attribute information on the predictive value of product attitudes: Toward a resolution of opposing perspectives, in “Journal of Consumer Research”, Vol. 29, N.2, 39–56.
Shapiro S., MacInnis D. J. and Heckler S. E., 1997, The Effects of Incidental Ad Exposure on the Formation of Consideration Sets, in “Journal of Consumer Research”, Vol. 24, N. 1, 94-104.
Stewart D. W. and Furse D. H., 1986, Effective Television Advertising: A Study of 1000 Commercials, Lexington, MA: Lexington Books
Stewart D. W. and Koslow S., 1989, Executional Factors and Advertising Effectiveness: A Replication, in
“Journal of Advertising”, Vol. 18, N. 3, 21-32.
Trappey R. J. and Woodside A. G., 2005, Consumer responses to interactive advertising campaigns coupling short-message-service direct marketing and TV commercials, in “Journal of Advertising Research”, Vol. 45, N. 4, 382–401.
Vakratsas D. and Ambler T., 1999, How advertising works: what do we really know?, in “Journal of Marketing ”, Vol 63, N. 1, 26–43.
Wang A., 2006b, When synergy in marketing communication online enhances audience response: The effects of varying advertising and product publicity messages, in “Journal of Advertising Research”, Vol. 46, N. 2, 160–170.
Wang A., 2007, Branding over mobile and internet advertising: The cross-media effect, in “International Journal of Mobile Marketing”, Vol. 2, N. 1, 34–42.
Wang A., 2011, Branding over Internet and TV Advertising, in “Journal of Promotion Management”, Vol. 17, 275–290.
Wang A. and Nelson R. A., 2006, The Effects of Identical Versus Varied Advertising and Publicity Messages on Consumer Response, in “Journal of Marketing Communications”, Vol. 12, N. 2, 109–123. Wong N. and Cappella J.N., 2009, Antismoking Threat and Efficacy Appeals: Effects on Smoking Cessation Intentions for Smokers with Low and High Readiness to Quit, in “Journal of Applied Communication Research”, Vol. 37, N. 1, 1-20.
Wouters J. and Wetzels M., 2006, Recall effect of short message service as a complementary marketing communications instrument, in “Journal of Advertising Research”, Vol. 46, N. 2, 209–216.
Yang M., Roskos-Ewoldsen B. and Roskos-Ewoldsen D. R., 2004, Mental models for brand placement. In L. J. Shrum (Ed.), The psychology of entertainment media: Blurring the lines between entertainment & persuasion, 79–98, Mahwah, NJ: Erlbaum.
Annex
Fig. 1 Text reference Fig 2: Logo reference
Fig. 3 Audio reference
A Work Project, presented as part of the requirements for the Award of a Master
Management from the NOVA – School of Business and Economics.
TV advertisement and Social Networks: an
empirical study with young adults
Luca Sigot, nº 1050
Booklet II: Appendix
Table of Contents (Appendix)
1. Survey ... 3
2. SPSS Output ... 16
2.1 Section 1: Descriptive ... 16
Table 1: Age of the participants ... 16
Table 2: Gender of participants ... 16
Table 3: Brand prior knowledge ... 16
Table 4: Participant Home Countries ... 17
2.2 Section 2: Awareness of the brand Facebook profile ... 18
Table 5: Descriptive of the executional clues ... 18
Table 6: Test of homogeneity of variances ... 18
Table 7: ANOVA Test ... 18
Table 8: Robust tests of equality of means ... 18
Table 9: Means Comparisons ... 19
2.3 Section 3: Intentions to visit the brand Facebook profile ... 20
Table 10: Test off homogeneity of variances ... 21
Table 11: ANOVA Test ... 21
Table 12: Roust tests of equality of means ... 21
Table 13: Multiple comparison ... 22
Table 14: Intention 3 ... 23
2.
SPSS Output
2.1 Section 1: Descriptive
Table 1: Age of the participants
N Minimum Maximum Mean Std. Deviation
Newage 400 18,00 25,00 21,2200 1,99287
Valid N (listwise) 400
Table 2: Gender of the participants
Frequency Percent Valid Percent Cumulative
Percent
Valid
Male 199 49,8 49,8 49,8
Female 201 50,3 50,3 100,0
Total 400 100,0 100,0
Table 3: Brand Prior knowledge
Old Spice Exel Dove
Chocolate
Molson None
N
Table 4: Participant Home Countries
Frequency Percent Valid Percent Cumulative
Percent
Valid
Albania 1 ,3 ,3 ,3
Australia 10 2,5 2,5 2,8
Austria 2 ,5 ,5 3,3
Belgium 10 2,5 2,5 5,8
Bhutan 1 ,3 ,3 6,0
Canada 4 1,0 1,0 7,0
Finland 1 ,3 ,3 7,3
France 25 6,3 6,3 13,5
Germany 24 6,0 6,0 19,5
Greece 5 1,3 1,3 20,8
India 16 4,0 4,0 24,8
Italy 150 37,5 37,5 62,3
Netherlands 3 ,8 ,8 63,0
Poland 5 1,3 1,3 64,3
Portugal 112 28,0 28,0 92,3
Romania 1 ,3 ,3 92,5
Spain 18 4,5 4,5 97,0
Thailand 1 ,3 ,3 97,3
United Kingdom of Great
Britain and Northern Ireland
11 2,8 2,8 100,0
2.2 Section 2: Awareness of the brand Facebook profile
Table 5: Descriptives of the executional cues
Variables
N Mean Std.
Deviation
Std. Error 95% Confidence Interval for
Mean
Lower Bound Upper Bound
1 – Text reference
79 1,6076 2,65261 ,29844 1,0134 2,2017
2 – Logo reference
80 1,9375 2,69244 ,30102 1,3383 2,5367
3 – Voiceover 81 2,8519 2,75731 ,30637 2,2422 3,4615
4 – Dual mode 78 4,4872 3,01831 ,34176 3,8067 5,1677
5 - Duration 77 4,4156 2,91254 ,33192 3,7545 5,0767
Totala 395 3,0456 3,04250 ,15308 2,7446 3,3465
a
The total number is given by the sample N (400) minus the number of variables under study (5)
Table 6: Test of Homogeneity of Variances
Levene Statistic df1 df2 Sig.
,810 4 390 ,519
Table 7: ANOVA test
Sum of Squares Df Mean Square F Sig.
Between Groups 571,246 4 142,812 18,107 ,000
Within Groups 3075,934 390 7,887
Total 3647,180 394
Table 8: Robust Tests of Equality of Means
SeeFb
Statistica df1 df2 Sig.
Welch 17,659 4 194,656 ,000
Table 9: Multiple Comparisons
(I) After watching the video,
please check which video
you have watched. The
number is on the title of t...
(J) After watching the video,
please check which video
you have watched. The
number is on the title of t...
Mean Difference
(I-J)
Std. Error Sig.
1 – text reference
2 – Logo reference -,32991 ,44545 ,947
3 – Voiceover -1,24426* ,44408 ,042
4 – Dual mode -2,87958* ,44828 ,000
5 – Duration -2,80799* ,44974 ,000
2– Logo reference
1 - Text reference ,32991 ,44545 ,947
3– Voiceover -,91435 ,44267 ,237
4– Dual mode -2,54968* ,44688 ,000
5– Duration -2,47808* ,44835 ,000
3– Voiceover
1- Text reference 1,24426* ,44408 ,042
2– Logo reference ,91435 ,44267 ,237
4– Dual mode -1,63533* ,44552 ,003
5– Duration -1,56373* ,44699 ,005
4– Dual mode
1- Text reference 2,87958* ,44828 ,000
2– Logo reference 2,54968* ,44688 ,000
3– Voiceover 1,63533* ,44552 ,003
5– Duration ,07160 ,45116 1,000
5– Duration
1- Text reference 2,80799* ,44974 ,000
2– Logo reference 2,47808* ,44835 ,000
3– Voiceover 1,56373* ,44699 ,005
Section 3: Intentions to visit the brand Facebook profile
Table 10: Test of Homogeneity of Variances
Levene Statistic df1 df2 Sig.
,237 4 387 ,917
Table 11: ANOVA
Sum of Squares Df Mean Square F Sig.
Between Groups 11,591 4 2,898 1,989 ,095
Within Groups 563,679 387 1,457
Total 575,270 391
Table 12: Robust Tests of Equality of Means
Statistica df1 df2 Sig.
Welch 1,901 4 193,258 ,112
Brown-Forsythe 1,991 4 382,992 ,095
Table 13: Multiple Comparisons
(I) After watching the video,
please check which video
you have watched. The
number is on the title of t...
(J) After watching the video,
please check which video
you have watched. The
number is on the title of t...
Mean Difference
(I-J)
Std. Error Sig.
1- Text reference
2– Logo reference -,11185 ,19267 ,978
3– Voiceover -,28555 ,19023 ,562
4– Dual mode -,49280 ,19267 ,080
5– Duration -,11185 ,19267 ,978
2– Logo reference
1- Text reference ,11185 ,19267 ,978
3– Voiceover -,17369 ,19209 ,895
4– Dual mode -,38095 ,19450 ,288
5– Duration ,00000 ,19450 1,000
3– Voiceover
1- Text reference ,28555 ,19023 ,562
2– Logo reference ,17369 ,19209 ,895
4– Dual mode -,20726 ,19209 ,817
5– Duration ,17369 ,19209 ,895
4– Dual mode
1- Text reference ,49280 ,19267 ,080
2– Logo reference ,38095 ,19450 ,288
3– Voiceover ,20726 ,19209 ,817
5– Duration ,38095 ,19450 ,288
5– Duration
1- Text reference ,11185 ,19267 ,978
2– Logo reference ,00000 ,19450 1,000
3– Voiceover -,17369 ,19209 ,895
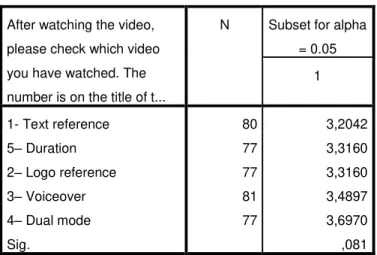
Table 14: Intention3
After watching the video,
please check which video
you have watched. The
number is on the title of t...
N Subset for alpha
= 0.05
1
1- Text reference 80 3,2042
5– Duration 77 3,3160
2– Logo reference 77 3,3160
3– Voiceover 81 3,4897
4– Dual mode 77 3,6970
Sig. ,081
Table 15: Kruskal-Wallis Test
After watching the video,
please check which video
you have watched. The
number is on the title of t...
N Mean Rank
Intention3
1- Text reference 80 174,78
2– Logo reference 77 190,22
3– Voiceover 81 205,68
4– Dual mode 77 221,97
5– Duration 77 190,22
Test Statistics
Intention3
Chi-Square 7,902
Df 4