© FECAP
RBGN
Received on October18, 2013 Approved on February27, 2015
1. Hiram Ting PhD in Marketing from Universiti MalaysiaSarawak, Malaysia
2.Ernest Cyril de Run PhD in Marketing from University of Otago, New Zealand
3.Ramayah hurasamy Masters of Business
Administration, Universiti Sains Malaysia, Malaysia
Revista Brasileira de Gestão e Negócios
DOI:10.7819/rbgn.v17i54.1777
Young Adults’ Attitude towards Advertising:
A Multi-Group Analysis by Ethnicity
Hiram Ting
Faculty of Economics and Business, Universiti Malaysia Sarawak, Malaysia
Ernest Cyril de Run
Faculty of Economics and Business, Universiti Malaysia Sarawak, Malaysia
Ramayah hurasamy
School of Management, Universiti Sains Malaysia, Malaysia
Editor in charge: João Maurício Gama Boaventura, Dr. Evaluation process: Double Blind Review
ABsTRACT
Objective – his study aims to investigate the attitude of Malaysian young adults towards advertising. How this segment responds to advertising, and how ethnic/cultural diferences moderate are assessed.
Design/methodology/approach – A quantitative questionnaire is used to collect data at two universities. Purposive sampling technique is adopted to ensure the sample represents the actual population. Structural equation modelling (SEM) and multi-group analysis (MGA) are utilized in analysis.
Findings – he indings show that product information, hedonism, and good for economy are signiicant predictors of attitude towards advertising among young adults. Additionally, falsity is found to be signiicant among the Chinese, while social role and materialism among the Dayaks. No diference is observed in the efect of attitude on intention towards advertising by ethnicity. While homogeneity in advertising beliefs is assumed across ethnic groups, the Chinese and Dayak young adults are diferent in some of their advertising beliefs.
Practical implications – Despite cultural efect being well-documented, young adults today seem to have similar beliefs and attitude towards advertising. Knowing what is shared and what is not for this segment is essential. Hence, it is imperative to keep track of their values in diversiied communities to ensure efective communication process in advertising.
1 INTRODuCTION
Advertising by nature is a socio-cultural phenomenon (Wang & Sun, 2010). While it is commonly known to play a key role in economic development, it also helps generate societal activities, and afects the way people live and act (Pollay & Mittal, 1993; Wang, Sun, Lei & Toncar, 2009). Given the burgeoning use of Internet and digital technologies, younger generations are becoming more accustomed to advertising and exposed to more advertisements than those of the same age a decade ago (Purosothuman, 2008; Tai, 2007). As a result, the way they receive and convey messages, and develop communicational relationships have changed drastically over the years (Syrett & Lammiman, 2004). his makes the understanding of young consumers’ view about advertising more intricate. However, at the same time, it becomes more essential than ever.
Cultural impact on views on advertising has been well documented in marketing literature (Durvasula & Lysonski, 2001; La Ferle, Edwards & Lee, 2008). Culture and advertising are asserted to be profoundly connected with each other (Wang & Sun, 2010). Because culture more than often creates diferences (Raval & Subramanian, 2004), views and responses of people from diferent cultural groups towards advertising are expected to be diferent. However, little is known about advertising views by young consumers in emerging and multi-cultural markets. Considering this, the present study adopts a quantitative approach to investigate the current attitude of Malaysian young adults towards advertising. As culture is embedded in ethnicity, this study compares and analyzes how young adults from Malay, Chinese and Dayak communities perceive
advertising. Instead of using multiple regression and analysis of variance (ANOVA), variance-based structural equation modeling (SEM) and multi-group analysis (MGA) are used to assess relations between constructs and the diference of their efects. It is believed that the elucidation of the attitude towards advertising among young adults and the efect of ethnicity and cultural diferences on the topic will extend the knowledge on young consumers and advertising efectiveness.
2 LITERATuRE REvIEw
2.1 heoretical consideration
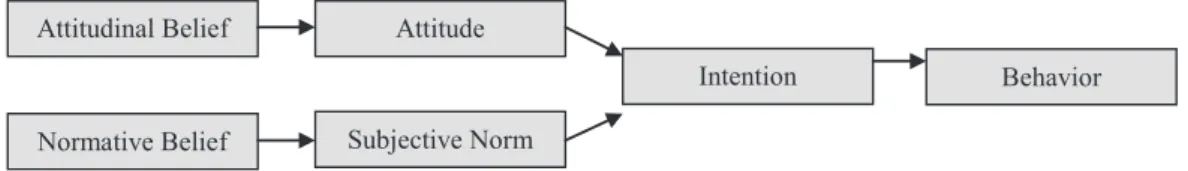
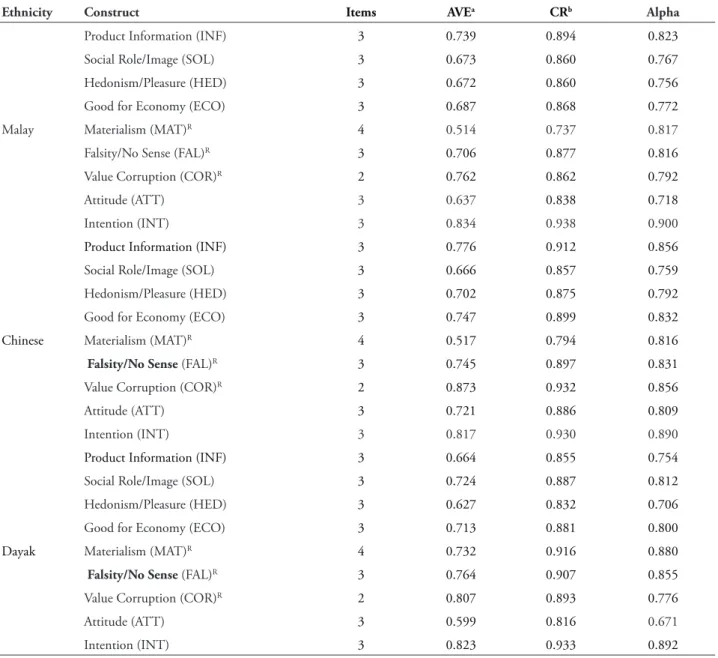
O’Donohoe, 1995
“a learned predisposition to respond in a consistently favorable or unfavorable manner to advertising in general”
Attitudinal Belief
Normative Belief
Attitude
Subjective Norm
Intention Behavior
FIGuRE 1 – heory of Reasoned Action.
source: Ajzen, I. & Fishbein, M. (1980). Understanding attitudes and predicting social behavior. London: Prentice-Hall.
2.2 Attitude towards advertising
For many years, the topic of attitude towards advertising has received substantial attention in marketing literature (Mittal, 1994; O’Donohoe, 1995; Pollay & Mittal, 1993). It is largely known as “a learned predisposition to respond in a consistently favorable or unfavorable manner to advertising in general” (Lutz, 1985, p. 16). Interest in such attitude is generated and intensiied by continual empirical evidence, which underlines the efect of advertising attitude on advertising efectiveness (Kotler, 1988; Mehta, 2000; Mehta & Purvis, 1995), and also attitude towards a speciic brand and advertisement (Lutz, 1985). Moreover, it is also found to have a direct and positive efect on exposure and attention to advertisements (Shavitt, Lowrey & Haefner, 1998), and ultimately purchase intention and behavior (Bush,Smith & Martin, 1999; Ha, John, Janda, & Muthaly, 2011). Hence, it plays an important role in consumer behavior (Wilkie, 1994). Furthermore the understanding of advertising attitudes can result in better social policy initiatives (Calfee & Ringold, 1994; Pollay & Mittal, 1993), thus beneitting the society in general (Pollay & Mittal, 1993; Rotzoll, Haefner & Sandage, 1986).
In order to articulate the formation of attitude towards advertising, past studies have also delved into its antecedents in order to determine its predictors and its causal relations. One of the most recognized variables found in earlier studies is the belief in advertising. It is described as a speciic statement about the attributes of objects
(Brackett & Carr, 2001; Ducofe, 1996; Pollay & Mittal, 1993; Wang et al., 2009). As such, it serves as a precursor to an attitude towards advertising (Korgaonkar et al., 2001). Since belief in advertising inluences the attitude towards advertising, knowing advertising beliefs and their level of efect on attitude would produce more insights into efective advertisements in order to result in favorable responses by the consumers (Korgaonkar et al., 2001).
competitions among companies, and raises the standard of living (Belch & Belch, 2009). In spite of its positive aspects, advertising is also criticized for promoting materialism, falsity and corrupting values, especially among young people. herefore, attitudes toward advertising are determined by both positive or negative beliefs in advertising (Singh & Vij, 2007).
2.3 Ethnicity and culture
Culture has group-wide patterns of human thoughts and relations (Drake, 1994; Lau, Chiu & Lee, 2001; Legohérel, Daucé, Hsu & Ranchhold, 2009). Goodenough (1971) described culture as a set of beliefs or standards, shared by a group of individuals, that have an impact on the behavior of an individual. Similarly, Hall (1976) deined it as “the way of life of people, for the sum of their learned behavioral patterns, attitudes, and material things” (p. 20). Ethnicity, in turn, involves a common cultural heritage, a sense of belonging that is transmitted from one generation to another (Renzetti & Curran, 1998). As ethnicity is a dominant embodiment of culture (Usunier, 2000), it is apparent that the beliefs, attitudes and behaviors are very much dependent upon ethnic groups to which they belong (Legohérel et al., 2009). Due to its prevailing inluence, cultural-value priorities can be seen in the manner of living in each ethnic group (Schwartz, 1999), and they become norms to advocate what is appropriate and what is not in various situations.
Interest in the influence of culture on consumers’ view and behavior has been growing greatly due to the diversification of consumer proiles and changing of technological environment (Douglas & Craig, 1997). Even though management implications of this have been recognized for quite some time, the understanding of its efect on the young and internet-savvy consumers, who begin to enter society as active adults, requires continual assessment (Syrett & Lammiman, 2004). As cultural values are known to have a commanding role in bringing changes in
beliefs, attitudes and behaviors (Hofstede, 2001; Raval & Subramanian, 2004; Rice, 1993; Terpstra & David, 1985), young consumers’ attitudes toward advertising are naturally inluenced by their innate cultural predispositions. his may become a main area of concern for managers or people in marketing entering multi-ethnic and cultural markets such as Malaysia (Shao & Waller, 1993). However, as a medium that channels socio-cultural values itself, advertising can portray or contradict the values that an ethnic group hold important (Wang & Sun, 2010). herefore, it is important to assess the view on advertising in a cross-cultural context through the lens of ethnicity to broaden intrinsically the understanding of attitudes towards advertising.
3 HyPOTHEsEs DEvELOPmENT
the way by which Malaysian young adults from diferent ethnic groups perceive advertising in their surroundings, and the implication of culture on their attitude towards advertising remain largely indefinite. The lack of understanding of younger consumers today will greatly afect marketing strategy and advertising efectiveness.
Hence, it is mandatory to keep up with an updated view on this specific segment of population to understand how it responds to
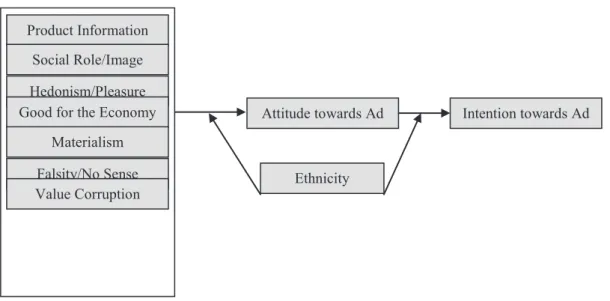
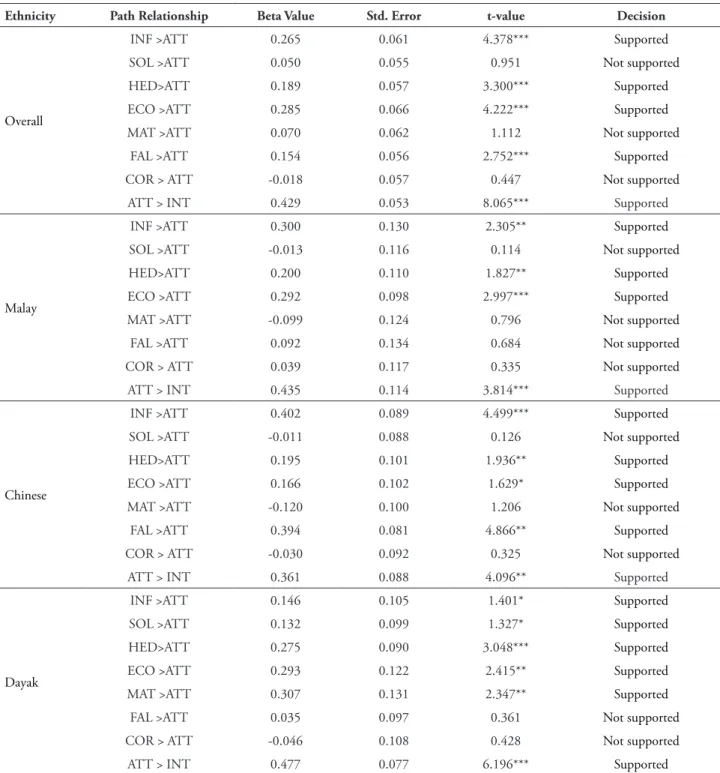
advertising at the outset. Using TRA as a support theory, the attitude towards advertising is modeled as the focal point of this study. Accordingly, the seven belief factors are constructed as antecedents, and intention towards advertising as its outcome (Ajzen & Fishbein, 1980). Finally, ethnicity is constructed as the model’s moderator to test the diference of strengths between attitudinal constructs. he research model of this study is shown in Figure 2.
model’s
Product Information
Social Role/Image
Hedonism/Pleasure Good for the Economy
Materialism
Falsity/No Sense Value Corruption
Attitude towards Ad Intention towards Ad
Ethnicity
Figure 2 – Research model.
source: Self-developed with reference to Pollay, R. W. & Mittal, B. (1993). Here’s the beef: factors, determinants, and segments in consumer criticism of advertising. Journal of Marketing, 57(3), 99-114.
Given the need to understand the contemporary view on advertising among young adults, hypotheses are developed to irst test the efect of beliefs about advertising on attitudes towards advertising, and secondly the effect of attitude towards advertising on intention towards advertising. As past studies have shown a positive relation among these three constructs (Korgaonkar et al., 2001; Pollay & Mittal, 1993), the following hypotheses are formulated:
H1: Beliefs of young adults in advertising will positively afect their attitude towards advertising
H2: Attitude of young adults towards advertising will positively affect their intention towards advertising
Due to the diferences of culture embedded in ethnic groups, it is postulated that the beliefs of the Malay, Chinese and Dayak young adults in advertising will be diferent. Consequently, their attitude and intention towards advertising will also be diferent. herefore, the following hypotheses are formulated:
signiicantly diferent among young adults according to ethnicity.
H4: Efects of attitude towards advertising on intention towards advertising will be signiicantly diferent among young adults according to ethnicity.
4 mETHODOLOGy
4.1 scope of the study
Studies on young-adult consumers have been important in consumer research for many years (Grant & Waite, 2003). Firstly, because they have outgrown adolescence and begun their adulthood, young adults seek to identify and establish their own personalities and behavior (Holbrook & Schindler, 1989). Many of their acts are consolidated to become something permanent throughout their lifetimes (Rogler, 2002). Secondly, young adults can easily inluence people around them with their opinions and decisions (Grant & Waite, 2003), and act as change agents in a group or society (Leslie, Sparling, & Owen, 2001). hirdly, from the marketing point of view, young adults are a specialized market segment that forms a prospective group of people (Feldman, 1999; Moschis, 1987).
One speciic group of the young-adult population in Malaysia is university students (De Run, Butt, & Nee, 2010; Mokhlis, 2009). hey have always represented a meaningful and substantial segment of the general public, and, as such, it requires a continual and close attention (Beard, 2003)Social, Economic, Cohort</ keyword></keywords><dates><year>2003</ year></dates><urls></urls></record></Cite></ EndNote>. Despite being a multi-ethnic country, Malaysia is formed predominantly by Malays (50.4%), followed by Chinese (24.6%). However, in Sarawak itself, Dayaks are the majority (Statistics Handbook Malaysia, 2010) (Department of Statistics, Malaysia, 2010). As Malay, Chinese and Dayak are three diferent ethnic groups, and
they have distinctive cultural identities (De Run, 2007). Hence, university students from these ethnic groups are sampled in the study to assess the inluence of culture on their attitude towards advertising.
4.2 Data collection and analysis
Students from Universiti Malaysia Sarawak (UNIMAS) and Swinburne University of Technology Sarawak (SUTS) were selected as the target population in this study. he former is the most populated public university and the latter is the most populated private university with its own campus in Sarawak. Hence, students in these two universities are from all over Malaysia. hose who come from foreign countries and are young adults were not included in the studied population. Using past studies on young adults as references, ages between 18 and 25 were used as a proxy to sample young adults for this study. Purposive and snowball sampling approaches were used to ensure that the numbers of Malay, Chinese and Dayak students sampled relect the actual population in Malaysia. A self-administered questionnaire was used to collect data. A seven-point Likert scale, where 1 indicates strongly disagree and 7 indicates strongly agree, was adopted for all items pertaining to beliefs, attitude and intention towards advertising. However, they were randomized to diminish issues with common method variance. After performing a pretest with 50 students, minimal changes were made accordingly. A total of 450 copies were then distributed on the two campuses, and 347 usable copies were later collected. Data were added into a statistical package for social sciences (SPSS) software.
SEM parameters, namely the covariance-based approach and the variance or component-based approach (Haenlein & Kaplan, 2004). Partial least squares structural equation modeling (PLS-SEM), which uses a variance-based approach, is increasingly being adopted in various research disciplines, including Marketing, in recent years (Hair, Sarstedt, Ringle & Mena, 2012). It is particularly useful when the research objective emphasizes prediction and maximizes the variance of key target constructs by diferent explanatory constructs instead of producing an empirical and universal covariance matrix. herefore, PLS-SEM can work with a wider sample size and it does not require assumption of data normality (Hair, Ringle & Sarstedt, 2011; Hair et al., 2012; Henseler, Ringle & Sinkovics, 2009; Reinartz,
Haenlein & Henseler, 2009). Given the objectives of the present study, PLS-SEM was considered as the best approach, and the software SmartPLS 2.0 was used to run a path modeling analysis and subsequently a multi-group analysis (MGA) (Ringle, Wende & Will, 2005).
5 REsuLTs
5.1 Respondent proile
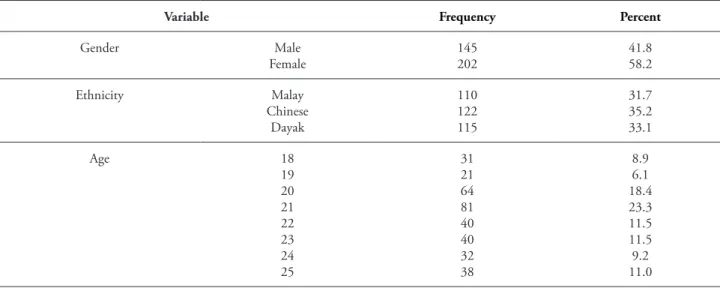
Table 1 shows the demographic details of 347 young adults sampled for this study. he numbers for Malay, Chinese and Dayak are almost the same, and their age ranged from 18 to 25 years.
TABLE 1 – Respondent proile
variable Frequency Percent
Gender Male
Female
145 202
41.8 58.2
Ethnicity Malay
Chinese Dayak
110 122 115
31.7 35.2 33.1
Age 18
19 20 21 22 23 24 25
31 21 64 81 40 40 32 38
8.9 6.1 18.4 23.3 11.5 11.5 9.2 11.0
5.2 measurement model
All constructs in the overall model satisfy the requirements for composite reliability (CR) and Cronbach alpha greater than 0.70 (Gefen et al., 2000; Nunnally, 1978). Acceptable convergent validity and discriminant validity, whereby each loading is greater than 0.50, average
TABLE 2A – Overall convergent validity
Construct Items Loadings AvEa CRb Alpha
Product Information (INF)
INF1 0.818 0.725 0.888 0.809
INF2 0.851
INF3 0.885
Social Role/Image (SOL) SOL1 0.837 0.699 0.874 0.786
SOL2 0.823
SOL3 0.848
Hedonism/Pleasure (HED)
HED1 0.740 0.665 0.856 0.750
HED2 0.846
HED3 0.856
Good for Economy (ECO)
ECO1 0.882 0.716 0.883 0.802
ECO2 0.788
ECO3 0.866
Materialism (MAT)R
MAT1 0.692 0.677 0.893 0.848
MAT2 0.846
MAT3 0.868
MAT4 0.872
Falsity/No Sense (FAL)R
FAL1 0.895 0.751 0.900 0.834
FAL2 0.888
FAL3 0.814
Value Corruption (COR)R COR1 0.935 0.841 0.914 0.808
COR2 0.899
Attitude (ATT)
ATT1 0.829 0.644 0.843 0.728
ATT2 0.708
ATT3 0.861
Intention (INT)
INT1 0.868 0.825 0.934 0.894
INT2 0.933
INT3 0.922
Notes. a Average variance extracted (AVE) = (sum of the square of factor loadings)/{(sum of the square of factor loadings) + (sum of the error variances)}
b Composite reliability (CR) = (square of the sum of factor loadings)/{(square of the sum of factor loadings) + (square of the sum of error variances)}
R indicates a reverse-coding used; therefore, Materialism should read as Not Materialistic, Falsity as Truthfulness and Value Corruption as Not Corrupting to Values
TABLE 2B – Overall discriminant validity
ATT COL ECO FAL HED INT mAT INF sOC
ATT 0.803
COR 0.110 0.917
ECO 0.537 0.086 0.846
FAL 0.224 0.546 0.131 0.867
HED 0.473 -0.023 0.447 0.019 0.812
INT 0.423 -0.087 0.261 0.067 0.366 0.908
MAT 0.082 0.607 -0.030 0.563 -0.086 -0.071 0.823
INF 0.529 -0.021 0.519 0.021 0.508 0.259 -0.104 0.852
SOL 0.381 -0.089 0.371 -0.009 0.527 0.397 -0.128 0.506 0.836
In order to perform MGA according to ethnicity in a later stage, convergent validity and discriminant validity for each ethnic group were also tested to ensure the consistency and rigor of the measuring instrument. Table 3a and 3b
show that the criteria pertaining to AVE and CR are met. Although the Cronbach alpha value for attitude of the Dayak group is below 0.70, the construct is retained due to acceptable AVE and CR values.
TABLE 3A – Convergent validity by ethnicity
Ethnicity Construct Items AvEa CRb Alpha
Malay
Product Information (INF) 3 0.739 0.894 0.823
Social Role/Image (SOL) 3 0.673 0.860 0.767
Hedonism/Pleasure (HED) 3 0.672 0.860 0.756
Good for Economy (ECO) 3 0.687 0.868 0.772
Materialism (MAT)R 4 0.514 0.737 0.817
Falsity/No Sense (FAL)R 3 0.706 0.877 0.816
Value Corruption (COR)R 2 0.762 0.862 0.792
Attitude (ATT) 3 0.637 0.838 0.718
Intention (INT) 3 0.834 0.938 0.900
Chinese
Product Information (INF) 3 0.776 0.912 0.856
Social Role/Image (SOL) 3 0.666 0.857 0.759
Hedonism/Pleasure (HED) 3 0.702 0.875 0.792
Good for Economy (ECO) 3 0.747 0.899 0.832
Materialism (MAT)R 4 0.517 0.794 0.816
Falsity/No sense (FAL)R 3 0.745 0.897 0.831
Value Corruption (COR)R 2 0.873 0.932 0.856
Attitude (ATT) 3 0.721 0.886 0.809
Intention (INT) 3 0.817 0.930 0.890
Dayak
Product Information (INF) 3 0.664 0.855 0.754
Social Role/Image (SOL) 3 0.724 0.887 0.812
Hedonism/Pleasure (HED) 3 0.627 0.832 0.706
Good for Economy (ECO) 3 0.713 0.881 0.800
Materialism (MAT)R 4 0.732 0.916 0.880
Falsity/No sense (FAL)R 3 0.764 0.907 0.855
Value Corruption (COR)R 2 0.807 0.893 0.776
Attitude (ATT) 3 0.599 0.816 0.671
Intention (INT) 3 0.823 0.933 0.892
Notes.a Average variance extracted (AVE) = (sum of the square of factor loadings)/{(sum of the square of factor loadings) + (sum of error variances)}
b Composite reliability (CR) = (square of the sum of factor loadings)/{(square of the sum of factor loadings) + (square of the sum of error variances)}
TABLE 3B – Discriminant validity by ethnicity
Ethnicity ATT COL ECO FAL HED INT mAT INF sOC
Malay
ATT 0.798
COR 0.055 0.873
ECO 0.549 0.071 0.829
FAL 0.151 0.611 0.139 0.840
HED 0.458 -0.049 0.387 0.095 0.820
INT 0.570 -0.014 0.538 0.081 0.484 0.913
MAT 0.435 -0.169 0.291 -0.034 0.424 0.321 0.717
INF -0.108 0.490 -0.077 0.494 0.000 -0.175 -0.067 0.860
SOL 0.411 -0.100 0.386 -0.032 0.578 0.622 0.466 -0.163 0.820
Chinese
ATT 0.849
COR 0.174 0.934
ECO 0.515 0.136 0.864
FAL 0.360 0.514 0.187 0.863
HED 0.488 0.159 0.487 0.049 0.838
INT 0.580 0.025 0.470 0.001 0.548 0.904
MAT 0.361 0.032 0.179 0.187 0.322 0.160 0.719
INF 0.089 0.518 -0.003 0.490 0.140 0.011 -0.064 0.881
SOL 0.314 0.010 0.329 0.011 0.459 0.423 0.254 -0.066 0.816
Dayak
ATT 0.774
COR 0.123 0.898
ECO 0.552 0.063 0.844
FAL 0.224 0.504 0.138 0.874
HED 0.497 -0.162 0.476 0.013 0.792
INT 0.457 -0.092 0.547 0.062 0.496 0.907
MAT 0.477 -0.150 0.320 0.077 0.362 0.293 0.856
INF 0.166 0.705 -0.028 0.500 -0.233 -0.191 -0.112 0.815
SOL 0.429 -0.187 0.411 0.045 0.555 0.497 0.442 -0.192 0.851
Note. Diagonals represent the square root of the AVE while the of-diagonals represent the correlations
5.2 structural model
Bootstrapping was used to determine whether path relationships for overall and ethnicity-based models are signiicant or not.
TABLE 4 – Path coeicients
Ethnicity Path Relationship Beta value std. Error t-value Decision
Overall
INF >ATT 0.265 0.061 4.378*** Supported
SOL >ATT 0.050 0.055 0.951 Not supported
HED>ATT 0.189 0.057 3.300*** Supported
ECO >ATT 0.285 0.066 4.222*** Supported
MAT >ATT 0.070 0.062 1.112 Not supported
FAL >ATT 0.154 0.056 2.752*** Supported
COR > ATT -0.018 0.057 0.447 Not supported
ATT > INT 0.429 0.053 8.065*** Supported
Malay
INF >ATT 0.300 0.130 2.305** Supported
SOL >ATT -0.013 0.116 0.114 Not supported
HED>ATT 0.200 0.110 1.827** Supported
ECO >ATT 0.292 0.098 2.997*** Supported
MAT >ATT -0.099 0.124 0.796 Not supported
FAL >ATT 0.092 0.134 0.684 Not supported
COR > ATT 0.039 0.117 0.335 Not supported
ATT > INT 0.435 0.114 3.814*** Supported
Chinese
INF >ATT 0.402 0.089 4.499*** Supported
SOL >ATT -0.011 0.088 0.126 Not supported
HED>ATT 0.195 0.101 1.936** Supported
ECO >ATT 0.166 0.102 1.629* Supported
MAT >ATT -0.120 0.100 1.206 Not supported
FAL >ATT 0.394 0.081 4.866** Supported
COR > ATT -0.030 0.092 0.325 Not supported
ATT > INT 0.361 0.088 4.096** Supported
Dayak
INF >ATT 0.146 0.105 1.401* Supported
SOL >ATT 0.132 0.099 1.327* Supported
HED>ATT 0.275 0.090 3.048*** Supported
ECO >ATT 0.293 0.122 2.415** Supported
MAT >ATT 0.307 0.131 2.347** Supported
FAL >ATT 0.035 0.097 0.361 Not supported
COR > ATT -0.046 0.108 0.428 Not supported
ATT > INT 0.477 0.077 6.196*** Supported
Note. * p < 0.1, ** p < 0.05, *** p < 0.01
Given the parameters of PLS-SEM, a blindfolding procedure was performed to assess the predictive capability of the model (Chin, 1998). Cross-validated redundancy (Q2) estimates
latent construct; therefore, it is the sole interest in this study. he Q2 result higher than 0 indicates
that there is a predictive relevance in overall and ethnicity-based models (Fornell & Cha, 1994). R squared (R2) values for attitude and intention are
TABLE 5 – R2 and Cross-validated Redundancy
Ethnicity Constructs R2 Cv-Comm (H2) Cv-Red (Q2)
Overall ATT 0.437 0.298 0.262
INT 0.179 0.822 0.145
Malay ATT 0.444 0.302 0.209
INT 0.189 0.800 0.145
Chinese ATT 0.536 0.422 0.351
INT 0.130 0.784 0.095
Dayak ATT 0.476 0.234 0.241
INT 0.228 0.791 0.187
To rigorously compare the results across three ethnic groups, t-statistics were calculated to evaluate the diferences in path coeicients across models. A procedure described by Chin, Marcolin
and Newsted (2003), as shown in Figure 3, was used to perform MGA. As there are three ethnic groups, three separate comparisons were tested in the analysis.
FIGuRE 3 – Formula for Multi-group analysis
Table 6a shows the comparison between Malay and Chinese young adults and t-value results. Only the effect of falsity on attitude
towards advertising is found to be signiicantly diferent.
TABLE 6A – Multi-group Comparison between Malay and Chinese young adults
Relationship malay Chinese t-value
Beta std. Error Beta std. Error
INF > ATT 0.304 0.134 0.402 0.089 0.632
SOL > ATT -0.013 0.116 -0.011 0.088 0.014
HED > ATT 0.202 0.104 0.195 0.100 0.052
ECO > ATT 0.292 0.107 0.166 0.101 0.860
MAT > ATT -0.099 0.124 -0.120 0.100 0.134
FAL > ATT 0.073 0.134 0.394 0.078 2.175**
COR > ATT 0.039 0.117 -0.030 0.092 0.472
ATT > INT 0.435 0.111 0.361 0.080 0.556
Note. * p < 0.1, ** p < 0.05, *** p < 0.01
Table 6b shows the comparison between Malay and Dayak young adults and t-value results.
TABLE 6B – Multi-group comparison between Malay and Dayak young adults
Relationship malay Dayak t-value
Beta std. Error Beta std. Error
INF > ATT 0.304 0.134 0.146 0.105 0.946
SOL > ATT -0.013 0.116 0.132 0.099 0.959
HED > ATT 0.202 0.104 0.275 0.093 0.524
ECO > ATT 0.292 0.107 0.293 0.121 0.006
MAT > ATT -0.099 0.124 0.307 0.131 2.208***
FAL > ATT 0.073 0.134 0.035 0.089 0.246
COR > ATT 0.039 0.117 -0.046 0.108 0.533
ATT > INT 0.435 0.111 0.477 0.078 0.320
Note. * p < 0.1, ** p < 0.05, *** p < 0.01
Table 6c shows the comparison between Chinese and Dayak young adults and t-value results. Contrary to the previous comparisons, the efects of product information, materialism and falsity are found to be signiicantly diferent.
TABLE 6C – Multi-group comparison between Chinese and Dayak young adults
Relationship Chinese Dayak t-value
Beta std. Error Beta std. Error
INF > ATT 0.402 0.089 0.146 0.105 1.860**
SOL > ATT -0.011 0.088 0.132 0.099 1.081
HED > ATT 0.195 0.100 0.275 0.093 0.589
ECO > ATT 0.166 0.101 0.293 0.121 0.806
MAT > ATT -0.120 0.100 0.307 0.131 2.587***
FAL > ATT 0.394 0.078 0.035 0.089 3.037***
COR > ATT -0.030 0.092 -0.046 0.108 0.113
ATT > INT 0.361 0.080 0.477 0.078 1.043
Note. * p < 0.1, ** p < 0.05, *** p < 0.01
6 DIsCussION
6.1 Relations between beliefs, attitude and intention
he initial indings have shown a link between beliefs, attitude and intention towards advertising among young adults in a holistic manner. Intention towards advertising is found to be signiicantly predicted by attitude towards advertising, and such attitude is also signiicantly predicted by beliefs in advertising. However, not all beliefs in advertising are found to have a signiicant efect on attitude. From seven belief
amusing elements more appealing. Furthermore, they also tend to relate advertising to economic welfare. For that reason, the irst and the second hypotheses of the study are supported.
When the overall model is divided into three models based on ethnicity, the indings are generally the same, but they provide more details. Product information, hedonism and good for economy are shown to be consistent predictors of attitude towards advertising across ethnic groups. Nevertheless, falsity is only appears in Chinese young adults as an added determinant of attitude towards advertising. In a similar way, the beliefs of social role and materialism are found to have a speciic efect on the attitude of Dayak young adults. It is therefore evident that, despite being largely similar in their beliefs in advertising, Chinese and Dayak young adults’ attitude towards advertising can be predicted by additional belief factors. Hence, it is necessary to look at the indings of the latter stage.
6.2 multi-group comparison according to
ethnicity
he indings of MGA show that Malay and Chinese young adults are largely equal in terms of beliefs in advertising. he only diference between them is seen in the Chinese’s concern on the truthfulness of advertising. Similarly, the views of Malay and Dayak young adults on advertising are also mostly the same, except for materialism, which seems to have a greater impact on Dayak’s young adults’ attitude towards advertising. hree out of seven belief factors, namely product information, materialism and falsity, are found to be signiicantly diferent between Chinese and Dayak young adults. Moreover, there is no signiicant diference in the efect of attitude on intention towards advertising according to ethnicity. Considering this, it is concluded that the third and fourth hypotheses are not supported in this study.
Regardless of the profound inluence of ethnicity and culture on people’s belief system and pattern of living, the indings imply that
all young adults have common beliefs about advertising. As such, their attitude and intentions towards advertising are similar. his contradicts postulations made by an earlier study, which states that young adults’ attitude towards advertising may be diferent due to socio-cultural diferences in Malaysia (Rashid & Sidin, 1987). his study supports the results of a recent study, which posits that their belief factors are consistent across ethnic groups (Munusamy & Wong, 2007). Over the years, the drastic changes in demographics and technological environment have caused people to begin to share their resources and adopt diferent things in a gradual process (Al-Rodhan, 2006). his results in more interdependence, bringing people, cultures, beliefs and practices to a greater proximity (Sorrells, 2012). Secondly, the indings suggest that the Malays, being the most populated ethnic group in Malaysia, are most likely to be dominant in exerting their culture in a multi-ethnic and cultural country (Brumbaugh, 2002; De Run, 2007). As a result, the non-dominant groups, Chinese and Dayaks, will resort to socialize in their cultures and that of the majority. his clariies the little diference found between the beliefs of Malay young adults and others in advertising compared to the diference between Chinese and Dayak young adults.
6.3 managerial implication
and apprehend what sets ethnic groups apart and what integrates them before approaching them to ensure a favorable response.
his study highlights the importance of understanding and keeping close track of Malay, Chinese and Dayak young adults’ views on advertising. his will improve communication in advertising activities by conveying the right message to the right people in a community, despite cultural diversity. Since advertising will continue to be one of the main choices of the Integrated Marketing Communication (IMC) employed by organizations to demonstrate their superiority over their competitors, knowing more about young adults’ attitudes towards advertising and the implication of ethnicity and culture will surely give them an edge over others (Munusamy & Wong, 2007). Such knowledge will also help to predict their attitude towards speciic advertisement, thus reinforcing the organization’s competitive advantage. Meticulously strategizing marketing activities by carefully treading between the lines of what makes ethnic groups diferent and what is shared and assimilated by them may prove pivotal to advertising success.
7 CONCLusION
he study has utilized TRA to provide a theoretical explanation to attitude towards advertising. Particularly, the use of PLS-SEM has elucidated the views of young adults from three ethnic groups in Malaysia considering a structural model to understand the implication of culture on the topic. While TRA is validated in the context of young adults’ attitude towards advertising, beliefs, attitude and intention towards advertising demonstrated by Malay, Chinese and Dayak young adults are found to be similar. Despite the impact of ethnicity and culture, there is generally no signiicant diference in the efect of beliefs in advertising on attitude towards advertising, and subsequently intention towards advertising.
his study, however, is limited in two aspects. First, it only considers attitude towards
advertising in general. As such, it may have restricted the diversity of views according to diferent cultural backgrounds. Secondly, the collection of data only from university students in Sarawak may have restricted the indings, not being able to be applied to all young adults in Malaysia. herefore, a more comprehensive and nationwide study is needed to assess the views of young adults on advertising in general and also speciic advertising in order to articulate the implication of cultural diferences on this matter. Comparative studies among adolescents, young and full adults can also be conducted to determine the efects of generational gaps across diferent cohorts.
REFERENCEs
Ajzen, I. & Fishbein, M. (1980). Understanding attitudes and predicting social behavior. London: Prentice-Hall.
Al-Rodhan, N. R. F. (2006). Definitions of globalization: a comprehensive overview and a proposed deinition (GCSP Occasional Papers), Geneva, Geneva Centre for Security Policy – GCSP, Program on the Geopolitical Implications of Globalization and Transnational Security. Retrieved from http://www.sustainablehistory. com/articles/deinitions-of-globalization.pdf
Bagozzi, R. P. & Yi, Y. (1988). On the evaluation of structural equation model. Journal of Academy of Marketing Science, 16(1), 74-94. doi: 10.1007/ BF02723327
Beard, F. K. (2003). College student attitudes toward advertising’s ethical, economic, and social consequences. Journal of Business Ethics, 48(3), 217-228.
Belch, G. E. & Belch, M. A. (2009). Advertising and promotion: an integrated marketing communications perspective (8th ed.). New York: McGraw Hill.
student attitudes. Journal of Advertising Research, 41(5), 23-32.
Brumbaugh, A. M. (2002). Source and nonsource cues in advertising and their effects on the activation of cultural and subcultural knowledge on the route to persuasion. Journal of Consumer Research, 29(2), 258-269.
Bush, A. J., Smith, R.,& Martin, C. (1999). he influence of consumer socialization variables on attitude toward advertising: a comparison of african-americans and caucasians. Journal of Advertising, 28(3), 13-24.
Calfee, J. E.,& Ringold, J. D. (1994). he 70% majority: enduring consumer beliefs about advertising. Journal of Public Policy and Marketing, 13(2), 228-238.
Chin, W. W. (1998). he partial least squares approach to structural equation modeling. In G. Marcoulides (Ed.), Modern methods for business research(pp. 295-358). Associates, Mahwah, NJ: Lawrence Erlbaum.
Chin, W. W., Marcolin, B. L.,& Newsted, P. R. (2003). A partial least squares latent variable modelling approach for measuring interaction efects: results from a monte carlo simulation study and an electronic-mail emotion/adoption study. Information Systems Research, 14(2), 189-217.
Choo, H., Chung, J.-E.,& Pysarchik, D. T. (2004). Antecedents to new food product purchasing behavior among innovator groups in India. European Journal of Marketing, 38(5/6), 608-625.
Cohen, J. (1988). Statistical power analysis for the behavioral sciences(2nd ed.). Hillsdale, N. J.:Lawrence Erlbaum Associates.
De Run, E. C. (2007). Constructing ethnic identiication variables of malay, chinese and iban. he ICFAI Journal of Marketing and Management, 6(3), 38-52.
De Run, E. C., Butt, M.,& Nee, C. Y. (2010). he inluence of role models on young adults purchase. Jurnal Kemanusiaan, 15, 70-81.
De Run, E. C., & Ting, H. (2013, June). Attitude of marketing and non-marketing students towards advertising. Proceedings of the Global Conference on Business, Economics and Social Sciences, Kuala Lumpur, Malaysia.
Douglas, S. P.,& Craig, C. S. (1997). he changing dynamic of consumer behavior: implications for cross-cultural research. International Journal of Research in Marketing, 14(4), 379-395.
Drake, L. E. (1994). Cultural determinacy in negotiation. East Lansing, MI: Michigan State University.
Ducoffe, R. (1996). Advertising value and advertising on the web. Journal of Advertising Research, 36(5), 21-35.
Durvasula, S.,& Lysonski, S. (2001). Are there global dimensions of beliefs toward advertising in general: a multicultural investigation. In C. P. Rao (Ed.), Globalization and its managerial implications (pp. 184-202). Westport, CT: Quorum Books.
Eze, U. C.,& Lee, C. H. (2012). Consumers’ attitude towards advertising. International Journal of Business and Management, 7(13), 94-108.
Farley, J. U., Lehmann, D. R.,& Ryan, M. J. (1981). Generalizing from ‘imperfect replication’. Journal of Business, 54(4), 597-610.
Feldman, J. (1999). Back-to-school buying guide. Money, 28(9), 165-168.
Fornell, C.,& Cha, J. (1994). Partial least squares. In R. P. Bagozzi (Ed.), Advanced methods of marketing research (pp. 52-78). Cambridge, England: Blackwell.
Communications of the Association for Information Systems, 7(7), 1-78.
Goodenough, W. H. (1971). Culture, language and society. Reading, MA: Addison-Wesley.
Grant, I. C.,& Waite, K. (2003). Following the yellow brick road: young adults’ experiences of the information super-highway.Qualitative Market Research: An International Journal, 6(1), 48-57.
Ha, H.-Y., John, J., Janda, S.,& Muthaly, S. (2011). he efects of advertising spending on brand loyalty in services. European Journal of Marketing, 45(4), 673-691.
Haenlein, M.,& Kaplan, A. M. (2004). A beginner’s guide to partial least squares analysis. Understanding Statistics, 3(4), 283-297.
Hair, J. F., Ringle, C. M.,& Sarstedt, M. (2011). PLS-SEM: indeed a silver bullet. Journal of Marketing heory and Practice, 19(2), 139-151.
Hair, J. F., Sarstedt, M., Ringle, C. M.,& Mena, J. A. (2012). An assessment of the use of partial least squares structural equation modeling in marketing research. Journal of the Academy of Marketing Science, 40(3), 414-433.
Hall, E. (1976). Beyond culture. Garden City, NY: Doubleday Anchor Books.
Henseler, J., Ringle, C. M.,& Sinkovics, R. R. (2009). The use of partial least squares path modeling in international marketing. In R. R. Sinkovics,&P. N. Ghauri (Eds.), Advances in international marketing (pp. 277-320). Bingley: Emerald.
Hofstede, G. (2001). Culture’s consequences: comparing values, behaviors, institutions, and organizations across nations. housand Oaks: Sage.
Holbrook, M. B.,& Schindler, R. M. (1989). Some exploratory indings on the development of musical tastes. Journal of Consumer Research, 16(1), 119-124.
Korgaonkar, P. K., Karson, E. J.,& Lund, D. (2000). Hispanics and direct marketing advertising. Journal of Consumer Marketing, 17(2), 137-157.
Korgaonkar, P. K., Silverblatt, R.,& O’Leary, B. (2001). Web advertising and hispanics. Journal of Consumer Marketing, 18(2), 134-152.
Kotler, P. (1988). Marketing management: analysis, planning, and control. New Jersey: Prentice Hall.
Kwek, C. L., Tan, H. P.,& Lau, T. C. (2010). he determinants of consumers’ attitude towards advertising. Canadian Social Science, 6(4), 114-126.
La Ferle, C., Edwards, S.,& Lee, W. (2008). Culture, attitudes, and media patterns in China, Taiwan, and the U.S. balancing standardization and localization decisions. Journal of Global Marketing, 21(3), 191-205.
L a u , I . , C h i u , C . , & L e e , S . ( 2 0 0 1 ) . Communication and shared reality: implications for the psychological foundations of culture. Social Cognition, 19(3), 350-371.
Legohérel, P., Daucé, B., Hsu, C. H. C.,& Ranchhold, A. (2009). Culture, time orientation, and exploratory buying behavior. Journal of International Consumer Marketing, 21(2), 93-107.
Leslie, E., Sparling, P. B.,& Owen, N. (2001). University campus settings and the promotion of physical activity in young adults: lessons from research in Australia and the USA. Health and Education, 101(3), 116-125.
Lutz, R. J. (1985). Affective and cognitive antecedents of attitude towards ad: a conceptual framework. In L. F. Alwitt,& A. A. Mitchell (Eds.), Psychological processes and advertising efects(pp. 45-63). Hillsdale, NJ: Lawrence Erlbaum.
Mehta, A., & Purvis, S. C. (1995). When attitudes towards advertising in general inluence advertising success. Proceedings of the Conference of the American Academy of Advertising, Norfolk,
Virginia.
Mittal, B. (1994). Public Assessment of TV advertising: faint praise and harsh criticism. Journal of Advertising Research, 34(1), 35-53.
Mokhlis, S. (2009). An Investigation of consumer decision-making styles of young-adults in Malaysia. International Journal of Business and Management, 4(4), 140-148.
Moschis, G. P. (1987). Consumer socialization: a life cycle perspective. Lexington, MA: Lexington Books.
Munusamy, J.,& Wong, C. H. (2007). Attitude towards advertising among students at private higher learning institutions in selangor. Unitar E-journal, 3(1), 31-51.
Netemeyer, R. G.,& Bearden, W. O. (1992). A comparative analysis of two models of behavioral intention. Journal of the Academy of Marketing Science, 20(1), 49-59.
Nunnally, J. C. (1978). Psychometric theory (2nd ed.). New York: McGraw-Hill.
O’Donohoe, S. (1995). Attitudes to advertising: a review of british and american research. International Journal of Advertising, 14(3), 245-261.
Oliver, R. L.,& Bearden, W. O. (1985). Crossover effects in the theory of reasoned action: a moderating inluence attempt. Journal of Consumer Research, 12(3), 324-340.
Pollay, R. W.,& Mittal, B. (1993). Here’s the beef: factors, determinants, and segments in consumer criticism of advertising. Journal of Marketing, 57(3), 99-114.
Purosothuman, N. P. (2008). Key determinants of virtual store acceptance among the malaysians
consumers(Master dissertation).Faculty Business and Accountancy, University of Malaya, Kuala Lumpur, Wilayah Persekutuan Kuala Lumpur, Malásia.
Ramaprasad, J. (1994). Personalized interactions and generalized beliefs about advertising: the case of Malaysian students. Proceedings of the Conference of the American Academy of Advertising, Athens, Georgia.
Ramaprasad, J., & hurwanger, M. L. (1998). South Asian students attitudes toward and beliefs about advertising: measuring across cultures. Proceedings of the AEJMC Annual Conference, Baltimore,Maryland.
Rashid, M. Z. A., & Sidin, S. M. (1987). The structure of students’ attitudes towards advertising. Proceedings of the Southeast Asia Conference of the Academy of International Business, Kuala Lumpur, Malásia.
Raval, D.,& Subramanian, B. (2004). Cultural values driven segmentation in social marketing. Journal of Nonproit and Public Sector Marketing, 12(2), 73-85.
Reinartz, W. J., Haenlein, M.,& Henseler, J. (2009). An empirical comparison of the eicacy of covariance-based and variance-based SEM. International Market Research, 26(4), 332-344.
Renzetti, C. M.,& Curran, D. J. (1998). Living sociology. Boston: Allyn and Bacon.
Rice, C. (1993). Consumer behavior: behavioral aspects of marketing. Oxford, UK: Butterworth Heinemann.
Ringle, C. M., Wende, S.,& Will, A. (2005). SmartPLS 2.0 M3. Retrieved from http://www. smartpls.de
Rotzoll, K. B., Haefner, J. E.,& Sandage, C. H. (1986). Advertising in contemporary society. West Chicago, IL: South-Western Publishing Company.
Sam, D. L.,& Berry, J. W. (2010). Acculturation : when individuals and groups of diferent cultural backgrounds meet. Perspectives on Psychological Science, 5(4), 472-481.
Schwartz, S. H. (1999). A theory of cultural values and some implications for work. Applied Psychology: An International Review, 48(1), 23-47.
Shao, A. T.,& Waller, D. S. (1993). Advertising standardisation in the Asia paciic region: what stands in the way?Asia Paciic Journal of Marketing and Logistics, 5(3), 43-55.
Shavitt, S., Lowrey, P.,& Haefner, J. (1998). Public attitudes toward advertising: more favorable than you might think. Journal of Advertising Research, 38(4), 7-22.
Singh, R., & Vij, S. (2007). Socio-economic and ethical implications of advertising: a perceptual study. Proceedings of the Annual International Marketing Conference on Marketing & Society, IIMK, Kozhikode, Kerala, India.
Sorrells, K. (2012). Intercultural communication globalization and social justice. housand Oaks: Sage Pubs.
Department of Statistics, Malaysia. (2010). Total population by ethnic group, sub-district and state, Malaysia, 2010. he Source of Malaysia’s Oicial Statistics. Retrieved from http://www. statistics.gov.my/portal/download_Population/ files/population/05Jadual_Mukim_negeri/ Mukim_Sarawak.pdf
Syrett, M.,& Lammiman, J. (2004). Advertising and millennials. Young Consumers, 5(4), 62-73.
Tai, S. H. C. (2007). Correlates of successful brand advertising in China. Asia Paciic Journal of Marketing and Logistics, 19(1), 40-56.
Tan, S. J.,& Chia, L. (2007). Are we measuring the same attitude? Understanding media efects on attitude towards advertising. Marketing heory, 7(4), 353-377. doi: 10.1177/1470593107083162
Terpstra, V.,& David, K. (1985). he cultural environment of international business. Cincinnati, OH: South-Western.
Ting, H., & De Run, E. C. (2012, September). Identifying generational cohorts in Sarawak: a comparison between three ethnic groups. Proceedings of the International Conference Series, Taylor’s University Lakeside Campus, Subang Jaya.
Ting, H., De Run, E. C., & Fam, K.-S. (2012, December). Identifying generational cohorts in Sarawak.Proceedings of the International Borneo Business Conference IBBC, Tawau, Sabah, Malaysia, 5.
Usunier, J. C. (2000). Marketing across cultures (3rd ed.). Harlow, England: Pearson Education.
Waller, D. S.,& Fam, K.-S. (2000). Cultural values and advertising in Malaysia: views from the industry. Asia Paciic Journal of Marketing and Logistics, 12(1), 3-16.
Wang, Y.,& Sun, S. (2010). Assessing beliefs, attitudes, and behavioral responses toward online advertising in three countries. International Business Review, 19(4), 333-344.
Wang, Y., Sun, S., Lei, W.,& Toncar, M. (2009). Examining beliefs and attitudes toward online advertising among chinese consumers. Direct Marketing: An International Journal, 3(1), 52-66.