ABSTRACT:Introduction: In epidemiological studies, misclassification error, especially differential
misclassiication, has serious implications. Objective: To illustrate how diferential misclassiication error (DME)
and non-diferential misclassiication error (NDME) occur in a case-control design and to describe the trends
in DME and NDME. Methods: Diferent sensitivity levels, speciicity levels, prevalence rates and odds ratios
were simulated. Interaction graphics were constructed to study bias in the diferent settings, and the efect of
the diferent factors on bias was described using linear models. Results: One hundred per cent of the biases
caused by NDME were negative. DME biased the association positively more often than it did negatively (70 versus 30%), increasing or decreasing the OR estimate towards the null hypothesis. Conclusions:The efect of the sensitivity and speciicity in classifying exposure, the prevalence of exposure in controls and true OR difered between positive and negative biases. The use of valid exposure classiication instruments with high sensitivity and high speciicity is recommended to mitigate this type of bias.
Keywords: Classiication. Bias. Case-control studies. Odds ratios. Sensitivity and speciicity. Computer Simulation.
The efect of misclassiication error on risk
estimation in case-control studies
Efeito da má classiicação na estimativa de risco em estudo caso-controle
Armando BaenaI,II, Isabel Cristina Garcés-PalacioIII, Hugo GrisalesIV
IInfection and Cancer Group, School of Medicine, Universidad de Antioquia – Medellín, Colombia. IINational School of Public Health, Universidad de Antioquia – Medellín, Colombia.
IIIEpidemiology Group, National School of Public Health, Universidad de Antioquia –Medellín, Colombia.
IVDemography and Health Group, National School of Public Health, Universidad de Antioquia – Medellín, Colombia.
Corresponding author: Armando Baena. Universidad de Antioquia, Calle 70 No. 52-21, Medellín, Colombia. E-mail: [email protected] Conlict of interests: nothing to declare – Financial support: Estrategia de Sostenibilidad 2013-2014, Universidad de Antioquia .
INTRODUCTION
Case-control studies are commonly utilized, especially for studying rare diseases1-3. Both
case identiication and control selection should be carried out with the greatest possible rigor. Lack of rigor could lead to systematic errors and consequently to invalid results3.
Similarly, if the exposure, the disease or both are misclassiied, the association measures, the odds ratio (OR) and the conclusions will be biased1. In any epidemiological study, the
inappropriate classiication of the exposure or of the disease is known as misclassiication error, which can be divided into two types: non-diferential misclassiication error (NDME) or diferential misclassiication error (DME). This type of error is usually found in studies that investigate socially unacceptable behaviour or behaviours considered private that can generate shame or stigma4, such as sexual behaviour or the use of psychoactive substances5.
It is known that NDME biases the risk estimate (typically represented by an odds ratio in case-control studies) towards the null hypothesis2,6-11. The behavioural trends of NDME have
been extensively described, but DME trends are not yet clear12. Consider a 2 x 2 contingency
table in any type of epidemiological study that represents the results observed among non-diseased and diseased individuals as a function of the exposure variable, where a and
b represent, respectively, the number of diseased and non-diseased exposed individuals and c and d represent the number of diseased and non-diseased unexposed individuals, respectively. Exposure misclassiication error occurs when the diseased group and the non-diseased group are considered to be exposed although they were not and unexposed RESUMO:Introdução: Em estudos epidemiológicos, o erro de classiicação, especialmente o diferencial tem sérias
implicações. Objetivo: Explicar como se expressa o erro de classiicação diferencial (ECD) e não diferencial (ECND)
em um estudo de caso-controle e descrever padrões de comportamento. Métodos: Simularam-se diferentes níveis
de sensibilidade, especiicidade, prevalência e odds ratio (OR). Construíram-se gráicos de interação para estudar o comportamento do viés nos diferentes cenários e mediante modelos lineares se descreveu o efeito dos diferentes
fatores sobre esse viés. Resultados: O 100% dos vieses apresentados ante um ECND foram negativos, enquanto que
no caso do ECD observou-se que este enviesa a associação positivamente em maior proporção que negativamente
(30 versus 70%), aproximando ou afastando a estimação da OR para a hipótese nula. Conclusões: O efeito da
sensibilidade e a especiicidade na classiicação da exposição, da prevalência da exposição nos controles e da OR verdadeira sobre o viés relativo difere entre os vieses negativos e positivos. O uso de instrumentos de classiicação da exposição validados, com altos níveis de sensibilidade e especiicidade, se recomendam para mitigar esse tipo de viés.
although they were6, 12. A similar situation would occur if error arose in the classiication
of the disease. Equations 1 to 4 show how misclassiication error afects the frequencies in the 2 x 2 table. These equations have been derived by us using equation 9 from the Vogel and Gefeller paper13.
a’=aSeD+c(1-SpD) Eq. (1)
b’=aSeN+c(1-SpN) Eq. (2)
c’=(1-SeD)+cSpD Eq. (3)
d’=b(1-SeN)+dSpN Eq. (4)
In these equations, a and a’ indicate, respectively, the true and observed numbers of diseased persons exposed, b and b’ the true and observed numbers of non-diseased exposed,
c and c’ the true and observed numbers of diseased unexposed, and d and d’ the true and observed numbers of non-diseased unexposed. SeD and SeN represent the sensitivity of classifying those truly exposed among the diseased (SeD ) and non-diseased (SeN), and SpD
and SpN are the speciicities for classifying those truly unexposed among the diseased (SpD) and non-diseased (SpN). The reasoning behind these equations is that the group of diseased individuals will include a percentage of truly exposed subjects (a) who will be classiied as such by a certain instrument (laboratory test, survey, etc.). This percentage corresponds to the sensitivity of the instrument for classifying subjects as exposed (SeD). In addition, some of the individuals who were truly not exposed (c) will be classiied by the instrument as exposed. This percentage represents the instrument’s false positive rate (1 – SpD). Therefore, among diseased individuals, the number of subjects classiied by the instrument as exposed (1– SpD) will be equal to the fraction of individuals correctly classiied, aSeD, in addition to the fraction of individuals incorrectly classiied, c(1 – SpD). Similarly, the number of diseased subjects classiied by the instrument as unexposed (c’) is equal to the fraction of individuals correctly classiied as such, cSpD, plus the fraction of individuals incorrectly classiied, a(1 – SeD). Likewise, the number of subjects classiied as exposed and unexposed by an instrument in a non-diseased population (b’ and d’) is determined by the sensitivity and speciicity of the instrument in that population (SeN and SpD). The subjects classiied as exposed (b’) will correspond to the fraction of individuals correctly classiied, bSeN, plus the fraction of individuals incorrectly classiied d(1 – SpN). Similarly, the subjects classiied as unexposed (d’) will equal the fraction of individuals correctly classiied, dSpN, added to the fraction of individuals incorrectly classiied, b(1 – SeN).
Non-diferential misclassiication error occurs when SeD = SeN and SpD = SpN, otherwise, the bias is considered a diferential misclassiication error12. The true odds ratio is OR= ad/cb,
observed (OR = OR’), and if they are equal to 50%, the observed odds ratio will be equal to (OR’ = 1). A similar situation would occur with other risk measures employed in diferent epidemiological designs. Using equations 5 to 8, it is possible to use the true table frequencies to replace the corresponding sensitivities and speciicities for the following formulas derived (also by the authors) from the equations described above:
c’=(1-SpD)+a’SpD
(1-SeD)(1+SpD)-SeDSpD
a= Eq. (5)
d’=(1-SpN)+b’SpN
(1-SeN)(1-SpN)-SeNSpN
b= Eq. (6)
a’=(1-SeD)(1-SpD)-c’(1-SpD)SeD
(1-SeD)(1-SpD)2-Se
DSpD(1-SpD)
c= Eq. (7)
b’=(1-SeN)(1-SpN)-d’(1-SpN)SeN
(1-SeN)(1-SpN)2-Se
NSpN(1-SpN)
d= Eq. (8)
If the sensitivities and speciicities of the instrument employed for classifying exposed/ unexposed individuals (non-diseased as well as diseased) are known, then researchers can correct this type of error. However, this is not always possible. Therefore, in this article, the efect of misclassiication error (diferential and non-diferential) on odds ratio estimates is simulated using a case-control design. This efect is simulated as a function of the sensitivity and speciicity of the exposure classiication given diferent prevalence rates of the exposure among the controls and diferent true ORs to describe how misclassiication error occurs and to identify possible trends. These trends may guide the discussion of results in this type of studies when there are deiciencies in the classiication instruments.
MATERIALS AND METHODS
OUTCOME
and the true OR (expressed in hundreds). Negative bias values indicate underestimates of the OR, and positive bias values indicate overestimates. Likewise, bias values close to zero indicate the absence of bias.
STUDY DESIGN
Simulation studies employed in various areas of research are very useful to understand the behaviour of certain phenomena under diferent virtual scenarios prompted by researchers through some specialized software. In statistical robustness studies these are very common to observe the behaviour of an estimator under diferent scenarios that could occur in reality. Given the similarity between the simulation studies and experimental studies, this last approach is used to quantify the efect of misclassiication in case-control studies15.
For this, we have considered six factors:
1. the sensitivity of the exposure classiication among the cases; 2. the speciicity of the exposure classiication among the cases; 3. the sensitivity of the exposure classiication among the controls; 4. the speciicity of the exposure classiication among the controls; 5. the prevalence of the exposure among the controls; and
6. the odds ratio.
There were ive levels for factors 1 – 4 (0, 25, 50, 75 and 100%) and two levels for factors 5 – 6 (5 and 30% for the prevalence and 2 and 7 for the OR). A total of 2,500 scenarios were generated (45 x 22). One hundred of these scenarios comprised the NDME analysis because
the factors 1 and 3 levels as well as the factors 2 and 4 levels were the same. Therefore, the number of factors considered in this analysis was reduced to four. The remainder of scenarios (n = 2,400) made up the DME analysis, conserving the six initially stated factors.
STATISTICAL ANALYSIS
close to 0% which yielded an adequate sample size to do comparisons. For this analysis, we created a categorical variable with three levels:
1. Negative bias or underestimation of the OR (relative bias values smaller than -15%); 2. Bias absent (bias values greater than -15% but less than 15%); and
3. Positive bias or overestimation of the OR (bias values greater than 15%).
Spearman’s correlation coeicient was used to assess the relationships between the diferent levels of the DME analysis factors and positive, absent or negative bias. P-values less than or equal to 0.05 were considered signiicant. The R statistical package (R CoreTeam (2013). R: A language and environment for statistical computing. R Foundation for Statistical Computing, Vienna, Austria. ISBN 3-900051-07-0, URL http://www.R-project.org/) was utilized for generating the scenarios, producing the results of the simulation and conducting the data analyses. R scripts are available on request from the corresponding author.
RESULTS
NON-DIFFERENTIAL MISCLASSIFICATION ERROR
The bias attributable to NDME was negative in the whole 100 scenarios and very negative in many cases, indicating that in the presence of NDME in a case-control study, the risk is always underestimated, even beyond the null hypothesis (OR = 1). In extreme cases of NDME, the OR becomes the inverse of the true odds ratio if the sensitivity and speciicity of the exposure classiication tend towards 0%, it approaches one if the sensitivity and speciicity of the exposure classiication tend towards 50% and it tends towards the true OR if the sensitivity and speciicity of the exposure classiication tend towards 100% (Figures 1A and 1B). On the other hand, when the speciicity of the exposure classiication is 100% and the sensitivity is 0%, the OR is underestimated, but never drops below the value that corresponds with the null hypothesis (OR = 1). If the speciicity tends towards 0%, even if the sensitivity is high, the OR is underestimated below the level of the null hypothesis (Figures 1A and 1B). According to the simulations we conducted, when the speciicity level is higher than the sensitivity level, an unbiased estimate of the OR is produced (p-value for the interaction between sensitivity and speciicity = 0.014).
A 0 -20 -40 -60 -80
0 0.25 0.5 0.75 1
Se
Relativ
e bias (%)
-100 B 0 -20 -40 -60 -80
0 0.25 0.5 0.75 1
Se
Relativ
e bias (%)
-100 C 0 -20 -40 -60 -80 0.05 0.3 Relativ
e bias (%)
-100 0.05 0.3
D 0 -20 -40 -60 -80 Relativ
e bias (%)
-100 E 0 -20 -40 -60 -80 0.05 0.3
Exposure prevalence in controls Exposure prevalence in controls
True odds ratio True odds ratio
Exposure prevalence in controls Exposure prevalence in controls
Relativ
e bias (%)
-100 0.05 0.3
F 0 -20 -40 -60 -80 Relativ
e bias (%)
-100 G 0 -20 -40 -60 -80 2 7 Relativ
e bias (%)
-100 2 7
0 Se 0.25 0.5 0.75 1 0 Se 0.25 0.5 0.75 1 0 Se 0.25 0.5 0.75 1 0 Se 0.25 0.5 0.75 1 0 Se 0.25 0.5 0.75 1 0 Se 0.25 0.5 0.75 1 0 Se 0.25 0.5 0.75 1 0 Se 0.25 0.5 0.75 1 H 0 -20 -40 -60 -80 Relativ
e bias (%)
-100
Se: sensitivity. Sp: speciicity. Lines represent levels 100% (continuous), 75% (short discontinuous), 50% (dots), 25% (dot-discontinuous) and 0% (large discontinuous) of Se and/or Sp.
Relative biases below horizontal line are underestimates beyond the null hypothesis (odds ratio = 1): -50% for a true odds ratio equal to 2 (graphs A, C and E), and -86% for a true odds ratio equal to 7 (graphs B, D and F).
DIFFERENTIAL MISCLASSIFICATION ERROR
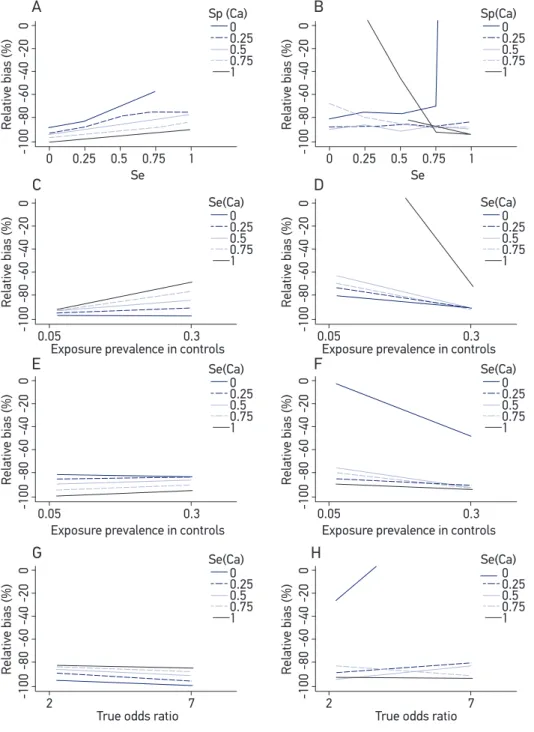
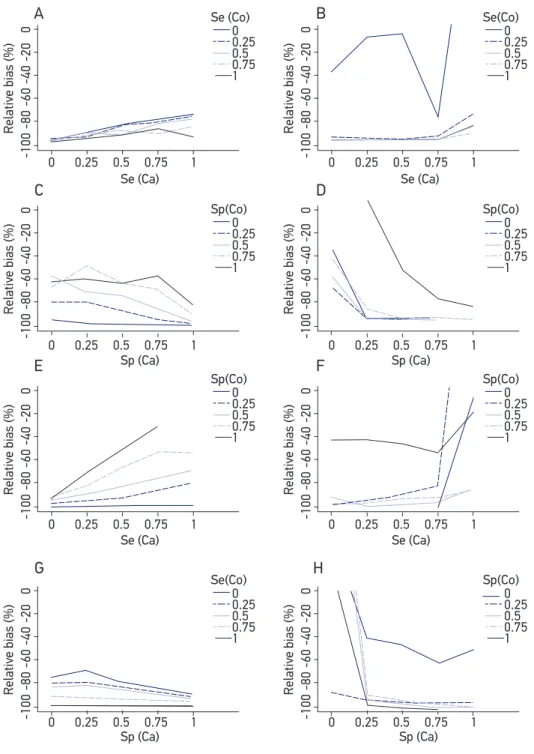
Of the 2,400 scenarios in the ECD analysis, 767 (32%) overestimated (i.e., positive bias) and 1,633 (68%) underestimated (i.e., negative bias) the true odds ratio. As opposed to the NDME analysis, the results of the DME are complex, not only because of the number of factors involved in the simulations but also because they do not produce a trend that clearly describes the efect of DME in relation to the combinations of factors. Therefore, the DME analysis is presented in a discriminatory manner according to the type of bias: negative or positive. Figures 2 to 4 correspond to the medians of the relative biases for diferent combinations of the six factors included in this analysis. High levels of sensitivity and speciicity of the exposure classiication among the cases (SeCa and SpCa, respectively) reduce the bias, but they reduce positive bias more than negative bias (Figures 2A and 2B). A similar efect is observed for the sensitivity and speciicity of the exposure classiication among the controls (SeCo and SpCo, respectively), although the efect is less clear for SeCo (Figures 3A and 3B). With regard to the prevalence of the exposure among the controls, the bias is lower when the exposure prevalence is high, independent of the sensitivity or speciicity of the exposure classiication, both for the cases and for the controls (Figures 2C to 2F and 3C to 3F). Regarding the speciicity, the efect was the opposite of that observed for NDME. When the levels of sensitivity and speciicity were combined with the levels of the true ORs for the cases and the controls, no clear pattern of bias was observed (Figures 2G, 2H, 3G and 3H). After combining SeCa, SpCa, SeCo and SpCo, we observed that the bias decreased with high levels of speciicity more than with sensitivity in both the cases and the controls. However, these trends were not very clear (Figures 4A to 4H).
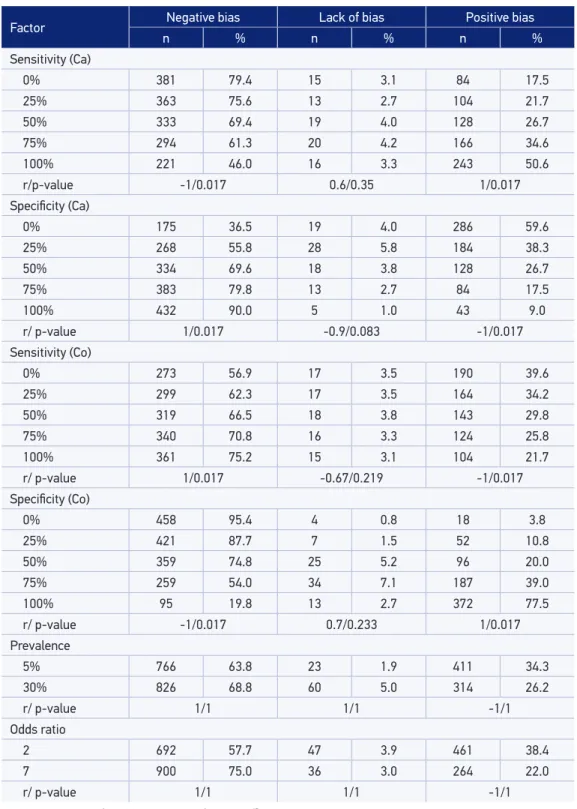
Table 1 presents the negative, absent or positive bias associated with DME according to each factor. Negative bias percentages decreased with high levels of SeCa and SpCo (Spearman’s p-values = 0.017). In the other cases, the negative bias percentage increased. The complete opposite occurred with positive bias. The absence of bias was invariably observed for varying levels of sensitivity and speciicity of the exposure classiication among the cases and the controls (Spearman’s p-values > 0.05). A high exposure prevalence among the controls was correlated with increased percentages of absent and negative bias and with a decreased percentage of positive bias, but these were not signiicant (Spearman’s p-values = 1). High ORs were associated with an increase in negative bias and a decrease in positive and absent bias, but these results were not signiicant (Spearman’s p-values = 1).
DISCUSSION
0
-20
-40
-60
-80
0 0.25 0.5 0.75 1
Se
Relativ
e bias (%)
-100 0 -20 -40 -60 -80
0 0.25 0.5 0.75 1
Se
Relativ
e bias (%)
-100 0 -20 -40 -60 -80 0.05 0.3 Relativ
e bias (%)
-100 0.05 0.3 0 -20 -40 -60 -80 Relativ
e bias (%)
-100 0 -20 -40 -60 -80 0.05 0.3
Exposure prevalence in controls Exposure prevalence in controls
True odds ratio True odds ratio
Exposure prevalence in controls Exposure prevalence in controls
Relativ
e bias (%)
-100 0.05 0.3 0 -20 -40 -60 -80 Relativ
e bias (%)
-100 0 -20 -40 -60 -80 2 7 Relativ
e bias (%)
-100 2 7 0 Se(Ca) 0.25 0.5 0.75 1 0 Sp(Ca) 0.25 0.5 0.75 1 0 Se(Ca) 0.25 0.5 0.75 1 0 Sp (Ca) 0.25 0.5 0.75 1 0 Se(Ca) 0.25 0.5 0.75 1 0 Se(Ca) 0.25 0.5 0.75 1 0 Se(Ca) 0.25 0.5 0.75 1 0 Se(Ca) 0.25 0.5 0.75 1 0 -20 -40 -60 -80 Relativ
e bias (%)
-100
A B
C D
E F
G H
Ca: cases. Se: sensitivity. Sp: speciicity. Lines represent levels 100% (continuous), 75% (short discontinuous), 50% (dots), 25% (dot-discontinuous) and 0% (large discontinuous) of Se and/or Sp.
0
-20
-40
-60
-80
0 0.25 0.5 0.75 1
Se
Relativ
e bias (%)
-100 0 -20 -40 -60 -80
0 0.25 0.5 0.75 1
Se
Relativ
e bias (%)
-100 0 -20 -40 -60 -80 0.05 0.3 Relativ
e bias (%)
-100 0.05 0.3 0 -20 -40 -60 -80 Relativ
e bias (%)
-100 0 -20 -40 -60 -80 0.05 0.3
Exposure prevalence in controls Exposure prevalence in controls
True odds ratio True odds ratio
Exposure prevalence in controls Exposure prevalence in controls
Relativ
e bias (%)
-100 0.05 0.3 0 -20 -40 -60 -80 Relativ
e bias (%)
-100 0 -20 -40 -60 -80 2 7 Relativ
e bias (%)
-100 2 7 0 Se(Co) 0.25 0.5 0.75 1 0 Sp(Co) 0.25 0.5 0.75 1 0 Se(Co) 0.25 0.5 0.75 1 0 Sp (Co) 0.25 0.5 0.75 1 0 Sp(Co) 0.25 0.5 0.75 1 0 Sp(Co) 0.25 0.5 0.75 1 0 Se(Co) 0.25 0.5 0.75 1 0 Sp(Co) 0.25 0.5 0.75 1 0 -20 -40 -60 -80 Relativ
e bias (%)
-100 A B C D -20 E F G H
Co: controls. Se: sensitivity. Sp: speciicity. Lines represent levels 100% (continuous), 75% (short discontinuous), 50% (dots), 25% (dot-discontinuous) and 0% (large discontinuous) of Se and/or Sp.
0
-20
-40
-60
-80
0 0.25 0.5 0.75 1
Se (Ca)
Relativ
e bias (%)
-100 0 -20 -40 -60 -80
0 0.25 0.5 0.75 1
Se (Ca)
Relativ
e bias (%)
-100
0 0.25 0.5 0.75 1 0 0.25 0.5 0.75 1
0 0.25 0.5 0.75 1 0 0.25 0.5 0.75 1
0 0.25 0.5 0.75 1 0 0.25 0.5 0.75 1
0 -20 -40 -60 -80 Relativ
e bias (%)
-100 0 -20 -40 -60 -80 Relativ
e bias (%)
-100 0 -20 -40 -60 -80
Se (Ca) Se (Ca)
Sp (Ca) Sp (Ca)
Sp (Ca) Sp (Ca)
Relativ
e bias (%)
-100 0 -20 -40 -60 -80 Relativ
e bias (%)
-100 0 -20 -40 -60 -80 Relativ
e bias (%)
-100 0 Sp(Co) 0.25 0.5 0.75 1 0 Se(Co) 0.25 0.5 0.75 1 0 Sp(Co) 0.25 0.5 0.75 1 0 Se (Co) 0.25 0.5 0.75 1 0 Sp(Co) 0.25 0.5 0.75 1 0 Sp(Co) 0.25 0.5 0.75 1 0 Se(Co) 0.25 0.5 0.75 1 0 Sp(Co) 0.25 0.5 0.75 1 0 -20 -40 -60 -80 Relativ
e bias (%)
-100
A B
C D
E F
G H
Ca: cases. Co: controls. Se: sensitivity. Sp: speciicity. Lines represent levels 100% (continuous), 75% (short discontinuous), 50% (dots), 25% (dot-discontinuous) and 0% (large discontinuous) of Se and/or Sp.
Table 1. Percentages of negative bias, lack of bias (absolute relative bias less than 15%) and positive bias of the estimated odds ratio in case-control studies under the efect of diferential misclassiication error.
Factor Negative bias Lack of bias Positive bias
n % n % n %
Sensitivity (Ca)
0% 381 79.4 15 3.1 84 17.5
25% 363 75.6 13 2.7 104 21.7
50% 333 69.4 19 4.0 128 26.7
75% 294 61.3 20 4.2 166 34.6
100% 221 46.0 16 3.3 243 50.6
r/p-value -1/0.017 0.6/0.35 1/0.017
Speciicity (Ca)
0% 175 36.5 19 4.0 286 59.6
25% 268 55.8 28 5.8 184 38.3
50% 334 69.6 18 3.8 128 26.7
75% 383 79.8 13 2.7 84 17.5
100% 432 90.0 5 1.0 43 9.0
r/ p-value 1/0.017 -0.9/0.083 -1/0.017
Sensitivity (Co)
0% 273 56.9 17 3.5 190 39.6
25% 299 62.3 17 3.5 164 34.2
50% 319 66.5 18 3.8 143 29.8
75% 340 70.8 16 3.3 124 25.8
100% 361 75.2 15 3.1 104 21.7
r/ p-value 1/0.017 -0.67/0.219 -1/0.017
Speciicity (Co)
0% 458 95.4 4 0.8 18 3.8
25% 421 87.7 7 1.5 52 10.8
50% 359 74.8 25 5.2 96 20.0
75% 259 54.0 34 7.1 187 39.0
100% 95 19.8 13 2.7 372 77.5
r/ p-value -1/0.017 0.7/0.233 1/0.017
Prevalence
5% 766 63.8 23 1.9 411 34.3
30% 826 68.8 60 5.0 314 26.2
r/ p-value 1/1 1/1 -1/1
Odds ratio
2 692 57.7 47 3.9 461 38.4
7 900 75.0 36 3.0 264 22.0
r/ p-value 1/1 1/1 -1/1
Misclassiication bias refers to errors made when classifying an individual into a certain group, such as diseased individuals or individuals exposed to a certain factor. It occurs when non-validated instruments are used and the sensitivity and speciicity of the classiication method is unknown. Misclassiication errors act in a particular direction, positive or negative17,
underestimating or overestimating the true value of the association measure, such as the relative risk (RR) in cohort studies, the hazard ratio (HR) in longitudinal studies and the odds ratio (OR) in case-control studies. Misclassiication error can be diferential or non-diferential. When DME occurs, the sensitivity and/or the speciicity of the classiication of the subjects are diferent among comparison groups3. NDME results in a decrease in statistical power (i.e., the ability
of a test to show an association when one really exists), biasing the value of the OR towards the null2,6-11. DME biases the association either towards or away from the null hypothesis12.
The majority of the time, it is impossible to predict the direction of the bias because of the complex framework involving diferences in sensitivity, speciicity and exposure prevalence between the cases and the controls. Although Chyou18 claims to have found patterns of the
efect of DME, such patterns are described only for certain pre-established scenarios and not for a general scenario as our study intended to. In fact it is one of the limitations Chyou refers in his paper18. Of course, one aspect to highlight in the description of DME is that there is a
strong inluence of the prevalence of exposure as well as the estimated efect size. In practice, DME often arises when surveys are administered because it is possible that cases have better memory of the exposure than the controls, which have less motivation to remember. These surveys do not always prompt completely true responses, not because an individual intended to lie but because the individual cannot recall their exposure history3. The immediate consequence
is that when the exposure classiication is determined, false positives or false negatives arise19.
researchers question how cigarette use has been measured and then implement better approaches such as measurements of metabolites in blood or hair, avoiding then self-report20.
In this simulation, it was determined that the DME of the exposure in a case-control study produces positive bias, which is lower compared with the quantity of negative bias (30 versus
70%). However, the positive bias is highly variable and reaches unexpected sizes (as high as 50,000%). Another important inding of this study is that the efect of the factors (sensitivity and speciicity of the exposure classiication, the exposure prevalence among the controls, true OR) on relative bias is completely diferent for positive bias than for negative bias. There were no similarities between the two types of bias, and the bias seemed to be afected by all of the factors at the same time and not independently, which would indicate a high degree of interaction between them. These interactions are diicult to interpret using graphics because they only describe two-order interactions. However, the linear models revealed second-, third-, fourth-, and ifth-order signiicant interactions (data not shown). Of the 57 possible interactions in the DME analysis, 22 (39%) were signiicant for negative bias and 27 (47%) for positive bias, showing the degree of complexity in this analysis in comparison to the NDME analysis, which only revealed two signiicant interactions among the 11 possible interactions (18%).
Our analyses were based on the variation of the sensitivity and specificity of the classiication of an event of interest. However, we recognize that there are other approaches which additionally include the predictive value of the classiication methods such as the one Marshall21 proposed. Even so, we believe that the approach presented by us is useful for
understanding the efects of the limitations in terms of sensitivity and speciicity and even more useful because researchers could easily ind explanations for the lack of associations or implausible indings through systematic reviews about the limitations of the instruments used by them. Although knowledge of prior information such as sensitivity and speciicity of the exposure classiication could allow researchers to detected misclassiication bias22 and
correct it23,24, we insist that is very useful to be aware about the efects of misclassiication
and how these could be avoided if researchers validate the methods of classiication. As with any other type bias, it will always be best avoid bias rather than having to correct it.
CONCLUSION
epidemiologists and researchers are close not only to the elaboration and design of surveys, but also to the monitoring of the quality with which these are applied as well as the quality control of other classiication procedures and tests laboratory and/or diagnostic tests.
SOFTWARE
Scripts in the form of R code are available on request from the corresponding author.
ACKNOWLEDGMENTS
This work was supported by Estrategia de Sostenibilidad 2013-2014, Universidad de Antioquia. AB is a recipient of a doctoral fellowship grant from Colombian Institute for Scientiic and Technological Development (COLCIENCIAS 2010).
1. Kleinbaum D, Kupper L, Morgenstern H. Epidemiologic
Research: Principles and Quantitative Methods New York: Van Nostrand Reinhood Company, 1982.
2. Rothman K, Greenland S. Modern Epidemiology. 3th
ed. Philadelphia: Lippincott Raven Publishers, 2012.
3. dos-Santos I. Cancer Epidemiology: Principles and
Methods. Lyon, Francia: IARC Library Cataloguing in Publication Data, 1999.
4. Sanders SA, Hill BJ, Yarber WL, Graham CA, Crosby
RA, Milhausen RR. Misclassiication bias: diversity in conceptualisations about having ‘had sex’. Sex Health 2010; 7: 31-4.
5. Rikala M, Hartikainen S, Saastamoinen LK, Korhonen
MJ. Measuring psychotropic drug exposures in register-based studies - validity of a dosage assumption of one unit per day in older Finns. Int J Methods Psychiatr Res 2013; 22(2): 155-65.
6. Bross I. Misclassiication in 2x2 tables. Biometrics.
1954; 10: 478-86.
7. Newell D. Errors in the interpretation of errors in
epidemiology. Am J Public Health Nations Health 1962; 52: 1925-8.
8. Keys A, Kihlberg J. Effect of misclassification on
estimated relative prevalence of a characteristic: Part I. Two populations infallibly distinguished: Part II. Errors in two variables. Am J Public Health Nations Health 1963; 53: 1656-65.
9. Gullen WH, Bearman JE, Johnson EA. Effects of
misclassification in epidemiologic studies. Public Health Rep 1968; 83: 914-8.
10. Goldberg J. Effects of misclassification on bias in
diference between 2 proportions and relative odds in fourfold table. J Am Stat Assoc 1975; 70: 7.
11. Weinberg C, Umbach D, Greenland S. When will
nondiferential misclassiication of an exposure preserve the direction of a trend. Am J Epidemiol 1994; 140(6): 565-71.
12. Szklo M, Nieto F. Epidemiología intermedia. Conceptos
y aplicaciones. España: Díaz de Santos, 2003.
13. Vogel C, Gefeller O. Implications of nondiferential
misclassiication on estimates of attributable risk. Methods Inf Med 2002; 41: 342-8.
14. Daniel W, Cross C. Biostatistics: A Foundation
for Analysis in the Health Sciences. USA: Wiley, 2013.
15. Salazar JC, Baena A. Análisis y diseño de experimentos
aplicados a estudios de simulación. Dyna revfacnacminas. 2009; 159: 249-57.
16. MacMahon B, Yen S, Trichopoulos D, Warren K, Nardi
G. Cofee and cancer of the pancreas. N Engl J Med 1981; 304(11): 630-3.
17. Fox MP, Lash TL, Greenland S. A method to automate
probabilistic sensitivity analyses of misclassiied binary variables. Int J Epidemiol 2005; 34: 1370-6.
18. Chyou PH. Patterns of bias due to differential misclassification by control status in a case-control study. Eur J Epidemiol 2007; 22: 7-17.
19. Hrubá D. [Smoking and breast cancer]. Klin Onkol.
2013; 26: 389-93.
20. Joya X, Manzano C, Álvarez AT, Mercadal M, Torres
F, Salat-Batlle J, et al. Transgenerational exposure to environmental tobacco smoke. Int J Environ Res Public Health 2014; 11: 7261-74.
21. Marshall RJ. Misclassiication of exposure in case-control
studies: assessment by quality indices. Epidemiology 1994; 5: 309-14.
22. Marshall RJ. An empirical investigation of exposure
measurement bias and its components in case-control studies. J Clin Epidemiol 1999; 52(6): 547-50.
23. Gustafson P, Le ND, Saskin R. Case-control analysis
with partial knowledge of exposure misclassiication probabilities. Biometrics 2001; 57: 598-609.
24. Marshall RJ. Assessment of exposure misclassiication
bias in case-control studies using validation data. J Clin Epidemiol 1997; 50(1): 15-9.
Received on: 04/28/2014