ABSTRACT: Objective: To estimate the prevalence of self-reported diabetes mellitus (DM)and its associated
factors among the Brazilian adult population. Methods: The prevalence of DM was assessed in the Survey on Social Dimensions of Inequalities, a national survey with macro-regions representativeness carried out in 2008. Data were collected by a personal face-to-face interview with 12,423 individuals of both sexes, aged over 20 years. The χ2 test at 5.0% was performed in order to identify associated factors, and logistic regression was used to
estimate adjusted odds ratios. Results: The prevalence of DM in Brazil was 7.5%. After adjusting for potential confounders, diabetes remained associated with age (≥ 40 years), education (< 8 years of study), marital status (non-married), obesity, sedentary lifestyle, comorbidity with hypertension and hypercholesterolemia, as well as the demand for health services. Conclusion: Results indicate a high prevalence of DM and its associated preventable factors in Brazil. Thus, they highlight the need for a behavioral change as a strategy for prevention and control of diabetes and its complications.
Keywords: Diabetes mellitus. Diabetes mellitus, type 2. Self report. Health surveys. Prevalence. Logistic models.
The prevalence of diabetes mellitus and its
associated factors in the Brazilian adult population:
evidence from a population-based survey
Prevalência de diabetes mellitus
e fatores associados na população adulta
brasileira: evidências de um inquérito de base populacional
Luisa Sorio FlorI
, Monica Rodrigues CamposI
INational School of Public Health – Rio de Janeiro (RJ), Brazil.
Corresponding author: Luisa Sorio Flor. Rua Dulce, 261, apto. 402, Tijuca, CEP: 20550-080, Rio de Janeiro, RJ, Brasil. E-mail: [email protected]
Conlict of interests: nothing to declare – Financial support: none.
INTRODUCTION
Diabetes mellitus (DM)currently stands out as an important cause of morbidity and
mortality. Global estimates indicate that 382 million people live with DM (8.3%), and this
number could reach 592 million by 20351. Approximately 50.0% of patients with diabetes
are believed to be unaware of their condition2. With regard to mortality, it is estimated that
5.1 million people between the age of 20 and 79 years died of diabetes in 20133. By 2030,
DM may rise from ninth to seventh most important cause of death worldwide4.
At the national level, the disease also represents a health problem of great magnitude. In 2013, Brazil earned fourth place among the countries with the largest number of diabetic
people, counting 11.9 million cases among adult individuals (20–70 years of age)3. In addition,
between 1996 and 2007, an increase of 2.0% in the mortality from this disease was observed5.
The aging of the population, the increasing prevalence of obesity and of a sedentary lifestyle, and the processes of urbanization are considered the principal factors responsible
for the increase in the incidence and prevalence of DM around the world3,6. This situation
has generated high social and inancial costs for the patient and for the healthcare system.
Rosa et al.7 estimated that DM accounted for 12.0% of the total hospitalizations not related
to pregnancies and for up to 15.4% of hospital costs of the Brazilian Public Health System (SUS) in the period from 2008 to 2010.
Thus, taking into consideration the relevance of DB, in addition to the shortage of ana-lytic population-based studies, with national representativeness, this study aimed at inves-tigating the prevalence of self-reported DM and its associated factors in the Brazilian adult population, in the year 2008.
ReSUMO: Objetivo: Estimar a prevalência de diabetes mellitus (DM)autorreferida e fatores associados na população adulta brasileira. Métodos: A prevalência de DM foi aferida na Pesquisa Dimensões Sociais das Desigualdades (PDSD), um survey nacional com representatividade para as macrorregiões, conduzido em 2008. Foram entrevistados 12.423 indivíduos de ambos os sexos, com idade igual ou superior a 20 anos. Para a identiicação de fatores associados, foi realizado teste do χ2 ao nível 5,0% e calculadas as razões de chance ajustadas por meio de regressão logística.
Resultados: A prevalência de DM no Brasil foi de 7,5%. Após o ajuste para potenciais fatores de confusão, o diabetes permaneceu associado com a idade (≥ 40 anos), a escolaridade (< 8 anos de estudo), o estado conjugal (não casados), a obesidade, o sedentarismo, a comorbidade com hipertensão arterial e hipercolesterolemia, bem como com a procura por serviços de saúde. Conclusão: Resultados indicam elevada prevalência de DM e vários dos seus fatores associados (identiicados como evitáveis) apontam a necessidade de mudanças comportamentais como estratégia para prevenção e controle do diabetes e suas complicações.
METHODS
This is a cross-sectional study carried out with data from the national survey on Social
Dimensions of Inequalities Research (in Portuguese Pesquisa Dimensões Sociais das Desigualdades –
PDSD), conducted in 2008, and coordinated by the Instituto Universitário de Pesquisas do Rio
de Janeiro (IUPERJ) with the participation of researchers from other teaching and research academic institutions. The study was inanced under the Millennium Institutes Program, by the National Council of Scientiic and Technological Development (CNPq), and sought to interview heads of households and their spouses, both over 20 years of age, in addition to investigating themes such as life conditions, education, occupation, and health.
The population of the study was determined using a stratiied multistage random sampling. The sample was composed of 1,374 census tracts (primary sampling units) and 8,048 permanent households (secondary sampling units) in common or nonspeciic tracts, including favelas in urban and rural areas in all regions of Brazil. Since the main objective of the study was to analyze inequality in Brazil, a stratum of the sampling including the 10.0% richest of each census tract was created with the objective of guaranteeing greater access to respondents of this stratum and, thus, improving the precision of the inequality indicators. Approximately 20.0% of the primary households were replaced by other house-holds, principally due to the refusal or impossibility of one of the spouses to accept being interviewed by the interviewer. This replenishment process sought to select new house-holds within the same census tract (a neighboring household as close as possible) with the intention of preserving sociodemographic characteristics. In the end, 12,423 adult
partici-pants of both sexes were interviewed.8
The presence of DM was determined by means of the following question: “Has a doc-tor told you that you have diabetes?” This same question structure was used as a measure of the occurrence of other chronic diseases. Despite the fact that the analysis incorporated people with type 1 and type 2 diabetes, it is known by the literature, that type 2 represents
more than 90.0% of all cases of DM,3 which makes it the principal focus of this study.
In reference to the independent variables, they were divided into two large groups: socio-demographic variables (group 1), and behavioral and health condition variables (group 2). In group 1, the variables for “sex” (male or female) and “age,” in years, categorized by age range (20 – 39; 40 – 64; ≥ 65 years) were included. The level of “education” was clas-siied into three categories, in accordance with the number of years completed of formal schooling (0 – 4 years; 5 – 7 years; ≥ 8 years). The variable “marital status” was classiied into two categories: “married/union” and “others”—separated, widowed, or single. The par-ticipants were also grouped according to “region of origin.” And, inally, “economic class” was deined according to “Brazil’s Economic Classiication Criteria—2008” and added to allow for an analysis in three categories (A/B, C, and D/E).
in the past year” was categorized in accordance with the frequency of alcoholic ingestion declared by the interviewee (none; up to one time a week; ≥ 2 times per week). The pres-ence/absence of “hypercholesterolemia” and “arterial hypertension” was also veriied through prior self-reported medical diagnosis. The use of health services was evaluated by the variable “medical appointment in the last twelve months” (yes or no).
In order to verify the existence of association between the demographic, behavioral, and
health variables and self-reported DM, Person’s χ2test was used with a signiicance level of
5.0%. In a subsequent step, a multivariate logistic regression model was chosen to adapt to the need to control confounding variables and the use, as a response variable, of a binary
event. The method of selection used was thestepwise backward. The variables that show
statistical signiicance in the univariate analysis (p ≤ 0.05) were included in the model and, after the interactions, the variables with p > 0.05 were eliminated. Finally, the logistic regres-sion coeicients, the odds ratios and their 95% conidence intervals, as well as the probabil-ities for the outcome according to signiicant variables in the inal model were determined. The proportion of correct classiications from the inal model separately between the pos-itives for diabetes and among those that did not refer to diabetes, as well as the proportion of total classiication, were determined.
The data were analyzed using the software Statistical Package for the Social Sciences (SPSS, Chicago, USA) version 17.0 for Windows. The PDSD was submitted to the Committee
of Ethics in Research of the Escola Nacional de Saúde Pública Sergio Arouca and it was
consid-ered adequate for the human population (CEP nº 157/11). There are no conlicts of interest.
RESULTS
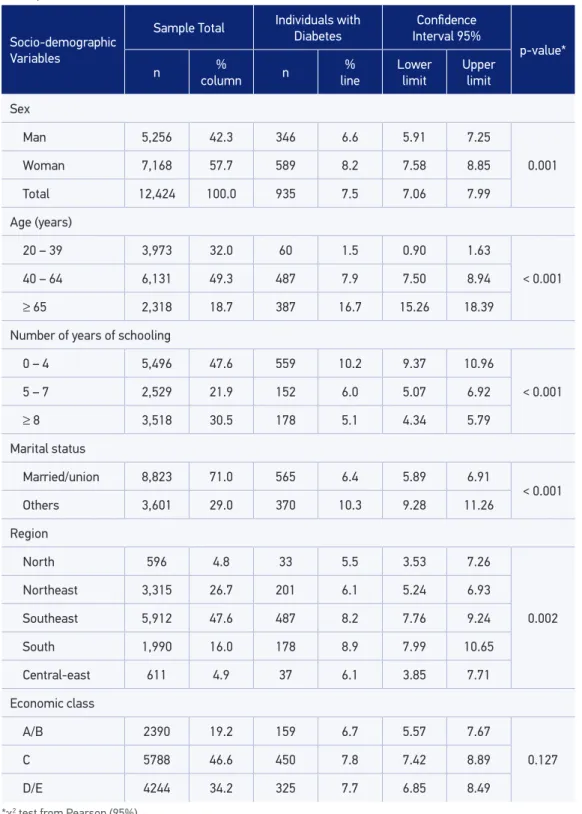
Table 1 shows that the prevalence of DM in the population studied was 7.5%. Among peo-ple with diabetes (n=935), there is a higher prevalence among women (8.2%), among those who are not married or in a union (10.3%) and among the residents of more developed regions, such as the South (8.9%) and the Southeast (8.2%). With regard to age, a greater occurrence of DM in individuals aged over 65 years (16.5%) was observed. Illiterate indi-viduals or those with a low educational level demonstrated a prevalence of DM two times higher (10.2%) than those who had more than 8 years of schooling (5.1%). A signiicant association was not observed between economic class and self-reported diabetes.
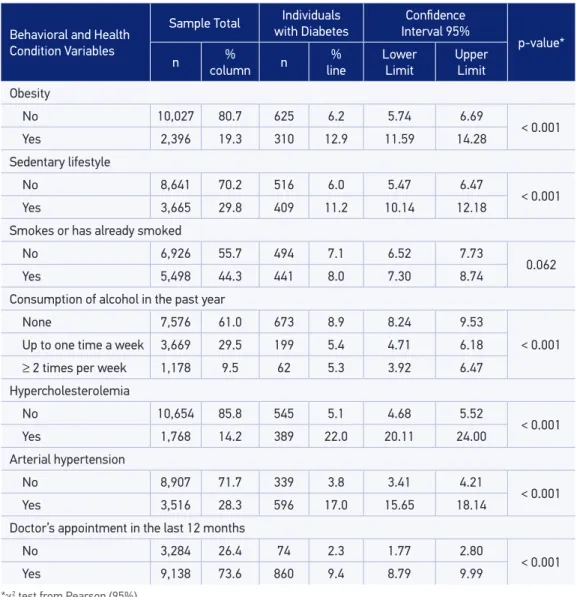
In relation to the behavioral and health variables (Table 2), all of them demonstrated a signiicant association with the outcome, except smoking habit (p = 0.062). Obese individu-als and those with a sedentary lifestyle were approximately two times more afected by DM when compared to those who did not show such characteristics. Prevalence ratio referring to alcohol consumption showed a signiicant association; however, it was an inverse association.
Table 1. Sample distribution and prevalence of self-reported diabetes according to sociodemographic and economic variables in adults (≥ 20 years). Social Dimensions of Inequalities Research (PDSD), Brazil, 2008.
Socio-demographic Variables
Sample Total Individuals with Diabetes
Conidence Interval 95%
p-value*
n %
column n
% line
Lower limit
Upper limit
Sex
Man 5,256 42.3 346 6.6 5.91 7.25
0.001 Woman 7,168 57.7 589 8.2 7.58 8.85
Total 12,424 100.0 935 7.5 7.06 7.99
Age (years)
20 – 39 3,973 32.0 60 1.5 0.90 1.63
< 0.001
40 – 64 6,131 49.3 487 7.9 7.50 8.94
≥ 65 2,318 18.7 387 16.7 15.26 18.39
Number of years of schooling
0 – 4 5,496 47.6 559 10.2 9.37 10.96
< 0.001
5 – 7 2,529 21.9 152 6.0 5.07 6.92
≥ 8 3,518 30.5 178 5.1 4.34 5.79
Marital status
Married/union 8,823 71.0 565 6.4 5.89 6.91
< 0.001 Others 3,601 29.0 370 10.3 9.28 11.26
Region
North 596 4.8 33 5.5 3.53 7.26
0.002 Northeast 3,315 26.7 201 6.1 5.24 6.93
Southeast 5,912 47.6 487 8.2 7.76 9.24
South 1,990 16.0 178 8.9 7.99 10.65
Central-east 611 4.9 37 6.1 3.85 7.71
Economic class
A/B 2390 19.2 159 6.7 5.57 7.67
0.127
C 5788 46.6 450 7.8 7.42 8.89
D/E 4244 34.2 325 7.7 6.85 8.49
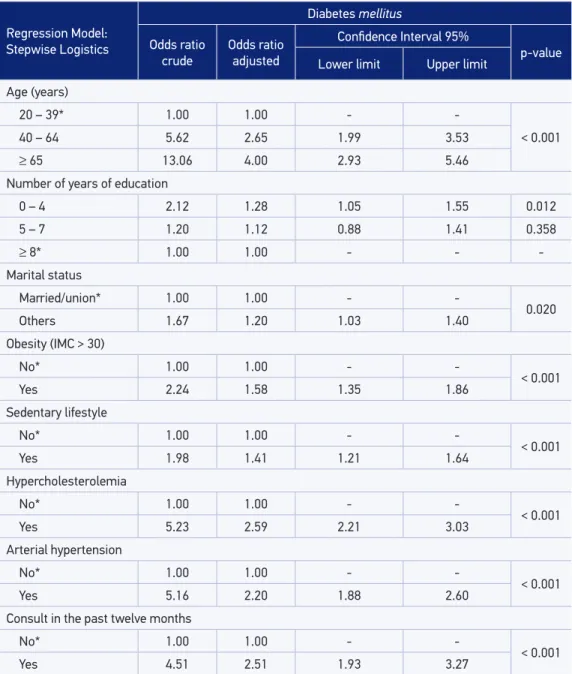
with DM. The prevalence of those who reported having had appointment with a doctor in the last year was 9.4% in relation to 2.3% of those that did not report such practice (Table 2). All of the studied variables entered into the final model, except economic class and smoking habits, because they were not significant in the univariate analysis. After being adjusted by the multivariate model, DM remained associated with age (≥ 40 years), edu-cation (< 8 years of schooling), marital status (not married), the presence of obesity, and a sedentary lifestyle, with high levels of cholesterol, with a previous diagnosis of arterial hypertension, and with the demand for health services (Table 3). Sex, region
Behavioral and Health Condition Variables
Sample Total with DiabetesIndividuals Interval 95%Conidence
p-value*
n %
column n
% line
Lower Limit
Upper Limit
Obesity
No 10,027 80.7 625 6.2 5.74 6.69
< 0.001
Yes 2,396 19.3 310 12.9 11.59 14.28
Sedentary lifestyle
No 8,641 70.2 516 6.0 5.47 6.47
< 0.001
Yes 3,665 29.8 409 11.2 10.14 12.18
Smokes or has already smoked
No 6,926 55.7 494 7.1 6.52 7.73
0.062
Yes 5,498 44.3 441 8.0 7.30 8.74
Consumption of alcohol in the past year
None 7,576 61.0 673 8.9 8.24 9.53
< 0.001
Up to one time a week 3,669 29.5 199 5.4 4.71 6.18
≥ 2 times per week 1,178 9.5 62 5.3 3.92 6.47
Hypercholesterolemia
No 10,654 85.8 545 5.1 4.68 5.52
< 0.001
Yes 1,768 14.2 389 22.0 20.11 24.00
Arterial hypertension
No 8,907 71.7 339 3.8 3.41 4.21
< 0.001
Yes 3,516 28.3 596 17.0 15.65 18.14
Doctor’s appointment in the last 12 months
No 3,284 26.4 74 2.3 1.77 2.80
< 0.001
Yes 9,138 73.6 860 9.4 8.79 9.99
Table 2. Sample distribution and prevalence of self-reported diabetes according to behavioral and health variables in adults (≥ 20 years). Social Dimensions of Inequalities Research (PDSD), Brazil, 2008.
of origin, and alcohol consumption were not associated with the occurrence of DM in this population.
According to what is demonstrated in Table 3, the odds of having DM showed to be four times higher among older people when compared to younger people (p < 0.001).
Table 3. Crude odds ratios and results of the inal multivariate logistic regression model (stepwise) for the occurrence of diabetes mellitus. Social Dimensions of Inequalities Research (PDSD), Brazil, 2008.
Note: Adjustment (Proportion of Classiication); Positives: 76.6%; Negatives: 70.5%; Total: 71.0%; *Reference category. Regression Model:
Stepwise Logistics
Diabetes mellitus
Odds ratio crude
Odds ratio adjusted
Conidence Interval 95%
p-value Lower limit Upper limit
Age (years)
20 – 39* 1.00 1.00 -
-< 0.001
40 – 64 5.62 2.65 1.99 3.53
≥ 65 13.06 4.00 2.93 5.46
Number of years of education
0 – 4 2.12 1.28 1.05 1.55 0.012
5 – 7 1.20 1.12 0.88 1.41 0.358
≥ 8* 1.00 1.00 - -
-Marital status
Married/union* 1.00 1.00 -
-0.020
Others 1.67 1.20 1.03 1.40
Obesity (IMC > 30)
No* 1.00 1.00 -
-< 0.001
Yes 2.24 1.58 1.35 1.86
Sedentary lifestyle
No* 1.00 1.00 -
-< 0.001
Yes 1.98 1.41 1.21 1.64
Hypercholesterolemia
No* 1.00 1.00 -
-< 0.001
Yes 5.23 2.59 2.21 3.03
Arterial hypertension
No* 1.00 1.00 -
-< 0.001
Yes 5.16 2.20 1.88 2.60
Consult in the past twelve months
No* 1.00 1.00 -
-< 0.001
After analysing the whole scenario, an age gradient in the chances of occurrence of DM was observed (Figure 1A). Another alteration was also observed with respect to education, but inversely (Figure 1B). The diference was signiicant only when compared to the extreme cat-egories (Table 3). Those with a low-level of education showed almost 30.0% more chances of having DM than those who had completed eight years or more of schooling (Table 3). Married individuals reduced the chance of having DM by 20% when compared with the other category (Table 3 and Figure 1C).
With respect to the behavioral and health variables, hypercholesterolemia and arte-rial hypertension were those most associated with the outcome when compared with the other variables (Figure 2). Individuals with a previous diagnosis of one of these conditions had more than double the chance of presenting a diagnosis of DM than
Figure 1. Predicted probability and observed probability of occurrence of diabetes mellitus according to sociodemographic variables. Social Dimensions of Inequalities Research (PDSD), Brazil, 2008.
Predicted probability (CI = 95%)
0.20
0.15
0.10
0.05
0.00
20-39 years 40-65 years ≥ 65 years
Age Range
Predicted probability (CI = 95%)
0.20
0.15
0.10
0.05
0.00
0-4 years 5-7 years ≥ 8 years
Education
Predicted probability (CI = 95%)
0.20
0.15
0.10
0.05
0.00
Others Married/Union
Marital Status
Predicted Probability Original values
A B
individuals without these diseases (Table 3). There was also an increase of 58.0% in the chance of occurrence of DM for obese people and 41.0% for those with a seden-tary lifestyle (Table 3).
DISCUSSION
The prevalence of DM found in the adult Brazilian population in 2008 was 7.5% (95%CI 7.02 – 7.95). The occurrence of DM was associated with modiiable and unchangeable fac-tors, with age (≥ 40 years), obesity, a sedentary lifestyle, and the presence of other health conditions being the ones to stand out.
Figure 2. Predicted probability and observed probability of occurrence of diabetes mellitus according to behavioral and health variables. Social Dimensions of Inequalities Research (PDSD), Brazil, 2008.
Predicted probability (CI = 95%)
0.25
0.20
0.15
0.10
0.05
0.00
No Yes
0.25
0.20
0.15
0.10
0.05
0.00
No Yes
Obesity (IMC ≥ 30)
Arterial Hypertension Hypercholesterolemia
Predicted probability (CI = 95%)
Sedentary Lifestyle
Predicted probability (CI = 95%)
0.25
0.20
0.15
0.10
0.05
0.00
Yes No
0.25
0.20
0.15
0.10
0.05
0.00
Yes No
Predicted probability (CI = 95%)
In the country, a more specialized study, using biochemical markers to estimate the prev-alence of diabetes was carried out in 1988 in nine Brazilian capital cities, when a prevprev-alence of 7.6% in adults aged between 30 and 69 years was obtained. More recent studies, in dif-ferent geographic contexts, show that the prevalence of diabetes varies between 6 and 15%
in the Brazilian adult population10-12.
Even though biochemical tests are the most recommended for the diagnosis of DM, various studies use self-reporting information, especially those with a large comprehen-siveness, such as the case of PDSD. Recently, results from the Risk Factors Surveillance System and Protection for Chronic Diseases Telephone Survey (acronym in Portuguese –
VIGITEL) showed that Brazilian capitals have a prevalence of DM of 6.3%13 for
individ-uals who are aged 18 years or older, which is similar to the result found for Brazil in the
National Health Research in 2013, with 6.2% (95%CI 5.9 – 6.6)14 for this same age group.
With regard to the National Household Sampling Survey (acronym in Portuguese – PNAD) from 2008, the prevalence found for the adult population (aged ≥ 18 years) was
4.3%15. This same study highlighted the rate of growth in the country over a period of
ten years. However, it is worth highlighting that comparisons between Brazilian sur-veys should not be done directly. They should take into consideration, the year of the study, methodological aspects such as age group investigated, the type of question used to indicate the presence of the disease, and aspects inherent in the process of sampling and conducting interviews. VIGITEL, for example, uses telephone interviews in their
investigations, in addition to including only the Brazilian capital cities in the survey13.
In the case of PNAD, the fact that one household member can respond for all members of the family is important to highlight, because it may further reduce the frequency
of the reported disease15. With regard to PDSD, its sampling process included an over
representation of the richest individuals, who, hypothetically, have more access to an early diagnosis, which could have contributed to the increase in the prevalence of the
reported disease in this stratum8.
With regard to the association with sociodemographic variables, age was the one that showed the highest efect over the chances of having DM. Similarly to other studies, the
diagnosis of the disease becomes more common among individuals at an elderly age13,14,16,17.
In the Bambuí Project – Population-Based Cohort Study on the Health of the Elderly, in which clinical tests were performed for the diagnosis of the disease, elderly individuals showed a prevalence approximately six times higher (14.6%) when compared to adult
indi-viduals aged between 18 and 59 years.18 In fact, much has been discussed about the impact of
changes in the demographic structure and the increase in longevity in the proile of chronic noncommunicable diseases, especially diabetes. The demographic transition observed in the last few decades has been indicated as one of the principal causes for the increase in the
incidence and prevalence of DM in Brazil and in the world. 6
A low level of education was also associated with a higher prevalence of DM. Such
associ-ation had already been veriied previously, in Brazil and other countries13,19,20. The prevalence
demonstrated to be much higher than among adults in other regions12. Education level demon-strated to be an important socioeconomic indicator, as it is considered a proxy of the social position of an individual. Such characteristic imply diferentiated risks in getting sick and in death, since they are related to access and use of health services, as well as inluences
famil-ial decisions concerning food, care for their body, and disease prevention21-23.
Even though economic class was not signiicant in the univariate analysis, a higher
prev-alence in the C and D/E classes was observed. Freitas and Garcia (2012)15 explain that in
cross-sectional population studies, to face a bias of prevalence or survival is possible, since indi-viduals with a worse socioeconomic level experience a lower survival rate. Because of this, such individuals can be underrepresented. Additionally, since education and income are con-nected to access to health services, it is most probable to encounter people with a previous
diagnosis of diabetes in a strata of higher income24. As stated by these authors, the estimated
social disparities between the social strata presented may be smaller than the true ones. With regard to marital status, this also remained associated with the diagnosis of DM, even after controlling for the remaining variables. Some studies published previously in
Brazil do not verify the association between these two aspects10,25. However, in a study of
elderly people in the city of São Paulo, the prevalence of diabetics was 60% higher among widows when compared with married people. This signiicance remained in the inal model,
even when it was adjusted for age26. In addition to potentially being associated with the
small-est chance of occurrence of DM, the presence of one partner is an important condition for diabetic individuals to manage the disease, since they motivate the patients to receive
treat-ment, to control unhealthy habits, and to adopt favorable lifestyles27.
Among the current existing strategies for the control of DM, those aimed at modiiable risk factors such as being overweight and physical inactivity stand out. Findings from diverse studies registered the statistically signiicant relationship between being overweight and a sedentary lifestyle and the incidence or the prevalence of diabetes, because that is the
rela-tion measured by the efects of resistance to insulin13,18,28. The nutritional transition observed
in the last decades has, as such, placed a large part of the population in risk for the
develop-ment of DM. In Brazil, in 200829, 58.3% of the burden of diabetes among women and 45.4%
among men was attributed to obesity—higher numbers than those found for 2002/200330.
Similarly to being overweight, a sedentary lifestyle has been associated with the
occur-rence of diabetes, independently of nutritional condition18. The regular practice of
phys-ical activities can prevent and control the disease since it acts to diminish or maintain corporal weight, diminish the resistance to insulin and contribute to improve glycemic
control, which, in turn, reduces the risk of complications associated with this disease31,32.
Despite such a causal relationship being amply reported in the literature, a study per-formed in Brazil, with the intention of evaluating population knowledge about the asso-ciations of four behavioral risk factors with some morbidities, it was shown that approx-imately half of the interviewees were not aware of the existing association between a
Commonly, diabetes seems to be associated with other conditions, such as arterial hypertension and dyslipidemia, which corroborates the indings of this study. In the city of Campos, Rio de Janeiro, it was observed that individuals with hypertension or disli-pedimia showed three times more of a chance of having DM when compared to the
pop-ulation unexposed to these factors11. In the elderly, having hypertension duplicated the
chance of occurrence of diabetes34. Such associations are consequent of the resistance
to insulin and are worrisome, because they considerably increase the risk of
cardiovas-cular complications15,35.
As DM is a chronic disease, patients with this disease need medical follow-up throughout their entire lives. This coupled with the increased susceptibility of diabetic patients to the development of other health problems and complications probably favors a larger doctor’s
appointments report from this group10. Regardless of the variable referring to the search for
a doctor’s appointment, the efect may be due to the bias inherent in cross-sectional studies in which simultaneous assessments of risk/protection factors and outcomes limit inferences about a causal relationship between variables.
An important limitation of the results refers to the diagnostic of self-reported DM. Although it is related to the occurrence of the disease, the proportion of individuals who are unaware of their disease may lead to an underestimation of the cases of diabetes found in the study population. Estimates indicate that, worldwide, 25–50% of individuals are
unaware of having the disease3. The accuracy of the reported morbidity varies depending
on the disease, its severity, sociodemographic and economic characteristics; however, despite the limitations, a diverse set of authors agree that the use of this methodology is growing worldwide owing to its practicality and low cost, as it is an important tool in health plan-ning13,36,37. The self-reported hypertension and hypercholesterolemia in this study may also be underestimated.
In Brazil, studies with national representativeness that investigate the prevalence of DM are limited. Because of this, the results of this study deserve to stand out, because in addi-tion to originating in a populaaddi-tion-based study, they have naaddi-tional representativeness. Due to the comprehensiveness of PDSD, dealing with a signiicant number of cases of diabetes was possible, and a wide range of variables could be associated with the occurrence of this disorder, conirming previous indings.
CONCLUSION
It is concluded that DM is a relevant health problem, which is associated with socioeco-nomic and demographic factors and other health conditions. Among the factors identiied, some are susceptible to intervention, highlighting the need for more incisive and efective public policies, focused specially on the modiication of living habits.
complications, as well as to the reduction of costs generated for the health system. The Strategic Action Plan for Tackling Chronic Noncommunicable Diseases (NCDs) in
Brazil, 2011–2022,38 which deines and prioritizes the actions and investments needed to
prepare the country to tackle and stop NCDs, highlights the need for actions aimed at promoting healthy living habits. Also, in this context, the National Food and Nutrition Safety Plan, the elaboration of the Food Guide for the Brazilian Population, the Health Gym Program, the Health in the School Program, as well as the free access to pharma-cological treatment of DM are important strategies in Brazil for the prevention of this disease and for tackling the current situation.
1. Guariguata L, Whiting DR, Hambleton I, Beagley J, Linnenkamp U, Shaw JE. Global estimates of diabetes prevalence for 2013 and projections for 2035. Diabetes Res Clin Pract 2014; 103(2): 137-49.
2. Beagley J, Guariguata L, Weil C, Motala AA. Global estimates of undiagnosed diabetes in adults. Diabetes Res Clin Pract 2014; 103(2):150-60.
3. International Diabetes Federation. IDF Diabetes Atlas. 6th ed. Bruxelas, Bélgica: International Diabetes Federation; 2013.
4. Shaw JE, Sicree RA, Zimmet PZ. Global estimates of the prevalence of diabetes for 2010 and 2030. Diabetes Res Clin Pract 2010; 87(1): 4-14.
5. Schmidt MI, Duncan BB, Silva GA, Menezes AM, Monteiro CA, Barreto SM, et al. Chronic non-communicable diseases in Brazil: burden and current challenges. The Lancet 2011; 377(9781):1949-61.
6. Moura EC, Pacheco-Santos LM, Peters LR, Serruya SJ, Guimarães R. Research on chronic noncommunicable diseases in Brazil: meeting the challenges of epidemiologic transition. Rev Panam Salud Publica 2012; 31(3): 240-5.
7. Rosa R, Nita ME, Rached R, Donato B, Rahal E. Estimated hospitalizations attributable to Diabetes Mellitus within the public healthcare system in Brazil from 2008 to 2010: study DIAPS 79. Rev Assoc Med Bras 2014; 60(3): 222-30.
8. Laguardia J, Campos MR, Travassos CM, Najar AL, Anjos LA, Vasconcellos MM. Psychometric evaluation of the SF-36 (v.2) questionnaire in a probability sample of Brazilian households: results of the survey Pesquisa Dimensões Sociais das Desigualdades (PDSD), Brazil, 2008. Health Qual Life Outcomes 2011; 9: 61.
9. Malerbi DA, Franco LJ. Multicenter study of the prevalence of diabetes mellitus and impaired glucose tolerance in the urban Brazilian population aged 30-69 yr. The Brazilian
Cooperative Group on the Study of Diabetes Prevalence. Diabetes Care 1992; 15(11): 1509-16.
10. Moraes SA, Freitas ICM, Gimeno SGA, Mondini L. Diabetes mellitus prevalence and associated factors in adults in Ribeirão Preto, São Paulo, Brazil, 2006: OBEDIARP Project. Cad Saúde Pública 2010; 26(5): 929-41.
11. Souza LJ, Chalita FEB, Reis AFF, Teixeira CL, Gicovate Neto C, Bastos DA, et al. Prevalence of diabetes mellitus and risk factors in Campos dos Goytacazes, RJ. Arq Bras Endocrinol Metab 2003; 47(1): 69-74.
12. Lyra R, Silva RS, Montenegro Jr RM, Matos MVC, Cézar NJB, Maurício-da-Silva L. Prevalence of diabetes and associated factors in an urban adult population of low educational level and income from the Brazilian Northeast wilderness. Arq Bras Endocrinol Metab 2010; 54(6): 560-6.
13. Iser BP, Malta DC, Duncan BB, de Moura L, Vigo A, Schmidt MI. Prevalence, correlates, and description of self-reported diabetes in brazilian capitals – results from a telephone survey. PLoS One 2014; 9(9): e108044.
14. Iser BPM, Stopa SR, Chueiri PS, Szwarcwald CL, Malta DC, Monteiro HOC, et al. Prevalência de diabetes autorreferido no Brasil: resultados da Pesquisa Nacional de Saúde 2013. Epidemiol Serv Saúde 2015; 24(2): 305-14.
15. Freitas LRS, Garcia LP. Evolution of prevalence of diabetes and associated hypertension in Brazil: analysis of National Household Sample Survey, 1998, 2003 and 2008. Epidemiol Serv Saúde 2012; 21(1): 07-19.
16. Rathmann W, Scheidt-Nave C, Roden M, Herder C. Type 2 diabetes: prevalence and relevance of genetic and acquired factors for its prediction. Dtsch Ärztebl Int 2013; 110(19): 331-7.
18. Passos VMA, Barreto SM, Diniz LM, Lima-Costa MF. Type 2 diabetes: prevalence and associated factors in a Brazilian community – the Bambuí health and aging study. Sao Paulo Med J 2005; 123(2): 66-71.
19. Fleischer NL, Diez Roux AV, Alazraqui M, Spinelli H. Social patterning of chronic disease risk factors in a Latin American city. J Urban Health 2008; 85(6): 923-37.
20. Phaswana-Mafuya N, Peltzer K, Chirinda W, Musekiwa A, Kose Z, Hoosain E, et al. Self-reported prevalence of chronic non-communicable diseases and associated factors among older adults in South Africa. Glob Health Action 2013; 6: 1-7.
21. Agardh E, Allebeck P, Hallqvist J, Moradi T, Sidorchuk A. Type 2 diabetes incidence and socio-economic position: a systematic review and meta-analysis. Int J Epidemiol 2011; 40(3): 804-18.
22. Lidfeldt J, Li TY, Hu FB, Manson JE, Kawachi I. A prospective study of childhood and adult socioeconomic status and incidence of type 2 diabetes in women. Am J Epidemiol 2007; 165(8): 882-9.
23. Smith BT, Lynch JW, Fox CS, Harper S, Abrahamowicz M, Almeida ND, et al. Life-course socioeconomic position and type 2 diabetes mellitus: The Framingham Ofspring Study. Am J Epidemiol 2011; 173(4): 438-47.
24. Mackenbach JP, Looman CW, van der Meer
JB. Differences in the misreporting of chronic conditions, by level of education: the effect on inequalities in prevalence rates. Am J Public Health 1996; 86(5): 706-11.
25. Francisco PMSB, Belon AP, Barros MBA, Carandina L, Alves MCGP, Goldbaum M, et al. Diabetes auto-referido em idosos: prevalência, fatores associados e práticas de controle. Cad Saúde Pública 2010; 26(1): 175-84.
26. Mendes TAB, Goldbaum M, Segri NJ, Barros MBA, Cesar CLG, Carandina L, et al. Diabetes mellitus: factors associated with prevalence in the elderly, control measures and practices, and health services utilization in São Paulo, Brazil. Cad Saúde Pública 2011; 27(6): 1233-43.
27. August KJ, Rook KS, Franks MM, Parris Stephens MA. Spouses’ involvement in their partners’ diabetes management: associations with spouse stress and perceived marital quality. J Fam Psychol 2013; 27(5): 712-21.
28. Bosi PL, Carvalho AM, Contrera D, Casale G, Pereira MA, Gronner MF, et al. Prevalência de diabetes melito e tolerância à glicose diminuída na população urbana de 30 a 79 anos da cidade de São Carlos, São Paulo. Arq Bras Endocrinol Metab 2009; 53(6): 726-32.
29. Flor LS, Campos MR, Oliveira AF, Schramm JMA. Diabetes burden in Brazil: fraction attributable to overweight, obesity, and excess weight. Rev Saúde Pública 2015; 49: 1-10.
30. Oliveira AF, Valente JG, Leite IC. Fraction of the global burden of diabetes mellitus attributable to overweight and obesity in Brazil. Rev Panam Salud Pública 2010; 27(5): 338-44.
31. Mayer-Davis EJ, D’Agostino R Jr, Karter AJ, Hafner SM, Rewers MJ, Saad M, et al. Intensity and amount of physical activity in relation to insulin sensitivity: the Insulin Resistance Atherosclerosis Study. JAMA 1998; 279(9): 669-74.
32. Helmrich SP, Ragland DR, Leung RW, Pafenbarger RS Jr. Physical activity and reduced occurrence of non-insulin-dependent diabetes mellitus. N Engl J Med 1991; 325(3): 147-52.
33. Borges TT, Rombaldi AJ, Knuth AG, Hallal PC. Knowledge on risk factors for chronic diseases: a population-based study. Cad Saúde Pública 2009; 25(7): 1511-20.
34. Viegas-Pereira APF, Rodrigues RN, Machado CJ. Fatores associados à prevalência de diabetes auto-referido entre idosos de Minas Gerais. Rev Bras Estud Popul 2008; 25(2): 365-76.
35. López-Jaramillo P, Sánchez RA, Díaz M, Cobos L, Bryce A, Parra-Carrillo JZ, et al. Latin American consensus on hypertension in patients with diabetes type 2 and metabolic syndrome. Arq Bras Endocrinol Metabol 2014; 58(3):205-25.
36. Okura Y, Urban LH, Mahoney DW, Jacobsen SJ, Rodeheffer RJ. Agreement between self-report questionnaires and medical record data was substantial for diabetes, hypertension, myocardial infarction and stroke but not for heart failure. J Clin Epidemiol 2004; 57(10): 1096-103.
37. Lima-Costa MF, Peixoto SV, Firmo JO, Uchoa E. Validity of self-reported diabetes and its determinants: evidences from the Bambuí study. Rev Saúde Pública 2007; 41(6): 947-53.
38. Brasil. Ministério da Saúde. Secretaria de Vigilância em Saúde. Departamento de Análise de Situação de Saúde. Plano de ações estratégicas para o enfrentamento das doenças crônicas não transmissíveis (DCNT) no Brasil 2011-2022. Serie B. Textos Básicos de Saúde. Brasília: Ministério da Saúde; 2011.
Received on: 02/29/2016