Article
J. Braz. Chem. Soc., Vol. 22, No. 3, 437-445, 2011. Printed in Brazil - ©2011 Sociedade Brasileira de Química
0103 - 5053 $6.00+0.00
A
*e-mail: [email protected]
Analysis of Volatiles in Fluid Inclusions by Direct online Crushing Mass
Spectrometry
Sandra Jorge,*,a Carlos E. S. Coelhoband Francisco Radler de Aquino-Netoa
aInstituto de Química, Universidade Federal do Rio de Janeiro, Av. Athos da Silveira Ramos, 149,
CT, Bloco A, Ilha do Fundão, 21914-909 Rio de Janeiro-RJ, Brazil
bResearch and Development Center, PETROBRAS, Rua Horácio Macedo, 950, Ilha do Fundão,
21914-909 Rio de Janeiro-RJ, Brazil
Uma nova ferramenta vem sendo cada vez mais utilizada em geoquímica orgânica. Trata-se da aplicação de inclusões luidas hospedadas em minerais, principalmente quartzo, de amostras de rocha recuperadas de poços exploratórios. Neste trabalho foi desenvolvido um método novo e prático na análise pontual de amostras de calha oriundas de diversas profundidades para identiicar a presença de petróleo em inclusões luidas de minerais siliciclásticos e carbonáticos. O método é chamado de detecção de inclusões de petróleo e permite analisar a presença de compostos voláteis em inclusões luidas através do esmagamento online dos grãos. Este método utiliza um sistema de injeção manual para amostras sólidas micro-scaled sealed vessel (MSSV). Além disso, é simples, relativamente rápido e apresenta uma boa reprodutibilidade. Para obter êxito nas análises torna-se essencial o controle cuidadoso dos procedimentos analíticos envolvidos, incluindo a limpeza das amostras e corridas de brancos no espectrômetro de massas. Os resultados foram comparados com procedimentos previamente propostos.
A new tool has been increasingly used in organic geochemistry; it is the application of luid inclusions hosted in minerals, mainly quartz, from rock samples recovered in basin wells. In this paper we develop a new practical screening method to identify the presence of petroleum in luid inclusions from siliciclastic and carbonatic minerals. The method is called detection of petroleum inclusions and allows analyzing the presence of volatiles in oil luid inclusions extracted by online crushing from cuttings samples. This method offers the advantage of working with solid samples, as a micro-scaled sealed vessel (MSSV) system. Moreover it is simple, relatively fast and presents a satisfactory reproducibility. For the successful analysis it is essential to carefully control the analytical procedures, including the cleaning of samples and blank runs. Results were compared with previously reported methods.
Keywords: luid inclusions, petroleum, mass spectrometry, hydrocarbons, quartz
Introduction
When a crystal grows in the presence of a luid phase, some of the luid may be trapped as imperfections in the growing crystal to form luid inclusions.1 In sedimentary
basins the inclusions are hosted in diagenetic cements and/or fractures cutting the grains. The composition of the trapped luid may include pure water, brines, gases (CO2, CH4), oil or a mixture of these phases. Most of the inclusions preserve their chemical and physical properties at the time they were formed, and thus they record the
composition, temperature and pressure of luids in the subsurface.2 For this reason, the oil luid inclusions are
commonly used in petroleum exploration. Analyses of oil in luid inclusions from dry wells samples provide a record of palaeo-oil migration3 and therefore is one of the techniques
used in petroleum exploration.4,5
samples has been employed to identify the presence of oil luid inclusions from samples recovered in basin wells.
Screening sample techniques
In the method described by Barclay et al.,6 and Parnell et al.,4 the volatiles are removed from the inclusions after
a pneumatic grain crushing and are dynamically pumped directly into the four quadrupoles, adjusted for different ranges of masses and ionized by electron bombardment (70 eV). The technique uses dozens or hundreds of samples from the same well and all the signals generated by the mass spectrometer are used to draw individual ion proiles. This technique is called luid inclusion stratigraphy (FIS)7 and can indicate transient oil migrations.8 The FIS
method does not involve a chromatographic separation of compounds before being analyzed in the mass spectrometer and only analyses the compounds of low molecular weight (C1-C12).
Another way of screening samples is observing oil luid inclusions in thin sections at a microscope under UV light because the liquid phase of the oil inclusions show luorescence due to the presence of aromatic molecules with more than 10 carbon atoms.1,9 The method GOITM
(grains-containing oil inclusions)10,11 is a petrographic
method, designated for analysis of sandstone samples, which measures the abundance of quartz and feldspar grains in a rock thin section containing oil-bearing luid inclusions, which are identiied by the use of UV light. The GOITM relates this measure to an empirical database
of GOI values to determine the extent of oil saturation.3
One of the problems associated with this technique is the time involved to prepare the thin sections and reading the same by UV light. Moreover, the technique does not allow obtaining data on the relative composition of compounds present in petroleum luid inclusions, and becomes totally ineffective in the case of gas luid inclusions, which have no luorescence under ultraviolet light.
In this paper we present a new screening sample method, called DIP (detection of petroleum inclusions) to analyze low molecular weight organic species from oils (C1-C12) in luid inclusions. The method involves a direct coupling of the injection unit (Figure 1) to the mass spectrometer (i.e., quadrupole analyser). Using for it restrictors in the system via a deactivated fused silica column, making a direct connection from the system to the ion source of the mass analyzer, resulting in a short analysis time for the characterization of volatile compounds. The method has the same principles developed by Sterner and Hall7 but has the advantage of using equipment available
in the market, being a low-cost method, highly sensitive,
reliable, relatively fast, simple, reproducible and selective for the analysis of compounds from complex matrices.
The analytical dificulty in the compositional analysis of oil luid inclusions in minerals involves three methodological issues that affect the inal result: (i) cleaning of the samples, (ii) extraction of the compounds from inclusions, and (iii) the analysis of these compounds. Therefore, before the samples are analyzed it is necessary to ensure a complete removal of all possible contaminants that could be present on the surface of the grains. In the literature it is possible to ind several scientiic papers describing cleaning procedures for rock samples.3,4,6,12-18 In the present study, we developed a
practical and eficient cleaning method to remove organic contaminants of the oil reservoir rocks.
Another analytical problem associated to the study in this area is the absence of certiied standards for oils in luid inclusions. However, some researchers have successfully produced in the laboratory synthetic hydrocarbons and aqueous inclusions.19,20 In this work we have developed and
reined our analysis through natural samples as reference standards.
Experimental
Standards and reagents
A 200 mg of natural quartz standard sample (Carollina-1), containing abundant petroleum inclusions, was acquired from Dr. Herbert Volk (CSIRO, North Ryde NSW, Australia). Three natural quartz samples (20 g each), recovered rock samples (A 4515m; B 4521m and C 4560m), with different populations of petroleum luid inclusions were obtained from Cenpes/Petrobras (Brazil). These samples were used as standards for control tests of the method.
Helium and nitrogen 99.999% were obtained from White Martins (Rio de Janeiro, Brazil). Alkaline detergent (Extran MA 01), sulfuric (95-97%) and nitric acids (70%) were obtained from Merck (Darmstadt, Germany). Potassium dichromate crystal reagent (99.9%) was purchased from JT Baker (Phillipsburg, USA). The universal pH-indicator strips (Merck, Darmstadt, Germany) were used to measure the pH of the solutions. A chromic acid solution was prepared by dissolving 40 g of potassium dichromate in 1000 mL of sulfuric acid. Polished glass slides thin sections for the analysis by microscope under UV-Vis light were prepared at Cenpes/Petrobras.
Instrumentation
with a Micro-scaled sealed vessel (MSSV) thermal analysis system (MSSV-2, GC2 Chromatography, Manchester, United Kingdom), that includes a stainless steel liner-frit (5 × 6 × 140 mm), effective volume 60 mg, a cryogenic trap illing with glass beads (1.5 × 3 × 111mm) andaDewar (100 mL) for liquid nitrogen. The trap outlet was connected to a deactivated silica capillary (10 m × 0.25 mm i.d., PN 160-2255-10, Agilent).
An ultrasonic bath (model 3510, Branson, Cleveland, USA) was used to clean samples. Mineral separation was performed using an isomagnetic separator (Frantz, model L-1, Pennsylvania, USA) to separate non-magnetic quartz, feldspar and calcite from paramagnetic materials such as shale. Grain-size fractions were separated by the use of stainless steel laboratory sieves (Tyler/mesh 16 and 250, Bertel Ltda, Caieiras, SP, Brazil).
In the sample preparation stage, a binocular lens (Carl Zeiss Microscopy, model CL 1500 ECO, Gottingen, Germany) was used to help in the removal of coal and shale fragments through manual picking these contaminants.
An Olympus microscope (AX 70, Tokyo, Japan), under UV-Vis excitation (365 nm), equipped with BP 330-385 nm band pass and BA420 barrier ilters and a 1000x air objective was used to identify the presence of hydrocarbons in oil luid inclusions. Photographed with a digital camera (Olympus, model Qcolor5, Tokyo, Japan) equipped with 50× and 100× objectives.
Description of the method
This is a destructive method for semi-quantitative analysis of low molecular weight (C1-C12) volatile compounds present in oil fluid inclusions using online crushing (crushing chamber with a detection system under vacuum) as the extraction method and a mass spectrometer as detector.
The deinition of the ionic species to be investigated by the method was based on the classes of compounds present in most low molecular weight hydrocarbon luid inclusions.6
The most abundant ion represents the compound within each class that was selected (Table 1).
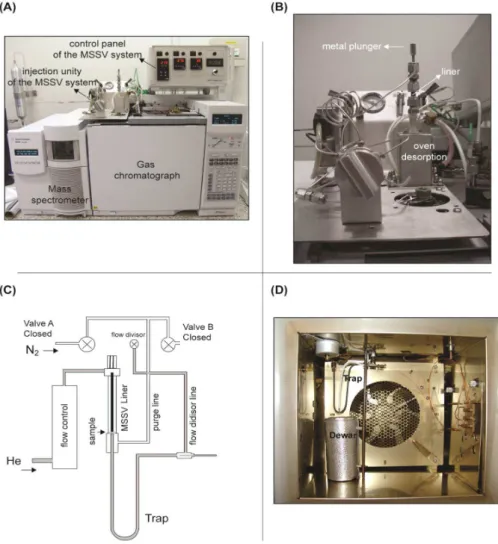
The MSSV/GC MS system (illustrated in Figure 1) utilizes a thermal analysis port (crushing chamber) as injection unit. The unit comprises a desorption oven assembled on the gas chromatograph connected to a short path interface in a direct heated cryogenic trap illed with glass beads. The interface has a purge line and a nitrogen back lush facility for cleaning debris from the system. The general process of the method involves a manual crushing of the sample in a stainless steel removable liner into the desorption oven (Figure 1B) using a metal plunger, where temperature is controlled from an external panel (MSSV-2, Figure 1A).
The volatiles released during crushing are trapped into a liquid nitrogen bath (Dewar), followed by heating and volatilization of the substances trapped (Figure 1D). The volatiles are swept by helium gas (without necessarily a chromatographic separation) to the mass spectrometer. The Schematic picture of the MSSV-2 (Figure 1C) illustrates the gas lines that comprise the system, that are helium and nitrogen. The helium low depends on the position of the B valve. When it is closed, the helium is used as carrier gas and when the valve is opened (to introduce the sample into the liner) it is used as purge gas for cleaning of the system through a purge line. The nitrogen low is controlled by the A valve. When it is opened the back lush removes the crushed material, e.g., powder left by the previous sample.
To run the method only 60 mg of cleaned sample are necessary. All the volatiles are released by hand crushing in the thermal analysis port (275 °C) and are condensed inside the cryogenic trap immersed in a Dewar illed with liquid nitrogen at −196 °C (Figure 1C). The oven was programmed from an initial temperature of 200 °C (isotherm for 2 min). After 1 min, the cryogenic trap is removed, followed by heating at −196 °C to 300 °C (1 min hold). After removal of the cryogenic trap the compounds are swept by means of a constant low of helium gas (99.999% purity) through a deactivated silica capillary (10 m × 0.25 mm i.d.) directly to the ion source of the mass spectrometer (electron energy
Table 1. Major chemical species constituents of low molecular weight compounds present in oil luid inclusions, as analyzed by the DIP method, modiied from Barclay et al.6
m/z Identiication Structure Description
15 +CH
3 (Methyl)
+CH 3
C1 fragment (+CH 3); largelymethane
57 +C
4H9 (Butyl)
Contribution of C4 fragments of higher
Parafin
60 CH3C + O•OH
(Monocarboxylic acid) Acetic acid
71 +C
5H11 (Pentyl)
Contribution of C5 fragments of higher
parafin
77 +C
6H5 (Phenyl)
Contribution of benzenoid species
78 +•C
6H6 Benzene
91 +C
7H7 (Benzyl)
Toluene; xylene; alkyl-benzenes
97 +C
7H13 (Alkyl cyclic)
70 eV; transfer line at 280 ºC, ion source at 250 oC), where
the generated ions are accelerated into the quadrupole (150 oC) and separated according to their mass/charge ratios
(m/z). The acquisition of the spectra is made by full-scan (4.10 scans s-1), in the range of m/z 10-180.
Cleaning sample procedure
The success of the chemical analysis of volatiles in oil luid inclusions depends on the eficiency of the cleaning process of the samples. Core samples should be gently broken into smaller particles (sand-sized) using a pestle and mortar. Special care should be given to cutting samples, which typically are more subject to contamination by drilling mud additives than core and sidewall samples. The aim is to concentrate the sample fraction of interest, e.g., the quartz and/or feldspar grains.
The cleaning procedure of the cutting samples involves four steps: (i) Pre-cleaning - a simple process to physically separate the grains by sieves of 16 and 250 mesh. This
particle size separation is important because the material passing through the 250 mesh sieve is very rich in silt and clay, and therefore with low percentages of luid inclusions. The material retained on sieves with number below 16 mesh, is unsuitable for doing MSSV/GC MS technique, because the grains exhibit more resistance to crushing in the liner. The best results have been obtained with grains in the range 16 to 250 mesh (i.e., grain size 63 to 1000 µm). (ii) Washing with alkaline detergent stage - the sample is placed into a beaker with detergent solution (dilute with water 1:3) and submitted to an ultrasonic bath (10-15 min); then the liquid waste is discarded and several rinses with running water are carried out until the complete removal of the soap. The sample is dried at room temperature (overnight). This stage helps in the removal of clay that could be still adhered to the surface of the grains; in addition the repeat rinses help to remove excess of loating materials, as a phyllosilicates. (iii) Magnetic separation and scavenging stage - a magnetic ield can be used to remove ferrous (iron oxide), magnetite, fragments
of weakly magnetic shale etc. The manual picking under a binocular lens helps in the removal of coal, and of course those contaminants that may still be present in the sample. (iv) Cleaning with chromic acid - the sample concentrated in the fraction of interest is now treated in a strong oxidant solution, providing a more rigorous cleaning of the sample, with removal of organic contaminants from drilling mud. The sample is placed into a beaker and the solution is added until the grains are completely covered and heated to 100 ºC for 1 h, stirring periodically with the aid of a glass rod. The sample is washed several times with water, and the pH of the inal rinse is measured (it should be neutral). To ensure the complete removal of the residual chromic acid it is advisable to wash the sample with a solution of nitric acid (1:1) and dry it in the oven (60 ºC) for 2 h.
The DIP method also applies to carbonates samples, but in this case the use of strong oxidants in the process of cleaning is not indicated, but the use of organic solvents. It is better to proceed with the step of pre-cleaning and then perform repeated washing with organic solvents (among others, dichloromethane:methanol, 93:7) using a soxhlet extractor for 72 h. 3,11 Faster extractions, such as accelerated
solvent extractor (ASE, from Dionex) can also be used.
Results and Discussion
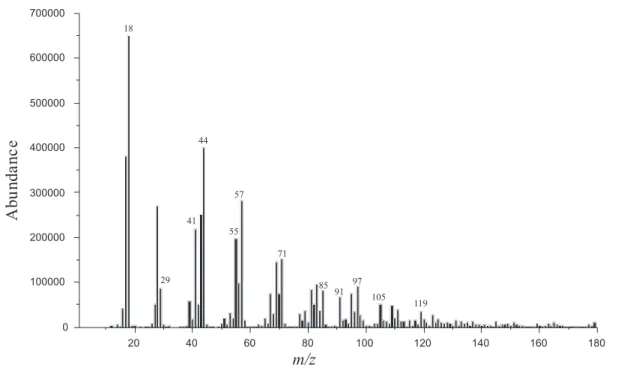
At the end of each processed run, mass spectra are generated in the range 10 to 180 Daltons (Figure 2).
The sample contains the alkane fragments (m/z 57) as one of the most abundant in the mass spectrum, except for
m/z 18 (H2O), followed by other fragments characteristic of alkanes (e.g., m/z 43, 71 and 85). The alkylated cyclic alkane compounds are also present in the sample (represented by the ions m/z 41, 55, 69, 83 and 97), as well as the aromatics (m/z 77, 78 and 91). A linear parafin pattern is suggested as m/z 57 is greater than m/z 71 and this is greater than m/z 85. The m/z 43, 57, 71 and 85 are indicative of alkyl ions generated from parafin or any linear or branched alkanes. The m/z 77, 91, 105 and 119 are indicative of alkyl-benzene compounds, while naphthalenes and methyl-naphthalenes are identiied by m/z 128 and 142, respectively.21 All these ions are
indicative of saturated and aromatic hydrocarbons from oils included in the minerals.
Analysis control
Before crushing the sample into the liner, it is important to make the run of the system blank with a sample (BLKSample) to have a control over the cleaning process of the samples and also ensure that there are no contaminants in the system. Therefore, the irst analysis to be performed is the blank run. If the signal recorded for the blank sample is satisfactory, then the next run could be done with the real sample (SReal) (real sample/ blank sample ratio 2:1, see Table 2), e.g., the grains being crushed inside the liner. At the end of this process, the system should be again adjusted to the next runs.
The method allows extracting mass spectra for all monitored ions in the range 10 to 180 Daltons. The
signal registered to the blank run of the standard sample Carollina-1 was considered suitable for all ions of interest (data not shown).
Cryogenic process (liquid nitrogen, at −196 ºC)
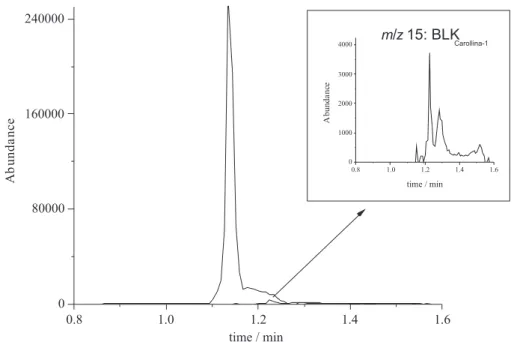
The cryogenic process is crucial in this type of approach. First, the sample needs to be crushed within the MSSV inlet, which cannot be done instantly. Another important aspect is that the compounds are very light, especially methane, which is not easily condensed, even at low temperatures (–161.60 ºC, boiling point at atmospheric pressure). It is necessary, therefore, that a irst stage of volatile compounds condensation by means of the cryogenic trap occurs, so the compounds can be transferred together into the capillary to the mass spectrometer. The methane present in the fluid inclusions was trapped during this procedure (Figure 3) due to condensation that occurs within the trap, supported by low temperature cooling (−196 ºC). In addition the methane molecules arrive at the ion source before the molecules from other hydrocarbon compounds allowing their identiication.
Processing the data obtained by the method
The millivolts responses provided by the mass analyzer for selected ionic species (Table 1) can be treated according to the area and/or height of the peak generated by the mass chromatograms (Figure 3). The integration of peaks is done
through an automated software (GDIF v1.0.2.0, in house made) designed to deal with all data obtained by the DIP method.
Use of natural samples as method control parameters
The three reservoir rock samples containing petroleum fluid inclusions (Figure 4) were used to check the measurements made by the mass analyzer through the DIP method. The samples have been investigated before by the method GOI (Grains containing Oil Inclusions) which assigned to them different abundance values of oil-bearing luid inclusions: sample A (16% GOI); B (13% GOI) and C (3% GOI). These experiments were performed by Cenpes/ Petrobras. In this case these samples were useful to input reference values to the analysis.
The reference samples were initially cleaned by the procedure described in this paper before being analyzed by the DIP method. After that, all the analysis, including blank runs and replicates (n = 3), were automatically processed by the software (GDIF v1.0.2.0). According to the results of the analysis the samples showed their volatile compounds present in different concentrations (Table 2). The chemical quantiication of the monitored species (e.g., m/z 57, 91 and 97) was made by integrating the peak height of the generated mass chromatograms. From this quantiication, it was possible to establish the reference values as control analytical parameters of the method. The method was adjusted attributing the SReal/BLKSample ratio ≥ 2:1
for all monitored ionic species. The sample C 4560m was the one that presented the lowest reference values (only some of the ions are presented in Table 2), conirming the data already obtained by the GOI method. This sample was useful to adjust the sensitivity of the equipment and showed the necessity of having rigorous control of the blank signal (BLK’s) in order to have SReal/BLKSample ratio over 2. In most cases, the value of the measured signal after crushing the sample (SReal) was higher than the measured signal of the correspondent blank (BLKSample), except for the sample 4560m, where the measured signals for the ion m/z 97 during the run did not satisfy the ratio SReal/BLKSample assigned (S4515m < 2:1) and suggests the absence of alkylated cyclic alkanes in this sample (or not detectable by the method).
The Reference Value 4560m (Table 2) for a particular ion was assigned according to the average of the measured values by the mass analyzer. Note that there is coherence between these “Values” and those obtained by the GOI method, i.e., the order of concentration for the samples is the same in both methods (Sample A > Sample B > Sample C). The DIP method offers adequate reproducibility despite variations in measurements, for example, the ion m/z 97 mean value (S4521m) is an order of magnitude more than the blank sample mean value (BLK4521m), i.e., SReal/BLKSample ratio was 10:1, while the RSD is 64.10%. One should keep
Figure 4. Photomicrographs showing petroleum inclusions in quartz grains. Excitation by UV light in the visible range. (a, c, e) Transmitted and UV light; (b, d, f) UV-luorescence only. (a, b) Sample A_4515m (20×; 60×, respectively); (c, d) sample B_4521m (20×; 20×, respectively); (e, f) sample C_4560m (20×; 60×, respectively).
in mind that all rock samples analyzed are heterogeneous in nature and in addition the differences in values (expressed by the relative standard deviation) should also be attributed to the procedure of collection of cutting samples (the drilling process causes a mixture between the fragments of the rock that is being drilled).
Application in an unknown sample
The method was tested with a rock sample (sandstone) recovered from 4020 m depth from a dry well. The sample (20 g) was cleaned and concentrated in the fraction of interest, i.e., quartz grains. An aliquot of 60 mg of the cleaned sample was analyzed by the DIP method. The identiication of the class of selected compounds (Table 1) was done through the mass spectrum and the ion quantiication by integration of the peak height in the mass chromatogram. The results were then compared with those obtained with reference samples (summarized in Table 2). For example, the values measured for the m/z 57 (parafin) and m/z 97 (alkylated cyclic alkanes) ions were 2.91×10⁵
and 9.49×10⁴, respectively (data were acquired for other
ions, but are not given here). Comparing these values to those from references (e.g., Sample A, m/z 57: 1.30×10⁵
and m/z 97: 3.61×10⁴) it is observed that the results in these
cases are even higher (over twice), indicating the presence of oil luid inclusions in the 4020m sample (Figure 5).
In order to conirm the presence of petroleum inclusions in this sample, an aliquot of 2 g (cleaned sample) was reserved to prepare the glass slides polished thin sections. This procedure was performed at Cenpes/Petrobras. The result of this analysis is presented in Figure 6, showing a luorescent liquid oil phase. The GOI value is 24%.
Conclusions
Sample A_4515m depth
Monitored ions
Runs m/z 57 m/z 91 m/z 97
S4515m BLK4515m S4515m BLK4515m S4515m BLK4515m
1 1.04×10⁵ 4.01×10³ 3.68×10⁴ 9.05×10³ 2.53×10⁴ 1.32×10³
2 1.32×10⁵ 5.96×10³ 4.13×10⁴ 7.32×10³ 4.07×10⁴ 1.96×10³
3 1.55×10⁵ 5.82×10³ 5.24×10⁴ 8.75×10³ 4.23×10⁴ 1.76×10³
Mean 1.30×10⁵ 5.26×10³ 4.35×10⁴ 8.37×10³ 3.61×10⁴ 1.68×10³
Relative Standard Deviation (%) 19.60 - 18.50 - 25.99
-Reference Value 4515m 1.30×10⁵ 4.35×10⁴ 3.61×10⁴
Sample B_4521m depth
Monitored ions
Runs m/z 57 m/z 91 m/z 97
S4521m BLK4521m S4521m BLK4521m S4521m BLK4521m
1 6.07×10⁴ 1.37×10⁴ 2.67×10⁴ 1.06×10⁴ 1.49×10⁴ 3.61×10³
2 7.78×10⁴ 3.67×10³ 2.71×10⁴ 7.75×10³ 2.11×10⁴ 2.39×10³
3 9.37×10⁴ 8.67×10² 4.28×10⁴ 1.27×10⁴ 4.91×10⁴ 1.74×10³
Mean 7.74×10⁴ 6.08×10³ 3.22×10⁴ 1.03×10⁴ 2.84×10⁴ 2.58×10³
Relative Standard Deviation (%) 21.27 - 28.65 - 64.10
-Reference Value 4521m 7.74×10⁴ 3.22×10⁴ 2.84×10⁴
Sample C_4560m depth
Monitored ions
Runs m/z 57 m/z 91 m/z 97
S4560m BLK4560m S4560m BLK4560m S4560m BLK4560m
1 1.45×10⁴ 3.91×10³ 2.58×10⁴ 5.17×10³ 6.27×10³ 2.52×10³
2 1.72×10⁴ 6.06×10³ 2.46×10⁴ 8.52×10³ 4.21×10³ 4.22×10³
3 1.54×10⁴ 4.37×10³ 2.02×10⁴ 6.40×10³ 5.02×10³ 2.62×10³
Mean 1.57×10⁴ 4.78×10³ 2.35×10⁴ 6.70×10³ 5.17×10³ 3.12×10³
Relative Standard Deviation (%) 8.63 - 12.57 - 19.99
-Reference Value 4560m 1.57×10⁴ 2.35×10⁴ 5.17×10³
BLKSample = blank sample and SReal = real sample; Real sample/blank sample ratio ≥ 2.
Table 2. Results of reference samples analyzed by the DIP method (n = 3). Measured values in relation to the mass chromatograms height
Figure 6. Photomicrograph under UV-Vis light excitation (365 nm) from the 4020m sample, highlighting the luorescing liquid oil inclusions (rounded vapor bubbles within the inclusions do not luoresce).
The method presented here differs from that used by other researchers for analyzing the presence of volatile luid inclusions. According to the control parameters proposed in the DIP method, it was possible to conirm the presence of oil luid inclusions in the studied sample. It is important to mention that the method is based on detection of ion
m/z 57 (parafin), m/z 15 (mostly methane) and m/z 97 (alkylated cyclic alkanes) to diagnose the presence of oil, because they are more abundant in oil luid inclusions. Aromatic fragmentations corroborate the presence of oil. It is basically designed to aid the exploration division of oil companies to obtain important information from dry wells, which are not supplied by conventional methods. The DIP method can be employed to screen petroleum compounds that are indicative of oil and/or gas/condensate in any interval of the well, therefore conirming that it was drilled in a migration pathway, providing the possibility of new exploratory interpretations for the area.
Acknowledgments
The authors acknowledge the Petróleo Brasileiro S.A. (Petrobras) for experimental support and are indebted to DSc. M. Zucchetti for petrographic analyses by the method GOI and DSc. D. A. Azevedo for revising the text of the manuscript and constructive suggestions that improved the paper considerably. The authors thank the CNPq, FAPERJ and FUJB.
References
1. Burruss, R. C.; Fluid Inclusions, Analysis and Interpretation;
Samson, I.; Anderson, A.; Marshall, D., eds.; Short Course 32, ch. 6, Mineralogical Association of Canada: Québec, Canada, 2003.
2. Peters, K. E.; Walters, C. C.; Moldowan, J. M.; The Biomarker Guide, 2nd ed., Cambridge University Press: Cambridge, 2005.
3. George, S. C.; Volk, H.; Ahmed, M.; J. Petrol. Sci. Eng. 2007,
57, 119.
4. Parnell, J.; Middleton, D.; Honghan, C.; Hall, D. L.; Mar. Pet. Geol. 2001, 18, 535.
5. Volk, H.; George, S. C.; Middleton, H.; Schoield, S.; Org. Geochem. 2005, 36, 29.
6. Barclay, S. A.; Worden, R. H.; Parnell, J.; Hall, D. L.; Sterner, S. M.; AAPG Bull. 2000, 84, 489.
7. Sterner, S. M.; Hall, D. L.; US pat. US2007169540 2007. 8. Liu, K.; Eadington, P. J.; Kennard, J. M.; Middleton, H. A.;
George, S. C.; Ahmed, M.; Cope, P.;In Proceedings of the Timor Sea Symposium, Darwin, Northern Territory, (19-20 June
2003, Timor Sea Petroleum Geoscience. Northern Territory Geological Survey, Special Publication); Ellis, G.K.; Baillie, P.W.; Munson, T.J., eds., vol. 1, pp. 333-351, 2004.
9. Burruss, R.C.; Luminescence Microscopy: Qualitative and Quantitative Applications, Barker, C.E.; Kopp, O., eds.; SEPM
Short Course 25: Tulsa, USA, 1991. DOI: 10.2110/scn.91.25.0001. 10. Eadington, P. J.; Lisk, M.; Krieger, F. W.; US pat 5,543,616 1996. 11. Lisk, M.; O’Brien, G. W.; Eadington, P. J.; AAPG Bull. 2002,
86, 1531.
12. Karlsen, D. A.; Nedkvitne, T.; Larter, S. R.; Bjørlykke, K.;
Geochim. Cosmochim. Acta 1993, 57, 3641.
13. George, S. C.; Krieger, F. W.; Eadington, P. J.; Quezada, R. A.; Greenwood, P. F.; Eisenberg, L. I.; Hamilton, P. J.; Wilson, M. A.; Org. Geochem. 1997, 26, 155.
14. George, S. C.; Lisk, M.; Summons, R. E.; Quezada, R.A.; Org. Geochem. 1998, 29, 631.
15. Jones, D. M.; Macleod, G.; Org. Geochem. 2000, 31, 1163. 16. George, S. C.; Ahmed, M.; Liu, K.; Volk, H.; Org. Geochem.
2004, 35, 1489.
17. George, S. C.; Lisk, M.; Eadington, P. J.; Mar. Pet. Geol. 2004,
21, 1107.
18. George, S. C.; Volk, H.; Dutkiewicz, A.; Ridley, J.; Buick, R.;
Geochim. Cosmochim. Acta 2008, 72, 844.
19. Pironon, J.; Bourdet, J.; Geochim. Cosmochim. Acta 2008, 72, 4916.
20. Chou, M.; Song, Y.; Burruss, R. C.; Geochim. Cosmochim. Acta
2008, 72, 5217.
21. McLafferty, F. W.; Turecek, F.; Interpretation of Mass Spectra, 4nd ed., University Science Books: Mill Valley, California, 1993.
Submitted: May 7, 2010