Article
Printed in Brazil - ©2016 Sociedade Brasileira de Química0103 - 5053 $6.00+0.00
*e-mail: [email protected]
Phosphate Modification of Nano Titania and Its Effect on the Photodegradation
of EDTA
Effat Iravani,* Sareh Ammari Allahyari and Meisam Torab-Mostaedi
Nuclear Science & Technology Research Institute, P.O. Box 11365-8486, Tehran, Iran
The surface of nano titania was phosphate modified and characterized by X-ray diffraction (XRD), attenuated total reflectance Fourier transform infrared spectroscopy (ATR-FTIR), energy dispersive X-ray analysis (EDX), and elemental analysis (CHN) to show the existence of phosphate in the modified nano titania. The resultant phosphated nano titania was applied for photocatalytic degradation of ethylenediaminetetraacetic acid disodium salt (EDTA) in aqueous solution. The crystallite size and crystalline phase showed no considerable change after modification, hence photocatalytic effect improvement of phosphate modified nano titania compared with the pure nano titania could be probably due to the existence of phosphate groups on the surface. The changes of the initial pH, photocatalyst dosage and EDTA concentration were tested in the degradation experiments. The pseudo-first-order kinetic model described the dynamic behavior for the photocatalytic degradation of EDTA using phosphate modified nano titania.
Keywords: photocatalytic degradation, phosphate modification, nano titania, EDTA, o-phosphorylethanolamine
Introduction
Ethylenediaminetetraacetic acid (EDTA) is mainly used as acid and sodium salt extensively, in several industrial and domestic applications like photo and paper industry. Using EDTA prevents sedimentation and tarnishing of metal surfaces and moreover intensifies the cleaning effect. Different products formulated to incorporate EDTA are distributed to a large number of outlets thus resulting in the disparate entry of EDTA in the aquatic environment.1
The total application volume of EDTA as an ingredient of household detergents, cosmetics, pharmaceutical and food is released via the household sewage without elimination in treatment plants. Unfortunately, volatilization from aqueous solution will not occur, due to its ionic properties and high solubility in water. The toxic effects of EDTA are considered to be related to metal deficiencies, especially a deficiency of zinc. It is well established that EDTA influences chromosome breakage by mutagenic agents, affects the inhibition of deoxyribonucleic acid (DNA) synthesis in primary cultures of mammalian cells and also leads to morphological changes of chromatin and chromosome structure in plant and animal cells.2 Removal
of EDTA is not possible by biological treatment processes,3
using chlorine is not always efficient,4 and retention of
the compound is hardly possible by activated carbon filters.5 Some advanced oxidation technologies for EDTA
degradation have been established like ozonation,6 UV
with different oxidants,7,8 radiolysis9 and other combined
techniques.8,10
The application of titania as a photocatalyst is limited due to its band gap of 3.2 eV.11 Several methods have
been applied to improve the photocatalytic efficiency of titania, which include various modifications. A considerably smaller number of studies were devoted to phosphate modification of nano titania. Colón et al.12
found that phosphoric acid treatment led to decreasing the photoactivity of titania comparing with other oxoacids like nitric and sulfuric acid, while increasing the photocatalytic efficiency of titania was shown by Yu et al.13 after phosphate
modification. It was reported also that titania was modified with some anions like sulfate, tungstate and phosphate and used as supports for several solid catalysts.14,15 It was shown
that post-treatment with phosphoric acid led to improve the thermal stability and acidity of mesoporous materials16,17
and zirconia.11
dosage, and initial concentration of EDTA) in terms of the highest degradation amount and lowest needed time.
Experimental
Materials
Nano titania, P-25 (TiO2), with a purity of 99.5% (80%
anatase, 20% rutile, 21 nm average particle size) was purchased from Evonik, Germany, and used as obtained for surface modification. o-Phosphorylethanolamine (OP)
was purchased from Merck, Germany, with a purity of 98% and purified through recrystallization from distilled water before using. Ethylenediaminetetraacetic acid disodium salt dihydrate (EDTA) was purchased from Aldrich (Sigma grade, USA) and used without further purification. Copper(II) sulfate (CuSO4.5H2O, ≥ 98%) and indicator
grade 1-(2 pyridylazo)-2-naphtol were obtained from Aldrich. Nitric acid (65%) and sodium hydroxide (99%) were purchased from Merck, Germany.
Methods
The sonication of the samples were performed with an Ultrawave sonicator (30 kHz). A calibrated Inolab pH meter was used to measure the pH of the samples. Thermal treatment was performed using Flli MANFREDI furnace. Attenuated total reflectance Fourier transform infrared (ATR-FTIR) spectra were recorded on a Bruker Tensor 27 ATR-FTIR spectrometer equipped with a ZnSe single crystal. The X-ray powder diffraction (XRD) patterns were recorded with a STOE STADI-MP diffractometer (40 kV, 30 mA) and equipped with a Cu Kα radiation source (λ = 1.5418 Å). Energy dispersive X-ray analysis (EDX) and elemental analysis (CHN) were performed on a REM CamScan-4DV and varioMICRO CHNS respectively. The amount of EDTA in the aqueous solution was determined titrimetrically against standard Cu2+ using 1-(2
pyridylazo)-2-naphtol as indicator.18 A Metrohm 765 Dosimat was used
to perform titration of the samples.
Modification of nano titania
Nano titania (TiO2) was reacted with o
-phosphoryl-ethanolamine (OP) according to our previous work19 as
follows. Nano titania was added in a round bottomed flask containing 50 mL of 0.01 mol L-1 of OP with a mole
ratio of TiO2/OP: 10/1 and stirred with a magnetic stirrer
for 24 h at ambient temperature. Afterwards the powders were filtered and washed with water and ethanol and then eluted in a Soxhlet extractor with water for 24 h. The
product was then dried in an oven at 120 °C for 24 h. The filtered powder (TiO2-OP) was washed with ethanol
and then calcined at 400 °C for 2 h with a heating rate of 10 °C min-1. The calcined sample was washed with
distilled water and ethanol, filtered, dried at 100 °C, labeled as P-TiO2 and was used as the photocatalyst in
the performed experiments.
Design of photoreactor
The photoreactor was a cuboid type, with dimensions of 45 × 8 × 10 cm containing two glass reaction vessels separated by a glass divider with a capacity of about 1000 mL (Figure S1). The photoreactor was equipped with a 15 W UV lamp with a length of 40 cm built into the quartz lamp housing. There were three ports for sampling, gas purging and outlet on the photoreactor cover for each vessel.
General procedure of the photocatalytic experiments
EDTA aqueous solutions with known concentrations between 250-1000 mg L-1 were prepared with distilled
water. The certain amount of photocatalyst powder (P-TiO2)
in the range of 0.125-0.75 g was added in 650 mL EDTA aqueous solution with the given concentration (P-TiO2
dosage in the range of about0.19-1.15 g L-1). When
needed, the pH of solution was adjusted using nitric acid or sodium hydroxide solutions. The final mixture was sonicated prior to irradiation for 10 minutes to disperse it well. The concentration of EDTA after sonication was determined titrimetrically and used for the next calculations as the initial concentration. Then the solution was put into the reaction vessel. The photocatalyst was continuously dispersed in the aqueous solution by a magnetic stirrer. The air was purged in the dispersed solution during the irradiation. The experimental conditions for optimization treatments (18 experiments) were shown in Supplementary Information section (Table S1).
Samples were taken periodically for analysis every hour. The degradation efficiency (d%) was calculated by applying equation 1:
(1)
where C0 and Ct are the initial and after t hours EDTA
Results and Discussion
Phosphate modification of TiO2
Surface modifier selection
Only a few studies have focused on photocatalytic activity of phosphate modified nano titania. Phosphate modification can be performed in situ or ex situ. In situ
modification can affect some parameters like particle size, crystalline phase or stability simultaneously.20 So it will
not be easy to focus just on the effect of phosphate groups on photocatalysis.
Phosphoric acid and different inorganic phosphates have been already used to modify nanoparticles. Depending on heating temperature and duration, phosphoric acid can dehydrate to form pyrophosphoric acid, metaphosphoric acid, or even polyphosphoric acids.21 The mentioned
heating products could be probably formed as various titanium phosphates in the presence of various titanium salts as precursors. Among different titanium phosphates, titanium pyrophosphate is UV reflective which is able to suppress the photocatalytic activity.22 That is why that
thermal treatment should be performed cautiously to avoid forming titanium pyrophosphate.
Raza et al.23 have prepared phosphonate modified
nano titania using organo phosphorus agent. Stability of the P−O−Ti bond against UV-irradiation was shown in this study, while the alkyl chain was degraded. It was assumed that a phosphate species was left on the surface after illumination.23
In this study, nano titania P-25 (Evonik) was modified
ex situ using OP. It has been already shown that using
long alkyl chain phosphates led to increase the van der Waals interactions between the alkyl chains, all-trans
conformation of the chains, increasing the packing density and therefore more surface OH groups are replaced with phosphate groups24 which is not favorable to photocatalysis
process (Figure S2). OP with chemical formula (OH)2(O)PO(CH2)2NH2 was chosen to modify TiO2 because
of possessing short alkyl chain in order to assemble into a less dense structure.
Characterization of P-TiO2
Non-bounded or weak-bounded OP and soluble titanium phosphate complexes were washed away in Soxhlet extraction, while the bounded OP remained on the surface of nano titania. According to the reported
13C-CP MAS NMR (cross-polarization magic angle
spinning carbon-13 nuclear magnetic resonance) of OP-TiO2 in our previous work, there was enough space for
the alkyl chain (−CH2CH2NH2) to be laid out parallel to the
surface making hydrogen bond.19 This could be a proof to
have a less dense structure. Accordingly it seemed to exist enough surface OH groups for photocatalysis.
Heating of OP-TiO2 at 400 °C for 2 h led to decompose
the organic rest and strengthen the interaction between the phosphate anions and the titanium sites. According to elemental analysis (CHN), the calcination product (P-TiO2) did not contain carbon or nitrogen any more, while
EDX analysis of P-TiO2 showed that the calcined sample
contained about 1.04 atom% or 0.67 wt.% phosphorus (Figure 1).
XRD spectra of pure TiO2 and the modified one before
and after thermal treatment were displayed in Figure 2. There were no peaks of the organic agent to be recognized in the spectrum of OP-TiO2. Surface functionalization in
such a low amount could not affect the internal lattice parameters of a solid, or generate any diffraction peak. The crystalline phase after phosphate modification was a mixture of anatase and rutile as the pure nano TiO2 with
no obvious change. The average crystallite size for P-TiO2,
estimated from the broadening of the diffraction peaks by Scherrer formula was about 24 nm, also just about 3 nm more than the original TiO2 (reported by the producer to be
about 21 nm). As expected, the crystallite size and phase of nano TiO2 could not be influenced considerably during ex
situ phosphate modification. No considerable anatase-rutile
transfer (ART) was observed after heating of OP-TiO2 at
400 and even 600 °C for 2 hours. It seemed that phosphate could have stabilized the anatase phase up to 600 °C. This type of effect has been also observed in sulfate25 and
phosphate26 on TiO
2 and α−Fe(O)OH, respectively.
Thermal treatment of OP-TiO2 at higher temperature
about 800 °C led to the formation of titanium pyrophosphate (TP) (Ref. code: 00-038-1468).
The evolution of ATR-FTIR spectra for phosphate modified nano titania before and after heating at 400 °C
(OP-TiO2 and P-TiO2, respectively) was shown in the
Figure 3. The broad peaks around 3400 and 1600 cm-1
corresponded to the surface-adsorbed water and free hydroxyl groups.27 For OP-TiO
2, there were two sharp
bands centered at 2933 and 2901 cm-1 related to symmetric
and asymmetric stretching vibration of −CH2− groups of
OP, which demonstrated the presence of organic material. The absence of these vibration bands in the spectrum of P-TiO2 suggested the removal of organic material after
heating. However, an absorption band around 1090 cm-1
(characteristic frequency of PO43−)28 appeared on the
shoulder of −Ti−O−Ti vibration band in the spectrum of P-TiO2, which revealed that phosphorus might have been
incorporated on the surface of nano titania. The result of EDX analysis also supported this finding.
Photocatalytic experiments
Effect of surface modification
EDTA (1000 mg L-1) was slowly degraded under UV
irradiation without any photocatalyst and the maximum
amount of degradation was less than 40%. Degradations under UV irradiation, in the presence of TiO2 or P-TiO2
as photocatalysts (0.5 g, 0.77 g L-1) and at natural pH
of about 5.5 were performed much faster. Using P-TiO2
showed about twice more degradation of EDTA comparing to TiO2 (Figure S3). This meant that surface modification
led to more degradation of EDTA under the same normal condition without any optimization. The maximum amount of degradation and the needed time were compared in Figure S4.
Effect of initial pH
In order to check the pH changes, degradation of 650 mL EDTA (1000 mg L-1) in the presence of P-TiO
2
(0.5 g, 0.77 g L-1) was performed first without adjusting
the initial pH under UV irradiation. pH of the solution was measured periodically every hour. According to the results shown in Figure S6, pH of the solution was increased during the photocatalytic reaction from the initial pH (about 5.5) to about 9, which could be probably a sign of producing basic intermediates.
The effect of the initial pH was investigated in the present study in the range of 4-9. Both kinetic and efficiency of degradation were decreased with pH increasing.
Accordingly acidic pH were more suitable for photocatalytic degradation of EDTA (Figure S7). An increase of pH about 1 unit led to decrease of achievable degradation level and increase the time needed. This observation was more considerable in basic range of pH. Adjusting the initial pH of the solution about 4 (the optimized amount) led to about 30-50% less time and 12-16% more degradation efficiency of EDTA.
Generally in the pH range 3-8, the EDTA chemical species and its metal complexes are anion in the solution,29
Figure 2. (a) XRD spectra of pure TiO2; (b) OP-TiO2 before heating; and after heating at 400, 600, 800 °C (c, d, and e, respectively).
therefore the adsorption on the surface could be probably performed in acidic pH better. To investigate this point, the dependence of EDTA adsorption (650 mL, 1000 mg L-1) on
the pH of the solution (in the range of 3-9) in the presence of P-TiO2 (0.5 g) was studied (Figure S5). According to
the results, EDTA adsorption on the P-TiO2 was faster at
the acidic pHs compared with the basic pHs. It means, the fast kinetic of EDTA degradation using P-TiO2 under UV
irradiation in the acidic pH compared with the neutral or basic pHs could be due to the increased EDTA adsorption.
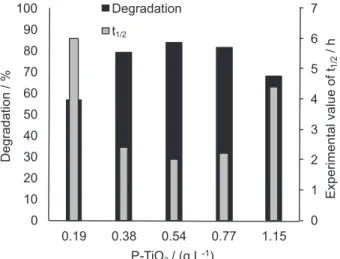
Effect of photocatalyst dosage
Four experiments were established at optimized pH 4 by using P-TiO2 with concentrations 0.19, 0.38, 0.77
and 1.15 g L-1 to degrade EDTA solution (1000 mg g-1).
Increasing of the photocatalyst concentration to 1.15 g L-1 had
a negative effect on degradation efficiency compared with 0.38 and 0.77 g L-1. Increased light scattering and consequent
reduction in light penetration through the solution could be mentioned as the reason (the effect of light masking by suspended excess catalyst particles).30 Increasing the amount
of photocatalyst from 0.38 to 0.77 g L-1 caused just about
2.24% more efficiency, which did not satisfy using twice more photocatalyst. To investigate this point more precisely, the experiment was repeated under the same condition using 0.54 g L-1 photocatalyst. Degradation efficiency increased
with increase the amount of photocatalyst from 0.38 to 0.54 g L-1 and then decreased from 0.54 to 0.77 g L-1.
Degradation efficiency and approximately needed time (experimental value) to degrade 50% of EDTA using three amounts of photocatalyst (0.38, 0.54, 0.77 g L-1) showed no
considerable difference. According to the results showed in Figure 4, 0.38 g L-1 was reported as the optimized amount
of P-TiO2 to obtain the highest degradation efficiency and
lowest half-life time.
Effect of EDTA concentration
Optimized amount of P-TiO2 (0.35 g, 0.38 g L-1) was
added to EDTA solutions at different initial concentrations ranging 250-1000 mg L-1 at optimized pH 4 and the
resulted suspensions were irradiated under UV light. The normalized concentration profiles of EDTA revealed that the degradation was faster and the total conversion took place in less time, when the EDTA concentration was lower (Figure S8). ln C was plotted versus time for various initial
EDTA concentrations and shown in Figure S9.
The approximately linear decrease in the logarithm of the EDTA concentration with irradiation time was consistent with the pseudo first order kinetic expression (linear form) shown by equations 2 and 3:
(2)
(3)
The apparent rate constants (k) obtained from the least squares analyses (Figure S9) were decreased with increasing EDTA concentration (Table 1).
Langmuir-Hinshelwood kinetic is the most commonly used kinetic model for heterogeneous catalytic processes during the photodegradation of many organic contaminants in solution.31-34 Application of this model to an ideal batch
reactor produces equation 4:35
(4)
where C represents the solute concentration (mg L-1), K r
and Ka are constants related to the reaction rate (min-1) and
adsorption coefficient (L mg-1), respectively, and ΣK iCi
is absorption term for all organic intermediate products. Considering t = 0, C = C0 and the term for intermediate
organic products ΣKiCi = 0, then the equation 4 reduces to expression:
(5)
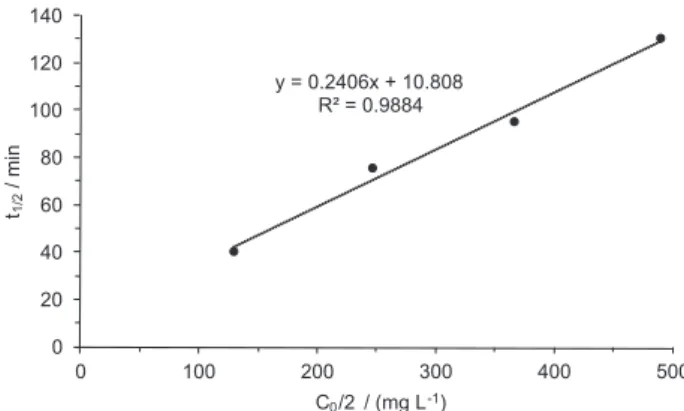
The integral of equation 4 at C = C0/2 yields:
(6)
Considering the pseudo first order kinetic according to equation 3, the half-life time of EDTA degradation for initial concentrations were calculated from least square
Figure 4. The effect of photocatalytic dosage on maximum amount of
analysis. If the rate of EDTA photocatalytic degradation follows the Langmuir isotherm equation model, plotting half-life time against C0/2 according to equation 6
should yield a straight line with slope Ka/Kr and intercept
0.693/Kr. The plot is linear (Figure 5), meaning that the
reaction occurred on the surface. The values of Ka and Kr
are 0.0154 L mg-1 and 0.0641 min-1, respectively.
Table 1 also showed the experimental and calculated t1/2
values obtained when C/C0 = 1/2. The deviation between
the experimental and calculated t1/2 is greatest at higher
EDTA concentrations, which could be ascribed to the induction period necessary to obtain equilibrium.36 The
rates constants were 0.017, 0.009, 0.007, and 0.005 min-1
in ascending concentration order, respectively.
The effect of surface modification with phosphate on photocatalysis
There were no considerable changes in crystallite size and phase after in situ phosphate modification of TiO2
indicating that the improvement of photocatalytic activity of P-TiO2 can be attributed to the surface-bound phosphate
anions. It has been already reported that the point of zero zeta potential of the nano titania particles are shifted to lower pH value in the presence of phosphate anion which indicates the accumulation of negative charges on the surface of nano titania.37 It seems, a negative electrostatic field could be
formed in the surface layer of the nano titania due to the existence of negatively charged phosphate anions. During
the photocatalysis process, the separation of electrons and holes could be promoted by this negative electrostatic field and as a result the charge recombination on phosphate modified nano titania is suppressed compared with the pure nano titania. When modified nano titania is irradiated by UV, electron is excited from valance band to the conduction band leaving a positive hole in the valence band. Another positive effect of the negative electrostatic field could be probably to draw the positive hole to the interface. Strong interactions can be formed between phosphate and H2O through hydrogen bonding. Phosphate, known
as a good anchor group, can accomplish efficient electron transfer between the nano titania and chromophore in the photoelectron cell.38,39 Apparently phosphate modification
of the surface can promote the charge transfer between the hole and H2O to form free hydroxyl radical. In addition,
the replacement of the adsorbed hydroxyl groups on the surface by phosphate anions can also inhibit the formation of surface-adsorbed hydroxyl radical. However it seems that the positive effects (inhibition of the charge recombination, drawing the holes to the interface and promotion of free hydroxyl radicals via facilitation of charge transfer between holes and H2O) play more important role than the negative
effect of replacement of some surface hydroxyl groups by phosphate anion (Figure 6). It should also be noted that the transfer of conduction band electron can also be possibly influenced by the phosphate modification.
Table 1. Pseudo-first order rate constants and t1/2 values (experimental and calculated) for different initial concentrations of EDTA
Concentrationa / (mg L-1) kb / min-1 Rb Calculatedc t
1/2 / min Experimental t1/2 / min Initial reaction rated / (mg L-1 min-1)
250 0.017 0.989 40 42 3.33
500 0.009 0.9916 75 81 3.67
750 0.007 0.9938 95 101 3.82
1000 0.005 0.9946 130 139 3.90
aTitrimetrically determined concentrations after 10 minutes sonication were used as the initial concentrations; b,c,dcalculated using equations 3, 6 and 5,
respectively.
Figure 6. Schematic illustration of photo-generation of charge carriers in
P-TiO2. Phosphate modification of the TiO2 surface leads to inhibition of
charge recombination, draws the holes to the interface and promotes free hydroxyl radicals generation via facilitation of charge transfer between holes and H2O.
Figure 5. The plot of t1/2 vs. C0/2 values for different initial concentrations
Phosphate modification of the TiO2 surface leads to
inhibition of charge recombination, draws the holes to the interface and promotes free hydroxyl radicals generation via facilitation of charge transfer between holes and H2O.
Conclusions
Surface modification of TiO2 was performed with OP.
After calcination at 400 °C for 2 hours, the organic rest was removed according to the result of CHN, ATR-FTIR analyses and phosphate groups remained on the surface of nano titania. The photocatalytic activity of the modified nano titania was investigated on the degradation of EDTA in aqueous solution. Both efficiency and kinetic of EDTA degradation showed considerable performance in acidic pH probably due to better EDTA adsorption. The rate of photocatalytic degradation of EDTA approximated pseudo-first-order kinetics. The optimum amount of photocatalyst was 0.35 g (0.38 g L-1) to degrade 650 mL
EDTA 1000 mg L-1. The reaction rate constant decreased
as the EDTA concentration increased from 250 to 1000 mg L-1. The presence of phosphate groups on the nano
titania surface was seemed to be sufficient to prevent matter transport delaying, inhibition of charge recombination, drawing the holes to the interface and the promotion of free hydroxyl radicals via facilitation of charge transfer between holes and H2O. According to the proposed mechanism, both
the surface hole and the free hydroxyl radical generation might be enhanced after the phosphate modification.
Supplementary Information
Supplementary data (photoreactor design and the effects of some parameters on the EDTA degradation in form of Excel graphs) are available free of charge at http://jbcs.sbq.org.br as PDF file.
Acknowledgments
The authors are grateful to Leila Irannejad for great technical support.
References
1. EDETIC ACID; Summary Risk Assessment Report; Institute for Health and Consumer Protection; European Chemicals Bureau, 2004, p. 7.
2. Heindorff, K.; Aurich, O.; Michaelis, A.; Rieger, R.; Mutat. Res.1983, 115,149.
3. Hinck, M. L.; Ferguson, J.; Puhaakka, J.; Water Sci. Technol.
1997, 35, 25.
4. Brauch, H. J.; Schullerer, S.; Vom Wasser1987, 69, 155. 5. Schullerer, S.; Brauch, H. J.; Vom Wasser1989, 72, 23. 6. Korhonen, M. S.; Metsarinne, S. E.; Tuhkanen, T. A.; Ozone:
Sci. Eng. 2000, 22, 279.
7. Tucker, M. D.; Barton, L. L.; Thomson, B. M.; Wagener, B. M.; Aragon, A.; Waste Manage. 1999, 19, 477.
8. Rodriguez, J.; Mutis, A.; Yeber, M. C.; Freer, J.; Baeza, J.; Mansilla, H. D.; Water Sci. Technol. 1999, 40, 267.
9. Krapfenbauer, K.; Getoff, N.; Radiat. Phys. Chem. 1999, 55, 385.
10. Kagaya, S.; Bitoh, Y.; Hasegawa, K.; Chem. Lett. 1997, 2, 155. 11. Goswami, P.; Nath Ganguli, J.; Bull. Mater. Sci. 2012, 35,
889.
12. Colón, G.; Sánchez-Espana, J. M.; Hidalgo, M. C.; Navío, J. A.; J. Photochem. Photobiol., A2006, 179, 20.
13. Yu, J. C.; Zhang, L.; Zhang, Z.; Zhao, J.; Chem. Mater.2003,
15, 2280.
14. Hino, M.; Arata, K. J.; J. Chem. Soc., Chem. Commun. 1980,
851.
15. Larsen, G.; Loreto, F.; Nasity, M.; Petkovu, L. M.; Shobe,D. S.; J. Catal. 1996, 164, 246.
16. Ciesla, U.; Schacht, S.; Stucky, G. D.; Unger, K. K.; Schuth, F.; Angew. Chem., Int. Ed. Engl.1996, 35, 541.
17. Chen, H. R.; Shi, J. I.; Hua, Z. H. I.; Yuan, L. I.; Yan, D. S.; Mater. Lett. 2001, 51, 187.
18. D1767-89: Standard Test Method for Ethylen Diamine Tetraacetate (EDTA) in Soaps or Synthetic Detergents, 2003. 19. Iravani, E.; Allahyari, S. A.; Shojaei, Z.; Torab-Mostaedi, M.;
J. Braz. Chem. Soc.2015, 26, 1608.
20. Zhao, D.; Chen, C.; Wang, Y.; Li, H.; Ma, W.; Zang, L.; Zhao, J.; J. Phys. Chem. C 2008, 112,5993.
21. Holleman, F.; Wieberg, E.; Wieberg, N.; Lehrbuch der Anorganischen Chemie,101st ed.; de Gruyter: Berlin, New York, 1995.
22. Onoda, H.; Yamaguchi, T.; Toyama, T.; Phosphorus Res. Bull.
2013, 28, 1.
23. Raza, M.; Bachinger, A.; Zahn, N.; Kickelbick, G.; Materials
2014, 7, 2890.
24. Pori, D. M.; Venkataraman, N. V.; Tosatti, S. G. P.; Durmaz, F.; Spencer, N. D.; Zuercher, S.; Langmuir2007, 23, 8053. 25. Zhao, B. Y.; Xu, X. P.; Ma, H. R.; Gao, J. M.; Sun, D. H.; Wang,
R. R.; Tang, Y. A. N.; Acta Phys.-Chim. Sin. 1993, 9, 8. 26. Kandori, K.; Uchida, S.; Kataoka, S.; Ishikawa, T. J.; Mater.
Sci. 1992, 27, 719.
27. Ding, Z.; Lu, G. O.; Greenfield, P. F.; J. Phys. Chem. B 2000, 104, 4815.
28. Bhaumik, A.; Inagaki, S.; J. Am. Chem. Soc. 2001, 123, 691. 29. Sugiyama, T.; Dabwan, A. H. A.; Katsumata, H.; Suzuki, T.;
Kaneco, S.; Open J. Inorg. Non-Met. Mater. 2014, 4, 28. 30. Parra, S.; Stanca, S. E.; Guasaquillo, I.; Ravindranathan Thampi,
31. Kabra, K.; Chaudhary, R.; Sawhney, R. L.; Ind. Eng. Chem. Res. 2004, 43, 7683.
32. Moctezuma, E.; González, R.; Zamarripa, H.; Palestino, G.; Oros, S.; J. Environ. Eng. Manage.2006, 16, 343.
33. Dalrymple, O.; Yeh, D.; Trotz, M. J.; J. Chem. Technol. Biotechnol. 2007, 82, 121.
34. Leyva, E.; Montalvo, C.; Moctezuma, E.; Leyva, S.; J. Ceram. Process. Res. 2008, 9, 455.
35. Aguilar, C. A.; Montalvo, C.; Ceron, J. G.; Moctezuma, E.; Int. J. Environ. Res. 2011, 5, 1071.
36. Matthews, R. W.; J. Catal.1988, 111, 264.
37. Nelson, B. P.; Candal, R.; Corn, R. M.; Anderson, M. A.; Langmuir2000, 16, 6094.
38. Bae, E.; Choi, W.; Park, J.; Shin, H. S.; Kim, S. B.; Lee, J. S.; J. Phys. Chem. B2004, 108, 14093.
39. Ernstorfer, R.; Gundlach, L.; Felber, S.; Storck, W.; Eichberger, R.; Willig, F.; J. Phys. Chem. B2006, 110, 25383.
Submitted: September 30, 2015