Article
0103 - 5053 $6.00+0.00*e-mail: [email protected]
Solid Phase Microextraction as an Eficient Method for Characterization of the
Interaction of Pesticides with Different Soil Types
Rada D. Ðurović,*,a Jelena S. Gajić Umiljendić,a Svjetlana B. Cupaćb and Ljubiša M. Ignjatovićc
aInstitute of Pesticides and Environmental Protection, Banatska 31b, 11080 Belgrade, Serbia
bFaculty of Agriculture, University of Belgrade, Nemanjina 6, 11080 Belgrade, Serbia
cFaculty of Physical Chemistry, University of Belgrade, Studentski trg 16, 11000 Belgrade, Serbia
Foi desenvolvido um método de microextração em fase sólida (SPME) para determinação simultânea de 20 pesticidas, pertencentes a vários grupos, em amostras de solo. Foram investigadas condições de extração como tipo de ibra, temperatura e tempo de dessorção, tempo de extração e teor de NaCl. A detecção e quantiicação foram realizadas por cromatograia gasosa acoplada a espectrometria de massas (CG-MS). Os resultados indicam que a maioria dos pesticidas estudados foram mais fortemente sorvidos por solos com maior teor de matéria orgânica ou argila. Os valores de desvio padrão relativo (DPR) para análises múltiplas de amostras de solo fortiicadas com 30 μg kg-1 de cada pesticida icaram abaixo de 19%. Os limites de detecção (LD) para todos os
compostos estudados foram menores do que 5 μg kg-1.
A solid phase microextraction (SPME) method for simultaneous determination of 20 pesticides belonging to various pesticide groups in soil samples was developed. Extraction conditions, such as ibre type, desorption temperature and time, extraction time and NaCl content were investigated. Detection and quantiication were done by gas chromatography-mass spectrometry (GC-MS). The results indicate that most of the studied pesticides were more strongly sorbed by soil that has higher organic matter and/or clay content. Relative standard deviation (RSD) values for multiple analysis of soil samples fortiied at 30 μg kg-1 of each pesticide were below 19%. Limits of detection (LOD)
for all the compounds studied were less than 5 μg kg-1.
Keywords: solid phase microextraction, pesticides, soil, multiresidue method
Introduction
Soil contamination is a global environmental pollution problem. One of the major soil contaminants are pesticides and their degradation products, which could cause serious problems for crops, soil organisms and humans.
Extraction is the most time-consuming and dificult segment of chemical analysis of these compounds in complex sample matrices like soil. Generally, routine procedures such as liquid-liquid extraction (LLE), soxhlet extraction and solid phase extraction (SPE) are time-consuming, tedious, require large quantities of organic solvents and are often relatively expensive. Therefore, recent trends in sample preparation have focused on a development of simpler, faster, more reliable and cost-eficient methods by reducing analysis time and solvent
consumption. Solid phase microextraction (SPME), as a technique which combines extraction and concentration processes into one step, is the example of such development. SPME is a simple, selective and eficient sorption/ desorption method, based on the analytes’ distibution between the sample matrix and extraction medium. Extraction is performed in a thin polymer ilm coating of a fused silica ibre, which is either immersed in a sample (DM-SPME) or exposed to a headspace above the sample (HS-SPME). After extraction, the ibre carrying sorbed analytes is introduced into a gas chromatograph injector for thermal desorption (GC), while in the case of liquid chromatography (LC) the analytes are desorbed by solvent elution.
slurry1 or its exposing to a gas phase above the slurry.2-7
Some researchers have suggested that DM-SPME of a soil organic extract obtained by solid-liquid extraction diluted with appropriate amount of water is the most
reliable soil SPME method.8-10 Their results indicate that
this approach is more sensitive and provides both higher recoveries and better linearity. Most of these proposed methods, however, focus on simultaneous determination of pesticides belonging to only one or two pesticide groups. To our knowledge, there is actually only one report on SPME determination of pesticides that belong to several pesticide groups (chloroacetanilide, pyrethroid, organochlorine and
organophosphorus compounds).7 This method is based on
headspace analysis of soil samples wetted with ultrapure water (50%, m/v).
As no previous studies are known to us dealing with the DM-SPME determination of pesticides of different pesticide groups, the aim of this study was to develop a rapid and simple DM-SPME multiresidue method for simultaneous determination of 20 compounds having distinct chemical structures and belonging to different pesticide groups. The main parameters affecting DM-SPME procedure, such as the ibre type, temperature and time of desorption, extraction time and NaCl content, as well as the extraction eficiencies of several solvents (water, hexane, acetonitrile, acetone and methanol) and the optimum number of extraction steps within the sample preparation step were investigated and optimized. Additionally, the proposed method was used to determinate the several selected pesticides in different soil types in order to examine whether, why and to what extent different soil properties are able to effect SPME eficiency.
Experimental
Reagents and materials
Pesticides chosen for this study were: clomazone, acetochlor, pendimethalin, oxyfluorfen, prometryn, fenitrothion, chlorpyrifos, lindane, (Dr Ehrenstorfer); dimethenamid, chloridazon (BASF); phorate (City Chemical Corporation); simazine (Ciba-Geigy); atrazine (Syngenta); luorochloridone (Chimac Agriphar S.A.); tebupirimfos, metribuzin, tebuconazole (Bayer); terbufos (Counter); chlorothalonil (Pestanal) and prochloraz
(Aventis) (Table 1). Stock solutions (1 g L-1) of each
pesticide standard were prepared by dissolving the weighed amount in acetone (J. T. Baker, Deventer, Holland), except dimethenamid which was dissolved in ethanol (J. T. Baker,
Deventer, Holland). The solutions were stored at −18 °C.
Working standard mixed solutions (10 mg L-1 and 1 mg L-1
of each compound) were prepared weakly by diluting the individual stock solution with acetone and storing at
4 °C. Water standard solutions (25 μg L-1) were used for
optimizing the SPME method. Highly puriied deionized water (Purelab Option-R7, Elga, UK) was used to dilute the mixed acetone solutions. Sodium chloride (99.5% purity) was purchased from Merck (Darmstadt, Germany) and hexane, acetonitrile and methanol from J. T. Baker (Deventer, Holland).
The fibres used (Supelco, Bellefonte, PA, USA) were: 100 μm polydimethyl-siloxane (PDMS) and 85 μm polyacrilate (PA). Before use, the ibre was conditioned in a gas chromatograph injection port as recommended by the manufacturer. A magnetic stirrer (Roth RCT Basic, Germany) and 8×3 mm stirring bars were used to mix the samples during extraction. Extraction was performed in 4 mL vials (Supelco).
Three samples of uncontaminated Serbian soils
originating from Kosjerić (soil A), Kikinda (soil B) and Bela
Palanka (soil C) were used in the study. The main physico-chemical properties of these soils are given in Table 2. The soils were air dried and sieved (2 mm) before using.
Polypropylene centrifuge tubes with caps (50 mL) (Sarstedt, Germany), ilter papers 1PS, 150 mm diameter (Watman Int. Ltd., Maidstone, UK) and a centrifuge (UZ 4, Iskra, Slovenia) were used in the soil extraction procedure.
Instrumentation
A gas chromatograph-mass spectrometer (GC-MS) was used as a detection device (CP-3800/Saturn 2200, Varian, Australia). A 30 m × 0.25 mm × 0.25 μm, VF-5ms column (Varian) was used. The GC was programmed as follows: initial temperature was 120 °C, then increased to 170 °C
at 8 °C min-1 and held for 4.5 min, increased to 280 °C at
9 °C min-1 and held for 5.5 min. Helium was used as the
carrier gas and its low rate was 1.1 mL min-1.
The ion trap mass spectrometer was operated in the electron impact/selected ion monitoring (EI/SIM) mode. The ion trap and transferline temperatures were set to
220 and 250 °C, respectively. Onespeciic pesticide ion
was selected for detection and quantiication, while a second one was used for conirmation. The ions inspected are presented in Table 1.
Optimization of DM-SPME analysis
DM-SPME conditions, such as the ibre type, desorption temperature and time, extraction time and NaCl content, were investigated and optimized using 4 mL of aqueous
In order to determine optimum desorption temperature and time, half-hour extraction procedures were performed at ambient temperature. In the irst set of experiments, desorption temperature was varied from 265 to 285 °C with desorption time of 5 min. After that, desorption time was varied from 5 to 9 min at the chosen optimal desorption temperature.
In order to determine optimum extraction time and NaCl content, we also determined the effect of microextraction
time from 10 to 60 min, i.e. the effect of NaCl content from
0 to 15% (m/v) on the eficiency of SPME.
The following SPME conditions were found to be the most eficient for simultaneous extraction of the selected
pesticides: 100 μm PDMS ibre, desorption for 7 min at 270 °C, extraction time of 30 min, 5% NaCl content (m/v).
Soil extraction optimization
Efficiency of the method optimized for SPME of aqueous solutions was tested in the analysis of soil samples. In this part of the study, sub-samples of 8 g (soil B) were placed in polypropylene centrifuge tubes and fortiied at 30 μg kg-1 level of each pesticide using 1 mg L-1 mixed
standard solution. The spiked samples were homogenized for 15 min using a rotary stirrer and left to rest for 24 h prior to further analysis.
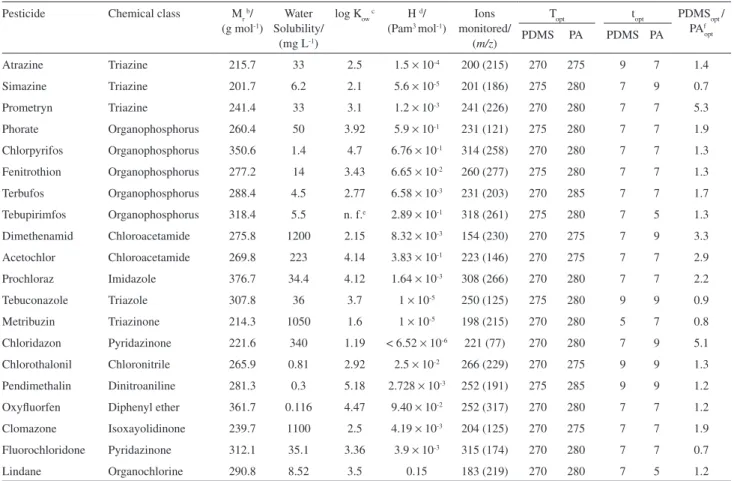
Table 1. Physico-chemical properties of pesticides studied,a their characteristic quantitative (qualitative) m/z ions and optimal desorption temperatures
(Topt) and times (topt) for PDMS and PA ibres
Pesticide Chemical class Mr b/
(g mol-1)
Water Solubility/
(mg L-1)
log Kow c H d/
(Pam3 mol-1)
Ions monitored/
(m/z)
Topt topt PDMSopt / PAf
opt
PDMS PA PDMS PA
Atrazine Triazine 215.7 33 2.5 1.5 × 10⁻⁴ 200 (215) 270 275 9 7 1.4
Simazine Triazine 201.7 6.2 2.1 5.6 × 10⁻⁵ 201 (186) 275 280 7 9 0.7
Prometryn Triazine 241.4 33 3.1 1.2 × 10⁻³ 241 (226) 270 280 7 7 5.3
Phorate Organophosphorus 260.4 50 3.92 5.9 × 10⁻¹ 231 (121) 275 280 7 7 1.9
Chlorpyrifos Organophosphorus 350.6 1.4 4.7 6.76 × 10⁻¹ 314 (258) 270 280 7 7 1.3
Fenitrothion Organophosphorus 277.2 14 3.43 6.65 × 10⁻² 260 (277) 275 280 7 7 1.3
Terbufos Organophosphorus 288.4 4.5 2.77 6.58 × 10⁻³ 231 (203) 270 285 7 7 1.7
Tebupirimfos Organophosphorus 318.4 5.5 n. f.e 2.89 × 10⁻¹ 318 (261) 275 280 7 5 1.3
Dimethenamid Chloroacetamide 275.8 1200 2.15 8.32 × 10⁻³ 154 (230) 270 275 7 9 3.3
Acetochlor Chloroacetamide 269.8 223 4.14 3.83 × 10⁻¹ 223 (146) 270 275 7 7 2.9
Prochloraz Imidazole 376.7 34.4 4.12 1.64 × 10⁻³ 308 (266) 270 280 7 7 2.2
Tebuconazole Triazole 307.8 36 3.7 1 × 10⁻⁵ 250 (125) 275 280 9 9 0.9
Metribuzin Triazinone 214.3 1050 1.6 1 × 10⁻⁵ 198 (215) 270 280 5 7 0.8
Chloridazon Pyridazinone 221.6 340 1.19 < 6.52 × 10⁻⁶ 221 (77) 270 280 7 9 5.1
Chlorothalonil Chloronitrile 265.9 0.81 2.92 2.5 × 10⁻² 266 (229) 270 275 9 9 1.3
Pendimethalin Dinitroaniline 281.3 0.3 5.18 2.728 × 10⁻³ 252 (191) 275 285 9 9 1.2
Oxyluorfen Diphenyl ether 361.7 0.116 4.47 9.40 × 10⁻² 252 (317) 270 280 7 7 1.2
Clomazone Isoxayolidinone 239.7 1100 2.5 4.19 × 10⁻³ 204 (125) 270 275 7 7 1.9
Fluorochloridone Pyridazinone 312.1 35.1 3.36 3.9 × 10⁻³ 315 (174) 270 280 7 7 0.7
Lindane Organochlorine 290.8 8.52 3.5 0.15 183 (219) 270 280 7 5 1.2
a Information taken from literature;11,12bMolecular weight; cPartition coeficient between n-octanol and water (as the log value); dHenry’s constant; eNot
found; fA (PDMS
opt)/A (PAopt), ratio of analytical signals under optimal desorption conditions for PDMS and PA ibres.
Table 2. Soil physico-chemical properties
Soil pH (H2O) O. M.*/ (%) Sand / (%) Silt / (%) Clay / (%)
A 6.72 3.43 28.40 47.96 23.64
B 8.39 3.17 73.96 22.60 3.44
C 7.54 8.69 52.08 24.48 23.44
The extraction eficiencies of various solvents (water, hexane, acetonitrile, acetone and methanol) and the optimum number of extraction steps were determined by the following procedure: soil samples were extracted with 15 mL of solvent for 30 min using a rotary stirrer and then centrifuged for 15 min at 4000 rpm. The extract was
iltered and evaporated to dryness at 35 oC using a rotary
evaporator. As all analyzed pesticides have good solubility
in acetone,11 dry residues were redisolved in 1 mL acetone,
and 0.2 mL of these solutions were diluted with water to 10 mL for DM-SPME measurements. In that way, it was ensured that the presence of organic solvent (2%) did not
affect SPME measurements and the ibre life.10,13-16
Finally, in order to determine whether and how much the different soil properties effected SPME eficiency, the optimized liquid-solid extraction procedure followed by SPME measurement was applied to analyse the selected pesticides in three different soil types.
Results and Discussion
DM-SPME optimization
Different experimental parameters that affect SPME measurements were optimized using spiked water samples. Optimization was done by a well-structured step-by-step approach including the choice of a most suitable SPME ibre, determination of optimal desorption temperature and time, extraction time and NaCl content.
Fibre selection and optimization of desorption conditions
Because polydimethyl-siloxane (PDMS) and a polyacrylate (PA) ibres have been most throughly studied and usually described as more efficient in pesticide extraction,5,7,17,18 these ibres were chosen for our study.
Table 1 shows optimal desorption temperatures for all pesticides and both ibres used in the experiment. As the best analytical signals for most analytes were recorded
at 280 °C for the PA ibre, and 270 °C for PDMS, these
temperatures were identiied as optimal for the PA and PDMS sorbents.
Table 1 also shows optimal desorption times for all pesticides and both ibres used in the experiment. The results suggest that 7 min can be chosen as optimal desorption time for both ibres. The table also shows the ratios of analytical signals under optimal desorption conditions for both ibres. The data indicate that the PDMS ibre is considerably more eficient for most pesticides (except simazine, metribuzin luorochloridone and tebuconazole), which is why it was chosen for further work.
Between two measurements, desorption of a blank ibre was done to ensure that no residual compound was present on the ibre.
Optimization of extraction time
Time dependence of the amount of analytes extracted by the ibre was investigated at intervals ranging from 10 to 60 min. The results indicate that for some analytes (phorate, terbufos, tebupirimfos, fenitrothion, chlorpyrifos, pendimethalin, oxyluorfen, chloridazon, tebuconazole and prochloraz) this interval was not enough to overtake the sorption equilibrium. This is in line with the well established fact that high molecular weight compounds, due to their low diffusion, and compounds that have higher afinity toward the SPME ibre need longer extraction times
to overtake equilibrium.19,20 Considering the pesticides’
molecular weights, water solubility and log Kow shown in
Table 1, it is evident that our results are in accordance with the rules mentioned.
Although extraction using equilibrium time is recommended, some theoretical models proposed for explanation of the SPME process have indicate that quantiication is possible before a sorption equilibrium is
reached,21-23 so that a 30 min extraction time, for practical
reasons, was chosen in the following experiments. The time period of 30 min has been found enough time to provide suficient analytical sensitivity for all compounds studied. In addition, this interval was in accordance with the chromatographic run time (in our case 28.47 min), which ensured a maximum sample throughput when manual extraction was applied.
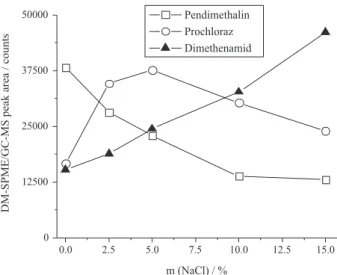
Effect of ionic strength
An addition of salt to a sample would decrease the solubility of some analytes in the aqueous phase, which
stimulates their movement into the ibre coating.19 For that
reason, the effect of ionic strength on the SPME process was studied by adding different amounts of NaCl to the water mixed standard solutions (0, 2.5, 5, 10 and 15% (m/v)).
The results indicate that ionic strenght affects SPME eficiency in different ways and that the yield of SPME depends on the nature of each pesticide. Thus, on the
basis of compounds behaviour, considering their logKow
values and solubility (Table 1), they can be classiied in three groups. The irst group includes compounds whose extraction eficiencies decrease as the percentage of NaCl added to the solution increases. This group consists of more hydrophobic pesticides such as chlorpyrifos, pendimethalin
and water solubility equal or less than 1.4 mg L-1 (Table 1).
Some compounds with intermediate polarity, like terbufos and tebupirimfos, were also included in that group. This dependence type is characteristic of chloridazon too, which
is unexpected because of its higher polarity (log Kow = 1.19
and solubility 340 mg L-1). A possible explanation for this
behaviour of chloridazon is the fact that strong competition between this pesticide and the other ones for PDMS ibre can occur when analyzing 20 compounds in one sample. This can result in a decrease in extraction eficiency for chloridazon. The second group includes pesticides for which the extraction yield increased with increasing ionic strength until a certain value was reached, and then it decreased. An explanation of this behaviour can be the intermediate polarity of these compounds. Polar compounds are known to have a low afinity for the PDMS ibre, which can be increased by decreasing their solubility in water through an addition of NaCl or some other salt. We may assume that these “intermediate” compounds behave as polar until a speciic concentration of NaCl in the solution is reached. After that, strong competition between these compounds and the more polar ones for the PDMS ibre can occur, resulting in decreasing extraction yield. The second group
includes phorate, prochloraz and metribuzin. The log Kow
values and solubility of the irst two analytes are 3.92 and
4.12, i.e. 50 and 34.4 mg L-1, respectively. As metribuzin is
a more polar compounds than the other two (log Kow = 1.6
and solubility 1050 mg L-1), it was unexpected that it should
belong to this group of pesticides. As for chloridazon, an explanation of its behaviour could be the presence of strong competition between this analyte and the other ones for sorption on the PDMS ibre. The third group of compounds is made up of polar pesticides and several pesticides of intermediate polarity, whose extraction yields increased with the increase of NaCl content. These compounds are characterized by high solubility in water and/or lower log Kow values, as the case is with triazines (atrazine, simazine and prometryn), clomazone, chloroacetamides (dimethenamid and acetochlor), tebuconazole, fenitrothion, chlorothalonil and luorochloridone. Interestingly, lindane as an organochlorine pesticide was characterized by this dependence type. However, the same result was reported by
Zhao et al.,6 who found that SPME eficiency for lindane
increased with an addition of NaCl, quite the opposite to other organochlorine pesticides. Figure 1 shows the effect of ionic strength on analytical signals for pendimethalin, prochloraz and dimethenamid as the representative pesticides of each group.
Comparing our results with some other indings, an agreement is evident in the obtained trends for triazines
(atrazine and simazine),9,16 some organophosphorus
pesticides (phorate, fenitrothion24 and chlorpyrifos1,8),
chlorothalonil,17 as well as lindane.6 However, for some
pesticides the trends observed were different from
those reported in literature (prochloraz,25 chlorpyrifos,24
chlorothalonil,26 prorate1 and fenitrothion1,26). As
mentioned before, during SPME analysis competition may occur among compounds of different polarity for the PDMS ibre. As other authors may also have some pesticides that we have investigated, and additionally some others that we did not examine, it is possible that the intensities of competition between various pesticides were different. This is a possible explanation of the difference between our and their results.
Finally, considering the results obtained for all pesticides in this study, a 5% NaCl content was chosen as optimal.
Soil extraction optimization
Eficiency of the optimized SPME method was checked in an analysis of soil samples. As mentioned before, DM-SPME of a soil organic extract obtained by conventional solid-liquid extraction diluted with an appropriate amount of water was shown to be a more eficient method than immersion of the SPME ibre in the slurry of soil sample
and distilled water.8-10 Therefore the irst approach was
chosen as the sample preparation step.
higher than those with other solvents, and methanol was therefore chosen for further work. The next step was to determine optimum extraction steps. Hence, the extraction of spiked soil samples with methanol was repeated up to four times under the same procedure. For most pesticides studied, the best recoveries were achieved after two extraction steps. For example, Figure 2 presents the results obtained for acetochlor, chlorothalonil and chloridazon. Finally, according to the results obtained in these two sets of experiments, two successive extractions with methanol as the extraction solvent were chosen as the optimal sample preparation procedure.
Validation of proposed method
The optimized liquid-solid extraction procedure followed by SPME measurement was applied to analyse
the selected pesticides in three different soil types. The main physico-chemical properties of these soils are given in Table 2.
Linearity of the developed method was tested in a
concentration range from 2 to 600 μg kg-1. The obtained
arrangements and correlation coefficients (R) for all pesticides and soils under study are presented in Table 3. It shows that the correlation coeficients obtained exceeded 0.99 for all compounds exept simazine and soil A (R = 0.988). The somewhat lower correlation coeficient for simazine is probably the results of a slightly lower sensitivity of simazine to the PDMS ibre.
The limit of detection was determined according to
IUPAC recommendations.27,28 LODs were calculated as
3.29 × sB, where sB is the blank standard deviation.
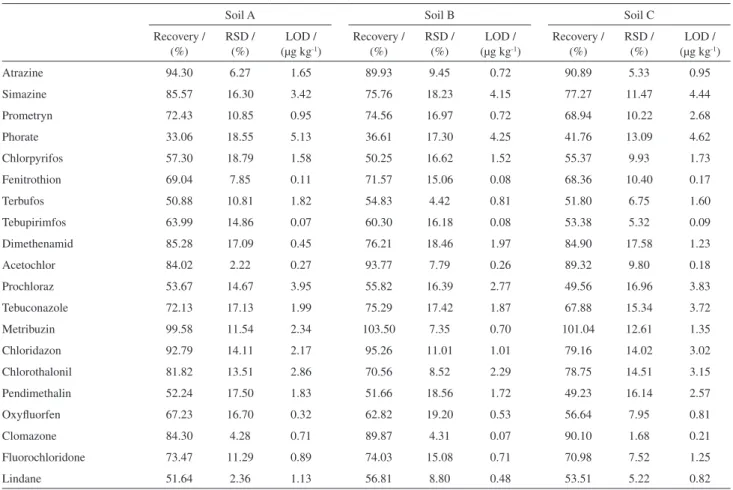
LODs for all pesticides studied were less than 5 μg kg-1,
except for phorate (5.13 μg kg-1, soil A) (Table 4). Precision
and conidence of the developed method were determined by performing four consecutive measurements of the soil
samples fortiied at 30 μg kg-1 level. Both, relative standard
deviation (RSD) and recovery values are presented in Table 4. The table shows that RSDs for all pesticides and soils under study were below 19%. As RSDs below
20% may be considered acceptable29 in trace analysis, the
proposed method can be satisfactory in terms of precision. On the other hand, our values are consistent with those reported by other authors.2,3,5,8
Figure 2. Dependence of extraction eficiency on: A) type of organic solvent and B) number of extraction steps, using the most eficient solvent.
Table 3. Linearity ranges (μg kg-1) and correlation coeficients (R) for pesticides and soils under study
Soil A Soil B Soil C
Concentration range / (μg kg-1)
R Concentration
range / (μg kg-1)
R Concentration
range / (μg kg-1)
R
Atrazine 2-600 0.999 2-600 0.996 2-600 0.999
Simazine 10-400 0.988 10-600 0.999 10-400 0.996
Prometryn 2-600 0.998 2-600 0.995 10-600 0.994
Phorate 10-600 0.999 10-600 0.999 10-600 0.996
Chlorpyrifos 2-600 0.997 2-600 0.994 2-600 0.999
Fenitrothion 2-600 0.999 2-600 0.999 2-600 0.993
Terbufos 2-600 0.997 2-600 0.991 2-600 0.991
Tebupirimfos 2-600 0.999 2-600 0.991 2-600 0.996
Dimethenamid 2-400 0.999 2-600 0.999 2-400 0.997
Acetochlor 2-600 0.999 2-600 0.998 2-600 0.997
Prochloraz 10-600 0.996 10-600 0.996 10-600 0.998
Tebuconazole 2-600 0.998 2-600 0.996 10-600 0.992
Metribuzin 10-600 0.995 2-600 0.999 2-600 0.999
Chloridazon 10-600 0.998 2-600 0.995 10-600 0.995
Chlorothalonil 10-400 0.994 10-400 0.998 10-600 0.999
Pendimethalin 2-600 0.999 2-600 0.999 2-600 0.996
Oxyluorfen 2-600 0.998 2-600 0.999 2-600 0.999
Clomazone 2-600 0.997 2-600 0.999 2-600 0.999
Fluorochloridone 2-600 0.999 2-600 0.998 2-600 0.998
For most of the analyzed pesticides, the recovery values were higher than 65%. Considering the exceptional complexity of the soil matrix and the fact that the samples were fortiied with pesticides and left to rest for 24 h prior to analysis (intending to better simulate real-life conditions),
the recovery values of ca. 65% may be accepted as
satisfactory. On the other hand, these values are consistent
with those reported by other authors.5,8,10 An explanation of
the lower recoveries obtained for phorate, terbufos, lindane, tebupirimfos, pendimethalin, chlorpyrifos, prochloraz and oxyluorfen (soils B and C) can be the strong inluence of soil matrix on those pesticides and/or the unsuficient power of methanol as extraction solvent in the sample preparation step. Having all this in mind, a method improvement is surely needed to make it more applicable to the analysis of genuine samples.
In order to determine matrix effects on the developed method, three different soils were chosen. As organic matter and clay mostly participate in the sorption of pesticides in soil,30 soils with different organic matter
and clay contents were chosen. Table 2 shows that soil C has similar clay and higher organic matter content than soil A. It was therefore assumed that the effect of organic
content on recoveries can be determined. On the other hand, soil A has similar organic matter content as soil B, but also a higher clay content. Considering the recoveries obtained for these two soils, we were able to determine the effect of clay on the efficiency of the proposed method. However, considering the recoveries (Table 4) and precision of measurements (standard deviation values are not shown), the soils with different physico-chemical properties were not found to have effect on the recoveries. This conclusion was not surprising because similar results
had been reported by Bouaid et al.8 However, considering
the dependences of the extracted pesticide amount as a function of pesticide concentration in different soil samples, it was noticed that the matrix effects of the soils studied were different. For example, Figure 3 shows the matrix effects of different soils on fenitrothion determination by the proposed SPME method. It shows that the sorption of this pesticide in different soils is similar at lower concentrations, which explains the initial conclusion in which only recoveries (fortiication of
30 μg kg-1) had been considered. However, it is obvious
that different soil properties do affect the eficiency of the method at higher concentration levels.
Table 4. Recoveries (%, n = 4), relative standard deviations (RSDs, %) and limits of detection (LODs, μg kg-1) obtained for pesticides and soils under study
Soil A Soil B Soil C
Recovery / (%)
RSD / (%)
LOD / (μg kg-1)
Recovery / (%)
RSD / (%)
LOD / (μg kg-1)
Recovery / (%)
RSD / (%)
LOD / (μg kg-1)
Atrazine 94.30 6.27 1.65 89.93 9.45 0.72 90.89 5.33 0.95
Simazine 85.57 16.30 3.42 75.76 18.23 4.15 77.27 11.47 4.44
Prometryn 72.43 10.85 0.95 74.56 16.97 0.72 68.94 10.22 2.68
Phorate 33.06 18.55 5.13 36.61 17.30 4.25 41.76 13.09 4.62
Chlorpyrifos 57.30 18.79 1.58 50.25 16.62 1.52 55.37 9.93 1.73
Fenitrothion 69.04 7.85 0.11 71.57 15.06 0.08 68.36 10.40 0.17
Terbufos 50.88 10.81 1.82 54.83 4.42 0.81 51.80 6.75 1.60
Tebupirimfos 63.99 14.86 0.07 60.30 16.18 0.08 53.38 5.32 0.09
Dimethenamid 85.28 17.09 0.45 76.21 18.46 1.97 84.90 17.58 1.23
Acetochlor 84.02 2.22 0.27 93.77 7.79 0.26 89.32 9.80 0.18
Prochloraz 53.67 14.67 3.95 55.82 16.39 2.77 49.56 16.96 3.83
Tebuconazole 72.13 17.13 1.99 75.29 17.42 1.87 67.88 15.34 3.72
Metribuzin 99.58 11.54 2.34 103.50 7.35 0.70 101.04 12.61 1.35
Chloridazon 92.79 14.11 2.17 95.26 11.01 1.01 79.16 14.02 3.02
Chlorothalonil 81.82 13.51 2.86 70.56 8.52 2.29 78.75 14.51 3.15
Pendimethalin 52.24 17.50 1.83 51.66 18.56 1.72 49.23 16.14 2.57
Oxyluorfen 67.23 16.70 0.32 62.82 19.20 0.53 56.64 7.95 0.81
Clomazone 84.30 4.28 0.71 89.87 4.31 0.07 90.10 1.68 0.21
Fluorochloridone 73.47 11.29 0.89 74.03 15.08 0.71 70.98 7.52 1.25
Finally, in terms of linear dependency of all pesticides and soils under study, the pesticides can be classiied in ive groups. The irst group includes compounds whose sorption decreased (recovery increased) in the following order: soil C > soil A > soil B. In this case, both organic matter and clay participated in the pesticides soil sorption. Hence, soil C with high organic matter and clay content sorbed pesticides stronger than soils A and B. On the other side, soil A, which had higher clay content than soil B, sorbed these pesticides stronger than soil B. This group includes luorochloridone, fenitrothion, tebuconazole, chloridazon, prometryn and prochloraz.
The second group consists of compounds whose sorption decreased in the order: soil A > soil C > soil B (metribuzin, lindane and terbufos). Sorption of these analytes was found to depend primarily on clay content in
the soil, i.e. sorption was higher when clay content in the
soil was higher. Therefore, soil B, which had the lowest clay content (and organic matter), sorbed those compounds more weakly than the other two soils that had higher clay contents. On the other side, the results indicate that soil C sorbed more weakly than soil A. A possible explanation of these results may be that organic matter in soil C had partially covered clay particles and so produced a limited number of active clay sorption sites of that soil.
The third pesticide group includes compounds whose sorption to soil was mainly determined by organic matter content in the soil. For these compounds sorption decreased in the order: soil C > soil B > soil A. Thus, soil C with higher organic matter content than the other two soils sorbed pesticides stronger. In soil A, a part of the organic matter was probably blocked by clay particles that produced a weaker sorption of analytes by the organic surface than soil B. This group consists of chlorpyrifos, tebupirimfos, pendimethalin and oxyluorfen.
The fourth group includes only acetochlor. The results indicate that sorption of that pesticide by soils was primarily determined by clay content in the soils. Therefore, soil A with high clay and low organic matter content was the strongest sorbent. In soil C, a part of clay sorption sites Figure 3. Matrix effect of soils with different physico-chemical properties
on fenitrothion determination by the proposed SPME method.
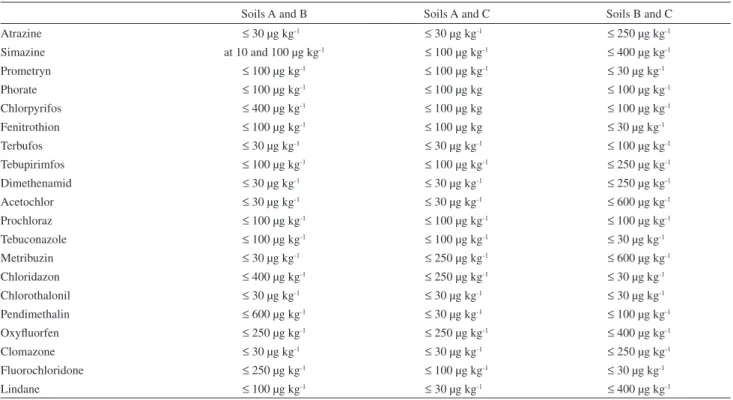
Table 5. Concentration limits (μg kg-1) with no signiicant statistical difference (p > 0.05) in sorption between the 2 soil types compared
Soils A and B Soils A and C Soils B and C
Atrazine ≤ 30 μg kg-1 ≤ 30 μg kg-1 ≤ 250 μg kg-1
Simazine at 10 and 100 μg kg-1 ≤ 100 μg kg-1 ≤ 400 μg kg-1
Prometryn ≤ 100 μg kg-1 ≤ 100 μg kg-1 ≤ 30 μg kg-1
Phorate ≤ 100 μg kg-1 ≤ 100 μg kg ≤ 100 μg kg-1
Chlorpyrifos ≤ 400 μg kg-1 ≤ 100 μg kg ≤ 100 μg kg-1
Fenitrothion ≤ 100 μg kg-1 ≤ 100 μg kg ≤ 30 μg kg-1
Terbufos ≤ 30 μg kg-1 ≤ 30 μg kg-1 ≤ 100 μg kg-1
Tebupirimfos ≤ 100 μg kg-1 ≤ 100 μg kg-1 ≤ 250 μg kg-1
Dimethenamid ≤ 30 μg kg-1 ≤ 30 μg kg-1 ≤ 250 μg kg-1
Acetochlor ≤ 30 μg kg-1 ≤ 30 μg kg-1 ≤ 600 μg kg-1
Prochloraz ≤ 100 μg kg-1 ≤ 100 μg kg-1 ≤ 100 μg kg-1
Tebuconazole ≤ 100 μg kg-1 ≤ 100 μg kg-1 ≤ 30 μg kg-1
Metribuzin ≤ 30 μg kg-1 ≤ 250 μg kg-1 ≤ 600 μg kg-1
Chloridazon ≤ 400 μg kg-1 ≤ 250 μg kg-1 ≤ 30 μg kg-1
Chlorothalonil ≤ 30 μg kg-1 ≤ 30 μg kg-1 ≤ 30 μg kg-1
Pendimethalin ≤ 600 μg kg-1 ≤ 30 μg kg-1 ≤ 100 μg kg-1
Oxyluorfen ≤ 250 μg kg-1 ≤ 250 μg kg-1 ≤ 400 μg kg-1
Clomazone ≤ 30 μg kg-1 ≤ 30 μg kg-1 ≤ 250 μg kg-1
Fluorochloridone ≤ 250 μg kg-1 ≤ 100 μg kg-1 ≤ 30 μg kg-1
was probably blocked by organic matter, inally producing a similar sorption capacity of this soil and soil B.
The fifth pesticide group consists of compounds whose sorption behaviour could not be explained by considering organic matter and clay contents alone. Our results indicate that there are actually two sorption trends: soil B > soil C > soil A (atrazine, simazine, chlorothalonil and dimethenamid) and soil A > soil B > soil C (phorate and clomazone). A possible explanation for the “unexpected” behaviour of these pesticides lies either in the difference in sand and silt contents in the analyzed soils (Table 2) or the different nature/origin of those soils (soils A and B were grassland soils, while soil C originated from forest). Considering the linear dependency observed and applying a two-factor analysis of variance (Statistika ’99 Edition, ANOVA/MANOVA), concentration ranges were determined with no statistically signiicant difference (p > 0.05) in sorption between the two soil types compared. The concentration ranges for all soil combinations (A and B, A and C, B and C) are shown in Table 5.
Generally, considering that for most of the pesticides studied, soils with different physico-chemical properties had different effects on their recovery (especially at higher concentration levels), it seems that a standard addition method would be more suitable for quantitative analysis than external calibration based on the use of standard solutions. However, if uncontaminated soil with physico-chemical properties similar to the analyzed soil sample is available, external calibration may be employed using spiked uncontaminated soil samples. It would help avoid possible errors arising from the inluence of the matrix.
Conclusions
A solid phase microextraction (SPME) method for simultaneous determination of 20 pesticides belonging to different pesticide groups in soil samples is presented. The method is based on a combination of conventional liquid-solid procedure and SPME determination of pesticides transferred from soil to aqueous solution, so that the time-consuming clean-up step for organic extracts is eliminated. Various microextraction conditions, such as the ibre type, desorption temperature and time, extraction time and NaCl content, as well as the extraction eficiencies of several solvents and the optimum number of extraction steps within the sample preparation step were investigated and optimized. In order to determine matrix effect on
the developed method, i.e. whether and how much the
different soil properties affected SPME eficiency, an optimized liquid-solid extraction procedure followed by SPME measurement was applied to analyse the selected
pesticides in three different soil types. The results indicate that soils with different physico-chemical properties have different effects on the recoveries of most pesticides, especially at higher concentration levels. It seems that for that reason, a standard addition method would be more suitable for quantitative analysis than external calibration based on the use of standard solutions. In the situation when uncontaminated soil with physico-chemical properties similar to the analyzed soil is available, quantiication using spiked uncontaminated soil samples may be done. In that way, possible errors inluenced from the matrix would be avoid.
Acknowledgments
This work was realized within the project No TR20041, supported by the Ministry of Science and Enviromental Protection of the Republic of Serbia.
References
1. Magdic, S.; Boyd-Boland, A.; Jinno, K.; Pawliszyn, J.; J. Chromatogr., A1996, 736, 219.
2. Ng, W. F.; Teo, M. J; Lakso, H. A.; Fresenius J. Anal. Chem.
1999, 363, 673.
3. Castro, J.; Perez, R. A.; Sanchez-Brunete, C.; Tadeo, J. L.; Chromatographia2001, 53, S-361.
4. Navalon, A.; Prieto, A.; Araujo, L.; Vilchez, J. L.; J. Chromatogr., A2002, 946, 239.
5. Doong, R. A.; Liao, P. L.; J. Chromatogr., A2001, 918, 177.
6. Zhao, R.; Wang, X.; Fu, S.; Yuan, J.; Jiang, T.; Xu, X.; Anal. Bioanal. Chem.2006, 384, 1584.
7. Fernandez-Alvarez, M.; Llompart, M.; Pablo Lamas, J.; Lores, M.; Garsia-Jares, C.; Cela, R.; Dagnac, T.; J. Chromatogr., A
2008, 1188, 154.
8. Bouaid, A.; Ramos, L.; Gonzalez, M.; Fernandez, P.; Camara, C.; J. Chromatogr., A2001, 939, 13.
9. Prosen, H.; Zupancic-Kralj, L.; Acta Chim. Slov.1998, 45, 1. 10. Lambropoulou, D. A.;.Albanis, T. A.; Anal. Chim. Acta2004,
514, 125.
11. Pesticide Manual; British Crop Protection Council-CDS Tomlin, 12th ed.; 2000-2001.
12. http://www.sitem.herts.ac.uk/aeru/footprint/en/index.htm, accessed in June 2008.
13. Eisert, R.; Levsen, K.; Fresenius J. Anal. Chem.1995, 351, 555. 14. Eisert, R.; Levsen, K.; J. Am. Soc. Mass Spectrom.1995, 6,
1119.
15. Urruty, L.; Montury, M.; J. Agric. Food Chem. 1996, 44, 3871. 16. Hernandez, F.; Beltran, J.; Lopez, F. J; Gaspar, J. V.; Anal. Chem.
17. Lambropoulou, D. A.; Konstantinou, I. K.; Albanis, T. A.; J. Chromatogr., A2000, 893, 143.
18. Sakamoto, M.; Tsutsumi, T.; J. Chromatogr., A2004, 1028, 63. 19. Pawliszyn, J.; Solid Phase Microextraction-Theory and
Practice, Wiley-VCH: New York, 1997.
20. Valor, I.; Perez, M.; Cortada, C.; Apraiz, D.; Molto, J. C.; Font, G.; J. Sep. Sci.2001, 24, 39.
21. Ai, J.; Anal. Chem. 1997, 69, 1230. 22. Ai, J.; Anal. Chem.1998, 70, 4822.
23. Ðurović, R.; Marković, M.; Marković, D.; J. Serb. Chem. Soc.
2007, 72, 879.
24. Beltran, J.; Lopez, F. J.; Cepria, O.; Hernandez, F.; J. Chromatogr., A1998, 808, 257.
25. Blasco, S.; Font, G.; Manes, J.; Pico, Y.; Anal. Chem. 2003, 75, 3606.
26. Jinno, K.; Muramatsu, T. M.; Salto, Y.; Kiso, Y.; Magdic, S.; Pawliszyn, J.; J. Chromatogr., A 1996, 754, 137.
27. Currie, L. A.; Anal. Chim. Acta 1999, 391, 127.
28. http://www.eurachem.org/guides/CITAC%20EURACHEM%20 GUIDE.pdf, accessed in April 2009.
29. Taverniers, I.; De Loose, M.; Van Bockstaele, E.; Trends Anal. Chem. 2004, 23, 535.
30. Sparks, D. L.; Environmental Soil Chemistry, Academic Press, Inc.: San Diego, 1995.
Received: March 5, 2009