Printed in Brazil - ©2005 Sociedade Brasileira de Química 0103 - 5053 $6.00+0.00
Article
* e-mail: [email protected]
Laboratory Validation of a Passive Sampler for SO
2Atmospheric Monitoring
Lícia P. S. Cruz, Vânia P. Campos*, Jussival A. P. Novaes and Tania M. Tavares
Instituto de Química, Universidade Federal da Bahia, Campus Universitário de Ondina, 40170-290 Salvador-BA, Brazil
O desempenho de um amostrador passivo foi testado sob exposição em câmara de Teflon. O SO2 fixado no filtro impregnado com solução de Na2CO3 1,0 x 10⁻² mol L-1 foi extraído com uso de
banho de ultra-som e solução de H2O2 durante 15 min, e determinado como SO42- por cromatografia
iônica. O amostrador apresentou bom desempenho, exceto sob condições de estagnação total do ar (0 m s-1), para períodos de exposição muito curtos (0,5 h), em atmosfera contendo O
3≥ 150 µg m -3 e
compostos reduzidos de enxofre em altas concentrações. A umidade relativa do ar (20 - 80%) e exposição à concentração zero não afetaram o desempenho. Mostrou estabilidade por um mês
quando estocado a 4 ºC ou por uma semana à temperatura ambiente (≈25 ºC). Sua precisão variou
entre 3,5 e 23% dependendo da concentração de SO2 e a exatidão entre 91 e 100%.
The performance of a passive sampler was tested under exposure in Teflon chamber. The SO2
trapped in impregnated filter with 1.0 x 10⁻² mol L-1 Na
2CO3 solution was extracted in ultrasound
bath with H2O2 solution for 15 min and determined as SO42- by ion chromatography. The sampler
presented good performance except for air in total stillness condition (0 m s-1), for very short
exposure periods (0.5 h), for atmosphere with O3≥ 150 µg m
-3 and for high concentrations of
reduced sulfur compounds. The relative humidity of the air (20 - 80%) and the exposure to zero concentration did not affect the sampler performance. It showed stability for one month at 4 ºC or for one week at about 25 ºC. Its precision varied within 3.5 and 23% depending of the SO2 concentration and the accuracy varied from 91 to 100%.
Keywords: passive sampling, atmospheric sulfur dioxide, air monitoring
Introduction
High amounts of SO2, estimated as 100 - 130 millions ton a year, are released in the atmosphere by anthropogenic sources, mainly produced by burning fossil fuel for heating and energy production, and by industrial sources like non-ferrous ore fusion, besides other processes such as sulfuric acid production and paper production.1-3 SO
2 is also
released by natural sources, for instance, through volcanic eruptions, which discharges into atmosphere an amount of sulfur likely smaller than 5 Tg S per year.3
Several methods can be used for either indirect or direct determination of the concentration of this gas in the atmosphere,4 such as spectrophotometric, coulometric,
conductometric and chromatographic. For monitoring atmospheric SO2 concentrations usually active sampling techniques have been applied, which comprise equipments,
sometimes sophisticated, electric power supply, and qualified staff to operate equipments, limiting the number of sites to be measured. Thus, simple alternative methods and low cost become relevant to this purpose. Passive samplers are devices able to fix either gaseous compounds or vapours from atmosphere, without involving air active movement through the sampler. The fixation rate of gases and vapours is controlled by physical processes, such as diffusion and permeation,5-7 and its average atmospheric
concentration during the exposure period is calculated by integration of Fick’s first law.8
(1)
where C is the external (environmental) pollutant concentration (µg m-3), m is the total collected mass (µg),
L is the diffusion course length (m), D is the diffusion coefficient (m2 h-1), A is the cross-section area of diffusion
course (m2) and t is the sampling time (h).
average ambient temperature T (K) and P, atmospheric pressure (Torr) during sampling period, according to equation 2:9
(2)
Basically there are two kinds of passive samplers. The first one, also the most used, is based on the principle of molecules diffusion through a static gas layer. Usually there is one or more diffusion barriers between collection surface and air inlet, that do not offer resistance to molecules transport. These barriers control diffusion and sampling rate, and hinder the inlet of particulate material into the diffusion area. The second kind of passive sampler is based on the absorption and further permeation of gas or vapour molecules through a membrane.10
Use of these samplers has spread and their theoretical bases were established in the earlier 70’s, when Palmes and Gunnison11 developed a tubular sampler for SO
2.
Although passive samplers were first developed to measure individual exposure in occupational environments,11-19
where pollutant concentrations are fairly high, recently they started to be applied to outdoor environmental monitoring,20-25 where concentrations usually are much
lower than those ones in occupational environments and undergo influence of meteorological conditions.
These samplers present several advantages compared to conventional active techniques: simplicity, low cost, portability, no need for air flux calibration and electricity. Results from passive measurements are derived in form of time-weighted average concentration, and there is no need to know the sampled air volume. These features make this kind of sampler suitable not only to monitor individual exposure, but also for application to environmental atmosphere, including remote areas, where generally there is no available electric power and other techniques cannot be used.10,26-30 On the other hand, these samplers show some
disadvantages, as they do not provide instantaneous concentrations, are not commercially available for several atmospheric compounds, do not allow sampling rate to vary - thus hindering concentration or dilution during sampling -, and do not have suitable sensitivity when exposed for short periods.28,29 However accuracy of passive
samplers have been tested in comparison with active methods, and usually good agreement has been derived for average concentrations in measured periods.30-33
This work validated a SO2 passive sampler, built in the authors’ laboratory in order to apply it to atmospheric monitoring networks, making possible spacial resolution for larger areas and improving cost-benefit ratio in the development of environmental activities management.
Experimental
Model of passive sampler used
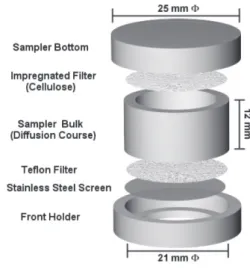
The passive sampler used in this paper has a configuration suggested by Ferm and Svanberg,30 and
comprises a cylindrical polyethylene tube (21 mm internal diameter and 12 mm length), sealed at the bottom to avoid convective transport thus producing positive errors in determined pollutant concentration. A stainless steel screen (thread diameter 0.08 mm and a aperture of 0.125 mm) followed by a Teflon membrane (pore 0.5 µm, diameter 25 mm) is adapted in the air inlet. After diffusion layer, SO2 is trapped in cellulose filter impregnated with a suitable reagent (Figure 1).
This model was chosen considering some advantages when compared to other kinds of samplers: possibility of reuse all parts (except filters and membranes), use of different filter loading reagents, minimization of turbulence and penetration of particles at the air inlet by the presence of a Teflon membrane, simplicity of sampler model, as well as possibility of increasing of length and introduction of a second absorbing medium, thus minimizing operational problems and increasing device capacity.
SO2 absorbing medium in passive sampler
Aiming comparison of SO2 absorption efficiency and definition of the solution to impregnate the filter used in the passive sampler, a previous study was made using different solutions as SO2 absorbing medium: 1.0 x 10⁻²
mol L-1 potassium tetrachloromercurate (TCM:
K2HgCl4),4,34 7 mmol L-1 buffered formaldehyde,35-37 1.0 x
10-1 mol L-1 triethanolamine (TEA: 2,2’,2”–
nitrilo-triethanol),38 and 1.0 x 10⁻² mol L-1 Na
2CO3.
33 These
solutions were prepared in deionized water in the following way: 1.0 x 10⁻² mol L-1 TCM (2.72 g of reagent
mercuric chloride and 1.49 g of potassium chloride to 1 L); 7 mmol L-1 buffered formaldehyde by dilution
formaldehyde solution (37%, 530 µL), 0.204 g of potassium hydrogen phthalate, and 2.0 mL of 50 mmol L-1
disodium (trans-1,2-cyclohexylenedinitrilo)tetraacetate (Na2CDTA) to 1 L; 1.0 x 10⁻¹ mol L-1 TEA by dilution of
the concentrated reagent; 1.0 x 10⁻² mol L-1 Na
2CO3 (1.06 g
of the reagent to 1 L). Absorbed SO2 was determined by UV-Vis spectrophotometry in the two first cases, and by ion chromatography for TEA and Na2CO3 solutions. Tests consisted in bubbling a standard SO2 atmosphere produced by a commercial permeation tube (Dynacal) gravimetrically calibrated (permeation rate: 141 ± 13 ng min-1 SO
2) and
kept in a thermostatic bath (25.0 ± 0.1 °C). Three serial bubblers containing 10 mL of test solution each were used. As carrier gas, commercial nitrogen was used at a rate of 40 L h-1 for periods of one hour.
Passive sampler assembly: material preparation
Samplers were prepared in the following way: 25 mm diameter cellulose filter were cut to fit in sampler bottom, followed by washing three times with deionized water in ultrasound bath and once with ethanol for 10 min. After drying in a stove at 50 ºC, filters were impregnated for 2 h in a 1.0 x 10⁻² mol L-1 Na
2CO3 solution and dried again
before being put in samplers. All the other sampler parts as well as vessels used for storing and transport underwent a similar cleaning treatment. Rubber gloves and tongs were used to handle passive samplers and avoid contamination.
Exposure chamber of passive samplers
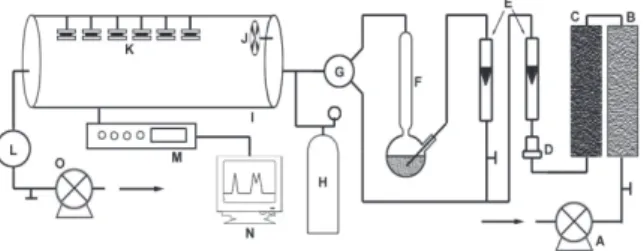
A Teflon chamber of 30 cm diameter and 120 cm length (Figure 2) based on the model proposed by Zhou and Smith,39 was built in the laboratory for exposure in passive
samplers. A small fan was put inside the chamber to minimize atmosphere stagnation effects, and to assist atmosphere homogenization, making possible to simulate different facial velocities in used samplers.
Passive sampler validation in laboratory
Check of passive sampler performance in laboratory was carried out by exposing in the Teflon chamber, sets of six passive samplers, centered and vertically arranged, hung by nylon wires, and with their front parallel to air
flow. A SO2 continuous analyzer (Thermo Environmental, Mod. 43A) was coupled to exposure chamber, in order to control the inner atmosphere. A SO2 standard mixture (15 mg m-3 in pure N
2) was used to produce different gas
concentration inside the chamber, by dilution in clean air from a system of silica gel and activated charcoal columns attached to a filter to prevent airborne particles. The use of a standard SO2 atmosphere from cylinder provided to submit the passive sampler in the exposure chamber to more concentrated atmospheres in the period of the experiments.
Several experiments were carried out aiming to study face velocity, exposure time, pollutant concentration, relative humidity, exposure to zero concentration and interferences effects. Storage effect of exposed samplers was also studied. Atmosphere inside the chamber was kept at room temperature (24 - 26 ºC) and SO2 diffusion coefficient was corrected for temperature for each experiment. The period of time to homogenize SO2 inside the chamber was 2 h. At the end of each experiment, samplers were separately stored in sealed polyethylene vessels and kept at 4 °C until analysis. Other experimental conditions are described in items below. All the tests were based on the protocol recommended by the Comité Européen de Normalisation40 for validation of passive
samplers.
Data of T and P were obtained during the periods of exposure of the passive sampler in laboratory using thermometer of precision and manometer SOCIOS, Mod. Gulpress 1001.
Analytical methodology
After exposure of passive samplers, SO2 trapped as sulfite in the filter was extracted in ultrasound bath using 1.5 mL of 1.0 x 10⁻² mol L-1 H
2O2 solution, for 15 min, to ensure
complete oxidation to sulfate. The extract was centrifuged for 5 min, and analysed by suppressed ion chromatography. Analysis conditions were: suppression in micro-membrane (40-50 mmol L-1 H
2SO4), separation column BT I AN
5311111 (120 x 6 mm), flow rate 1.8 mL min-1 and eluent 2
mmol L-1 Na
2CO3/ 0.75 mmol L
-1 NaHCO
3.
33
Results and Discussion
SO2 absorbing solutions
Although 1.0 x 10⁻² mol L-1 TCM and 7 mmol L-1
buffered formaldehyde solutions had shown very high SO2 absorption efficiencies (100 and 99% respectively), in bubbling tests, they were not chosen for use in passive samplers. In TCM case, the analytical method is very laborious, and in spite of many former adjustments34 to
overcome interferences from nitrogen oxides, ozone and transition metallic ions (Mn2+, Fe3+, Cr3+, Cu2+, V5+),
reproducibility is still dependent on many variables such as pH, temperature, reagent purity degree and standardization of analytical. Furthermore, toxicity of TCM (prepared with mercuric chloride) was taken into consideration. In formaldehyde case, the buffered solution (pH 4.2) used in spectrophotometric method described by Dasgupta et al.,37 where SO
2 atmospheric is trapped as
hydroxymethanesulfonic acid, has the advantage of less toxicity than TCM. Moreover, this solution is more efficient in SO2 stabilization at room temperature, since only 1% degrade in 30 days,37 whereas TCM solution has a
degradation rate of 1% a day.34 Yet this is also a very
laborious analytical method and shows similar difficulties with reagent purity and temperature dependence.
TEA solution was tested at different concentrations, based on former authors,22,25,38,41,42 but satisfactory analytical
results were found only for 1.0 x 10⁻¹ mol L-1 solution,
whose maximum efficiency of SO2 absorption was 88%. Moreover, TEA presents unsuitable behavior to be used in passive samplers: dependence on relative humidity, problems of sampler storage after exposure and low stability of TEA/SO2 complex.43
1.0 x 10⁻² mol L-1 Na
2CO3 solution was chosen as SO2
absorbing medium in passive sampler, as it showed other advantages besides high SO2 absorption (97%) and stability after oxidation to SO42-: it is a stable and non-toxic reagent,
and sulfate determination by ion chromatography is simple and fast. Detection limit was 0.10 µg mL-1 SO
4
2-.
The capacity of the passive sampler, calculated with base in the amount of the reagent in the collecting medium (impregnated filter) and stoichiometry of the reaction was about 95 µg SO2, the one that makes possible use it also in
occupational environment, where it would be capable to measure, for instance, during a period of 8 h an atmosphere containing 8.6 mg m-3 SO
2.
Performance of passive sampler in exposure chamber
The statistical test44 of comparison of mean of two
samples (90% confidence level) was applied to data from each passive sampler performance test. The mean obtained by the continuous analyzer was taken as true value and compared with the mean concentration from sets of six passive samplers, and relative standard deviation were thus calculated.
Effect of face velocity
To determine the effect of face velocity on sampler performance, a series of experiments was performed, where sets of six samplers were exposed under conditions corresponding to wind velocities of 0.0, 0.7, 1.8 and 2.5 m s-1, measured with an anemometer placed inside the
exposure chamber. These experiments were carried out for 2 h at a relative humidity of 48 - 52%, a temperature of 24-26 °C and a SO2 concentration about 52 µg m-3, which
corresponds to a condition of pollution.
In these experiments it was observed that under air stillness condition at the outer face of the passive sampler (face velocity = 0 m s-1), SO
2 average concentration in the
atmosphere inside exposure chamber measured with these samplers was significantly lower than measured with continuous analyzer (Table 1). This is to be expected, since under these conditions air moves very slowly, out of the sampler diffusion course, decreasing sampling velocity and producing negative errors. This effect is also called “starvation” effect.45,46
Relative humidity effect
Different levels of relative humidity were simulated with an hygrometer coupled to an exposure chamber by varying proportions of dried air flow (through drying columns) mixed with humid air (water steam), to varied required humidity level: 20% for low relative humidity, 50% middle, and 80% high. Sets of six passive samplers were simultaneously exposed to atmosphere containing 13 and 52 µg m-3 SO
2, at facial velocity of 1.8 m s
-1, for 2 h.
Time exposure and concentration effects
For these performance tests and those to follow, sets of six samplers were exposed under fixed conditions of facial velocity (1.8 m s-1), relative humidity (48-52%) and
temperature (24 - 26 °C). To study time of exposure as function of SO2 atmospheric concentration, samplers were exposed to SO2 concentration of 13, 52 and 210 µg m-3 for
0.5, 2 and 8 h. Passive sampler showed good performance in all situations except for 0.5 h exposure time, the lowest concentration, corresponding to SO42- values below the
detection limit due to very short exposure time; for the other concentrations false low results were observed (Table 1).
Storage and temperature effect
In order to check storage and temperature effect, samplers were exposed in chamber for 2 h at 52 µg m-3 SO
2.
After exposure, groups of samplers were stored in plastic vessels at 4 ºC and at room temperature for 7, 14 and 28 days. Passive sampler showed stability for one month after exposure when stored at 4 ºC or at room temperature (≈ 25 ºC) for one week.
Effect of interferent substances
O3 and reduced sulfur compounds (RSC) interferences were checked in passive samplers performance for SO2. These were exposed to different concentrations of potentially interferent substances for 2 h. As RSC a standard mixture of COS, CH3SH, CS2 and DMS and other mixture of H2S were used both in pure N2. Different concentrations of these substances were produced in the chamber by dilution with clean air. An ozonizer, based on UV light, was used as O3 source and produced concentrations, which were monitored with an O3 continuous analyzer. Results from this study are shown in Table 2 and Figure 3. These were exposed to different concentrations of potentially interferent substances for 2 h.
The passive sampler did not show a good performance for atmosphere containing ozone concentrations higher
than 150 µg m-3, which corresponds to high pollution
condition (quality standard for O3 in Brazil is 160 µg m-3
for one hour)47 and in presence of H
2S concentrations
higher than 7 µg m-3, which also corresponds to a high
pollution condition, in which H2S can be sensed by its characteristic rotten egg odor (guideline from World Health
Table 2. Performance of passive samplers under exposure to SO2 atmosphere containing reduced sulfur compounds
Atmosphere in the chamber / (µg m-3) CSO
2 from the passive RSD /%
SO2 H2S COS CH3SH CS2 DMS sampler / (µg m-3)
7.47 ± 3.7 1.39 — — — — 7.62 ± 2.9 2.1
6.89 ± 3.4 3.48 — — — — 7.13 ± 3.0x10⁻² 3.4
14.5 ± 3.1 6.97 — — — — 15.9 ± 2.1 9.7
6.37 ± 3.7 — 6.14 4.92 7.79 6.35 6.31 ± 1.2 8.0x10⁻³
15.7 ± 4.7 — 12.3 9.84 15.6 12.7 14.1 ± 2.5 9.9
28.0 ± 5.8 — 24.6 19.7 31.1 25.4 29.6 ± 1.6 5.6
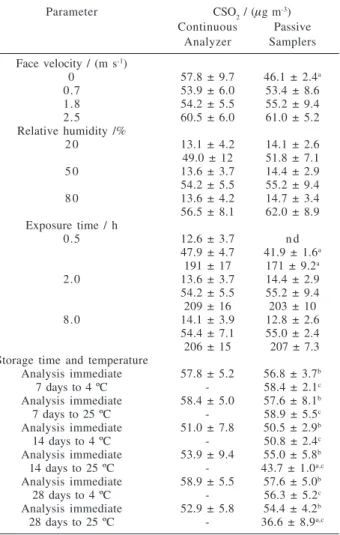
Table 1. Results of chamber performance tests of SO2 passive sam-plers with Na2CO3 impregnated filter as function of face velocity, relative humidity, exposure time, storage time and temperature
Parameter CSO2 / (µg m-3) Continuous Passive
Analyzer Samplers
Face velocity / (m s-1)
0 57.8 ± 9.7 46.1 ± 2.4a
0.7 53.9 ± 6.0 53.4 ± 8.6
1.8 54.2 ± 5.5 55.2 ± 9.4
2.5 60.5 ± 6.0 61.0 ± 5.2
Relative humidity /%
2 0 13.1 ± 4.2 14.1 ± 2.6
49.0 ± 12 51.8 ± 7.1
5 0 13.6 ± 3.7 14.4 ± 2.9
54.2 ± 5.5 55.2 ± 9.4
8 0 13.6 ± 4.2 14.7 ± 3.4
56.5 ± 8.1 62.0 ± 8.9 Exposure time / h
0.5 12.6 ± 3.7 n d
47.9 ± 4.7 41.9 ± 1.6a 191 ± 17 171 ± 9.2a
2.0 13.6 ± 3.7 14.4 ± 2.9
54.2 ± 5.5 55.2 ± 9.4 209 ± 16 203 ± 10
8.0 14.1 ± 3.9 12.8 ± 2.6
54.4 ± 7.1 55.0 ± 2.4 206 ± 15 207 ± 7.3 Storage time and temperature
Analysis immediate 57.8 ± 5.2 56.8 ± 3.7b
7 days to 4 ºC - 58.4 ± 2.1c
Analysis immediate 58.4 ± 5.0 57.6 ± 8.1b
7 days to 25 ºC - 58.9 ± 5.5c
Analysis immediate 51.0 ± 7.8 50.5 ± 2.9b
14 days to 4 ºC - 50.8 ± 2.4c
Analysis immediate 53.9 ± 9.4 55.0 ± 5.8b
14 days to 25 ºC - 43.7 ± 1.0a,c
Analysis immediate 58.9 ± 5.5 57.6 ± 5.0b
28 days to 4 ºC - 56.3 ± 5.2c
Analysis immediate 52.9 ± 5.8 54.4 ± 4.2b
28 days to 25 ºC - 36.6 ± 8.9a,c
Organization recommends this value as maximum exposure for 30 min). For the other RSC’s at maximum tested concentration (20-30 µg m-3) a good passive sampler
performance was achieved (RSD about 6%).
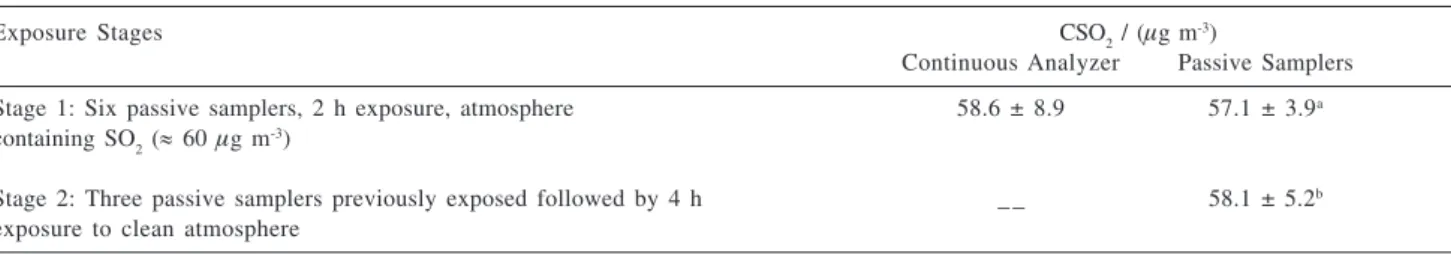
Exposure to zero concentration effect
Experiments were carried out to study the sampler exposure to a clean atmosphere, following exposure to 52 µg m-3 SO
2 for 2 h. After this 2 h period, the six samplers
were taken out from the chamber. Afterwards the clean air passed through the chamber. Next, three other samplers not previously exposed (blank) were put inside the chamber together with three samplers exposed in the first stage for 4 h, where just clean air was injected into chamber, under environmental conditions identical to previous. Analysis of the Table 3 does not confirm any significant difference in SO2 amount sampled before exposure to zero concentration.
Precision and accuracy
By experiments with SO2 passive sampler exposed in
chamber, estimates of precision based on relative standard deviation, ranged from 18 to 23% for 13 µg m-3 SO
2, from
4.3 to 18% for 52 µg m-3 SO
2, and from 3.5 to 5.2% for
210 µg m-3 SO
2. Simultaneous measurements under same
conditions made with a continuous analyzer that recorded concentration values every 5 s, had precision between 26 and 32%, 7 and 25%, and 7 and 9% respectively. These ranges are wider than those ones of measurements with a passive sampler, which indicated that atmosphere homogenization inside the chamber might not have been complete. The International Standardization Organization (ISO) 199748 recommends the use of an exposure chamber
with minimum size of 2 x 2 x 3 m, as the minimum as to ensure a total atmosphere homogenization. However, in this work, the chamber model suggested by Zhou and Smith39 was the only available.
By using results from tests in chamber, 27 experiments with sets of six samplers, accuracy was determined as 96 ± 3.4%. Variability was from 91 to 100%, independent of exposure time, SO2 concentration and/or interferent substances present in the chamber atmosphere, and meteorological conditions like relative humidity and wind velocity. The correlation between the average measurements from passive samplers and continuous analyzer was high and significant (R= 0.9980; p < 0.0001).
Conclusions
From all tested reagents, 1.0x10⁻² mol L-1 Na
2CO3
solution showed the most promising features as SO2 absorbing medium for passive sampler (PS). Tests of PS in exposure chamber showed that: to a large extent sampler performance was not influenced by variation of relative humidity of tested air (20-80%); sampler remains stable for one month after exposure when stored at 4 ºC and for one week at room temperature (≈ 25 ºC); in view of known atmospheric concentrations of RSC in natural and industrial areas49-52 being much lower than levels interfering
in passive sampler efficiency (> 7 µg m-3 H 2S and
20-30 µg m-3 for the other RSC), these samplers
performance are hardly be influenced by these compounds;
Table 3. Effect of exposure to zero concentration on the performance of diffusion passive samplers with Na2CO3 impregnated filter for SO2
Exposure Stages CSO2 / (µg m-3)
Continuous Analyzer Passive Samplers
Stage 1: Six passive samplers, 2 h exposure, atmosphere 58.6 ± 8.9 57.1 ± 3.9a containing SO2 (≈ 60 µg m-3)
Stage 2: Three passive samplers previously exposed followed by 4 h _ _ 58.1 ± 5.2b exposure to clean atmosphere
a Average from three measurements carried out in parallel in stage 1; b Average from three measurements carried out in parallel in stages 1 and 2.
SO2 amount trapped in PS upon exposure is not altered when sequentially exposed to zero concentration for 4 h, indicating their suitability for remote regions, whose atmosphere can stay clean for periods. In a similar way, these tests indicate that they can be used in polluted areas as well next to industrial sources, where emissions are often intermittent; PS did not show good performance only under air stillness condition (face velocity = 0 m s-1), in
atmosphere with O3 concentration ≥ 150 µg m-3 and for
very short time exposure, 0.5 h, for instance, where false lower results were obtained. Estimates of precision of PS in exposure chamber, based on relative standard deviation of six samplers each, ranged from 18 to 23%, from 4.3 to 18%, from 3.5 to 5.2%, respectively for exposure to 13, 52 and 210 µg m-3 SO
2. Its accuracy was de 96 ± 3.4%,
independent of exposure time, SO2 and/or interferent substances levels in chamber atmosphere, as well as of meteorological conditions such as relative humidity and wind velocity.
Acknowledgements
Authors acknowledge CAPES for fellowship and FINEP for grants.
References
1. Nebel, B. J.; Wright, R. T.; Environmental Science, Prentice Hall: New Jersey, 1996.
2. Raven, P. H.; Berg, L. R.; Johnson, G. B.; Environment, Saunders College Publishing: London, 1995.
3. Cullis, C. F.; Hirschler, M. M.; Atmos. Environ. 1980, 14, 1263.
4. West, P. W.; Gaeke, G. C.; Anal. Chem.1956, 28, 1816. 5. Brown, R. H.; Pure Appl. Chem. 1995,67, 1423.
6. Brown, R. H.; Harvey, R. P.; Purnell, C. J.; Saunders, K. J.; Am.
Ind. Hyg. Assoc. J.1984,45, 67.
7. Brown, R. H.; Wright, M. D.; Analyst1994,119, 75. 8. Palmes, E. D.; Lindenboom, R. H.; Anal. Chem.1979, 51,
2400.
9. Fish, B. R.; Durham, J. L.; Environ. Lett.1971, 2, 13. 10. Rose, V. E.; Perkins, J. L.; Am. Ind. Hyg. Assoc. J.1982,43,
605.
11. Palmes, E. D.; Gunnison, A. F.; Am. Ind. Hyg. Assoc. J. 1973,
34, 78.
12. Palmes, E. D.; Gunnison, A. F.; DiMattio, J.; Tomczyk, C.; Am.
Ind. Hyg. Assoc. J.1976,37, 570.
13. Tompkins, F. C.; Goldsmith, R. L.; Am. Ind. Hyg. Assoc. J. 1977,38, 371.
14. Bailey, A.; Hollingdale-Smith, P. A.; Ann. Occup. Hyg.1977,
20, 345.
15. Palmes, E. D.; Tomczyk, C.; Am. Ind. Hyg. Assoc. J.1979, 40, 588.
16. Lautenberg, W. J.; Kring, E. V.; Morello, J. A.; Am. Ind. Hyg. Assoc. J.1980, 41, 737.
17. Coleman, S. R.; Am. Ind. Hyg. Assoc. J.1983,44, 631. 18. Van der Wal, J. F.; Morekerken, A.; Ann. Occup. Hyg.1984,
28, 39.
19. Cassinelli, M. E.; Hull, R. D.; Cuendet, P. A.; Am. Ind. Hyg.
Assoc. J.1985,46, 599.
20. Shields, H. C.; Weschler, C. J.; JAPCA1987, 37, 1039. 21. Cohen, M. A.; Ryan, P. B.; Yanagisuwa, Y.; Spengler, J. D.;
Ozkaynak, H.; Epstein, P. S.; JAPCA1989, 39, 1086. 22. Krochmal, D.; Kalina, A.; Atmos. Environ.1997,31, 3473. 23. Krochmal, D.; Kalina, A.; Environ. Pollut. 1997,96, 401. 24. Royset, O.; Fresenius J. Anal. Chem.1998,360, 69. 25. De Santis, F.; Allegrini, I.; Fazio, M. C.; Pasella, D.; Piredda,
R.; Anal. Chim. Acta1997, 346, 127.
26. Cao, X.-L.; Hewitt, C. N.; Environ. Technol.1991,12, 1055. 27. Harper, M.; Purnell, C. J.; Am. Ind. Hyg. Assoc. J.1987,48,
214.
28. Shooter, D.; Watts, S. F.; Hayes, A. J.; Environ. Monit. Assn. 1995,38, 11.
29. Cruz, L. P. S.; Campos, V. P.; Quim. Nova2002, 25, 406. 30. Ferm, M.; Svanberg, P. A.; Atmos. Environ. 1998,32, 1377. 31. Ferm, M.; Rodhe, H.; J. Atmos. Chem. 1997, 27, 17. 32. CETESB; Monitor Passivo de SO2 – Construção e Testes de
Validação, São Paulo, Brazil, 1998. http:// www.cetesb.sp.gov.br, accessed in January 2003.
33. Santos, L. P.; MSc. Dissertation, Universidade Federal da Bahia, Brazil, 2000.
34. Scaringelli, F. P.; Saltzman, B. E.; Frey, S. A.; Anal. Chem. 1967, 39, 1709.
35. Dasgupta, P. K.; Air Pollut. Control Assn. J. 1981, 31, 779. 36. Dasgupta, P. K.; Anal. Chem.1981, 53, 2084.
37. Dasgupta, P. K.; DeCesare, K. B.; Ullrey, J. C.; Anal. Chem. 1980, 52, 1912.
38. Nishikawa, Y.; Taguchi, K.; J. Chromatogr.1987, 396, 251. 39. Zhou, J.; Smith, S.; J. Air Waste Manage. Assoc. 1997, 47,
697.
40. CEN/TC264/WG11, Comité Européen de Normalisation: Brussels, 1998. http://www.cenorm.be, accessed in January 2003.
41. Vinjamoori, D. V.; Ling, C.; Anal. Chem. 1981, 53, 1689. 42. Krochmal, D.; Gorski, L.; Environ. Sci. Technol. 1991, 25,
531.
43. Scheeren, B. A.; De Santis, F.; Allegrini, I.; Heeres, P.; Int. J.
Environ. Anal. Chem. 1994, 56, 73.
44. Miller, J. C.; Miller, J. N.; Statistics for Analytical Chemistry, John Wiley & Sons: New York, 1984.
45. Feigley, C. E.; Riley, T. D.; Underhill, D. W., Vaden, K. I.;
46. Underhill, D. W.; Feigley, C. E.; Anal. Chem.1991, 63, 1011. 47. CONAMA; Resolução nº 003, Diário Oficial da República Federativa do Brasil, Brasília, Brazil, 28.06.1990. Available: http://www.mma.gov.br, accessed in January 2003.
48. ISO/DRAFT DIS, Workplace Atmospheres, Protocol for Evaluating the Performance of Diffusive Samplers: Netherlands, 1997. http://www.iso.ch/en/ISOOnline.frontpage. 49. Nunes, L. S. S.; PhD. Thesis, Universidade Federal da Bahia,
Brazil, 2000.
50. Warneck, P.; Chemistry of the Natural Atmosphere, Academic Press: USA, 1988.
51. Jaeschke, W.; Herrmann, J.; Int. J. Environ. Anal. Chem.1981, 10, 107.
52. Jaeschke, W.; Dippell, J.; Sitals, R.; Haunold, W.; Int. J. Environ. Anal. Chem. 1994, 54, 315.
Received: March 17, 2003