J. Braz. Chem. Soc., Vol. 16, No. 1, 58-61, 2005.
Printed in Brazil - ©2005 Sociedade Brasileira de Química 0103 - 5053 $6.00+0.00
Article
* e-mail: [email protected]
Simultaneous Spectrometric Determination of Cu
2+, Mn
2+and Zn
2+in Polivitaminic/
Polimineral Drug Using SPA and GA Algorithms for Variable Selection
Heronides A. Dantas Filhoa, Ênio S. O. N. de Souzaa, Valeria Visania, Sara R. R. C. de Barrosa, Teresa C. B. Saldanhaa, Mário C. U. Araújo*,a and Roberto K. H. Galvãob
a
Departamento de Química, Centro de Ciências Exatas e da Natureza, Universidade Federal da Paraíba, Cidade Universitária, CP 5093, 58051-970 João Pessoa - PB, Brazil
b
Divisão de Engenharia Eletrônica, Instituto Tecnológico de Aeronáutica, 12228-900 São José dos Campos - SP Brazil
Este artigo apresenta uma aplicação do método para determinação espectrofotométrica simultânea dos íons divalentes de cobre, manganês e zinco à análise de medicamento polivitamínico/polimineral. O método usa 4-(2-piridilazo) resorcinol (PAR), calibração multivariada e técnicas de seleção de variáveis e foi otimizado o empregando-se o algoritmo das projeções sucessivas (APS) e o algoritmo genético (AG), para escolha dos comprimentos de onda mais informativos para a análise. Com essas técnicas, foi possível construir modelos de calibração por regressão linear múltipla (RLM-APS e RLM-AG). Os resultados obtidos foram comparados com modelos de regressão em componentes principais (PCR) e nos mínimos quadrados parciais (PLS). Demonstra-se a partir do erro médio quadrático de previsão (RMSEP) que os modelos apresentam desempenhos semelhantes ao prever as concentrações dos três analitos no medicamento. Todavia os modelos RLM são mais simples pois requerem um número muito menor de comprimentos de onda e são mais fáceis de interpretar que os baseados em variáveis latentes.
The application of the method for the simultaneous spectrophotometric determination of the divalent ions of copper, manganese and zinc for analysis of a pharmaceutical formulation of polivitaminic/polimineral is reported. This method uses 4-(2-pyridylazo) resorcinol (PAR) and multivariate calibration and was optimized using the successive projections algorithm (SPA) and a genetic algorithm (GA) for choosing the best series of wavelengths for analysis. Thus the construction of calibration models based on multiple linear regression (MLR-SPA and MLR-GA respectively) was made possible. The results obtained were compared with models based on latent variables, principal component regression (PCR) and partial least square regression (PLS) through the criterion of the root mean square error of prediction (RMSEP). All the methods presented even performance but the RLM methods are simpler since they require a smaller number of wavelengths and are easier to interpret than those based on latent variables.
Keywords: variable selection, multivariate calibration, metals, drugs analysis, spectrophotometry
Introduction
Although quantitative spectrophotometry in the UV-Vis spectral region is an analytical technique known and widely employed for a long time, it continues to attract interest owing to its simplicity and versatility. Nowadays, joined with chemometrics methods of experimental design, selection of variables and mainly multivariate calibration it has been successfully applied to simultaneous multicomponent determinations. Recent contributions in this field range from the proposition of new algorithms for
selecting variables1 to the development of new analytical
methodologies with or without chromogenic reagents.2,3
On the other hand, spectrometric multicomponent analysis is a subject of great practical importance in the environmental,4 clinical5 and pharmaceutical6 areas.
Recently, a method of spectrometric multicomponent analysis (SMA) for metal determination was developed using 4-(2-pyridylazo)resorcinol (PAR) as chromogenic reagent and multivariate calibration in the ultraviolet spectral region.7 In that work, the method was applied to
59 Simultaneous Spectrometric Determination of Cu2+, Mn2+ and Zn2+
Vol. 16, No. 1, 2005
very overlapped, the composition of the synthetic mixtures constituting the test series was predicted successfully. Here, the method was adapted to simultaneous determination of the divalent ions Cu2+, Mn2+ and Zn2+ in real samples of a
polivitaminic/polimineral medicine in the visible region. In addition, two variable selection algorithms, SPA and GA1 were used in order to optimize the performance of the
method and allow the calibration by MLR.
Experimental
Instrumentation
All molecular absorption spectra were measured on an HP8453 diode array spectrophotometer (Hewlett-Packard), using 1.00 cm quartz cells and one-second integration time. The instrument operates from 190 to 1100 nm, with 1 nm resolution. The quantitative analysis of each metal in the medicine was made on a GBC 908AA flame atomic absorption spectrophotometer (Scientific Equipment PTY) adopted as the reference method.
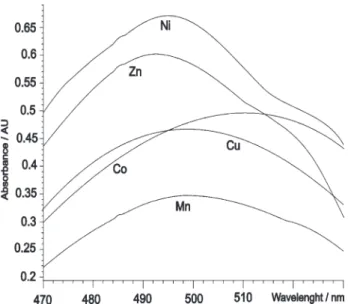
A previous selection of the working spectral range was
based on derivative spectra7 and resulted in 61
wavelengths, from 470 to 530 nm. For the five metal complexes originally studied the spectra are shown in Figure 1.
Reagents and solutions
The PAR stock solution (5.0x10⁻³ mol L-1) was prepared
from the sodium salt monohydrate -C11H8N3Na.H2O (Merck) in an ammonium medium (NH3 0.05 mol L-1) where
it is stable for about one month.9 The solution was kept in
a polyethylene flask covered with aluminum foil. A solution prepared by 1:5 dilution of a 0.05 mol L-1
borax solution was used as buffer and kept the pH equal to 9.0.10
Analyte stock solutions of the ions Cu2+, Mn2+ and
Zn2+ (1000 mg L-1) were prepared by diluting Tritrisol
(Merck) or Fixanal (Riedel de Haën) ampoules as recommended by the manufacturer.
The standard solutions of each complex and the mixtures were prepared by diluting the analyte and PAR stock solutions. The reagents were added in the following order: metal solution – buffer solution – PAR; then the volume was completed with the buffer solution.
The samples analyzed were effervescent tablets which did not require any pretreatment. Each tablet was dissolved in water, the resulting solution was stirred for gas releasing and the volume was adjusted to 500 mL. No additional reagents were needed to stabilize the samples because they were prepared and analyzed during same day. Before use, they were suitably diluted to the linear concentration range of the each metal for each one of the methods employed, SMA and AAS.
In all mixtures, the PAR concentration (in mol L-1)
was kept equal to three times the sum of metal concentrations (in mol L-1) in the most concentrated
calibration mixture, that is, [PAR]/[Metals] ≥ 3. A blank was prepared with the buffer and PAR in the same proportion as the mixtures.
Analytical grade reagents and water purified by a Milli-Q (Millipore) system were used throughout.
Software
Version 6.1 of the Unscrambler chemometrics software (CAMO A/S)11 was used for specifying the factorial design
and for the PLS and PCR calculations. The GA and SPA calculations for selection of variables were implemented using the MATLAB, version 4.2 (The Math Works Inc.).
Experimental design
Three sets of samples were used for building the models: calibration, validation and prediction set.12 The calibration
set was composed by nine mixtures whose composition was defined according to a 23 full factorial design with a
central point.12,13 For each metallic ion the lower and upper
levels were selected in their respective concentration linear range and were the following (in mg L-1): Cu2+ (0.05 and
0.52), Mn2+ (0.03 and 0.34) and Zn2+ (0.05 and 0.52). In
addition, five synthetic mixtures and four real samples of Figure 1. Spectra of the isolated chelates Metal-PAR at pH 9.0 with
60 Dantas Filho et al. J. Braz. Chem. Soc.
the medicine were included in this series. Thus, the complete calibration set consisted of eighteen mixtures.
The validation set was used with the goal of determining if the models are reliable. It was composed by seventeen mixtures: nine mixtures that were the replicates of the first nine calibration mixtures, four synthetic mixtures and four real samples.
The prediction set, not included in the calibration, was used to validate the prediction. It was composed by eight synthetic mixtures and six real samples. The contents of Cu2+, Mn2+ and Zn2+ in the prediction set determined by
AAS are shown in Table 1.
Results and Discussion
Calibration models based on principal component (PCR), partial least squares (PLS) and multiple linear (MLR) regressions were built.14 The X matrix contains the
spectra and the concentrations of the three species (Cu2+,
Mn2+ and Zn2+) compose the Y matrix.
Firstly, the optimal number of factors to be used in PCR and PLS modeling was determined by using the validation set and adopting the criterion of the smallest root mean-square error of prediction (RMSEP) in the validation set, defined as
(1)
where ym and y^m are the reference and predicted values of the concentration of the mth validation object and M is the
number of validation objects.
In order to make feasible the building of an MLR
model, whose results are simpler to interpret than those yielded by models based on latent variables, the techniques of variable selection, GA and SPA, were applied to the data. SPA is an iterative forward selection method that operates on the instrumental response matrix, whose lines and columns correspond to calibration samples and spectral variables, respectively. Its purpose is to select wavelengths whose information content is minimally redundant, in order to solve collinearity problems. Starting from a certain column, SPA determines which of the remaining columns has the largest projection on the subspace orthogonal to the considered column. This second column can be regarded as the one which contains the largest amount of information not included in the first column. In the next iteration, SPA restricts the analysis to the same subspace, taking the second column as the new reference column, and proceeds with the steps described above. A detailed description of this algorithm is reported in references 1 and 15. The GA used had the following features: the number of wavelengths to be selected was limited to 30 at most; the population size was fixed at 100 chromosomes; each realization consisted of 40 generations; elitism was employed; crossover and mutation probabilities were set to 60% and 10%, respectively. The GA was run 20 times using the inverse of RMSEP as the fitness criterion. SPA was configured so as to select at least one variable and at most the number of calibration mixtures (eighteen). Before running SPA the data of the X matrix were autoscaled. The best set of wavelengths was determined for each metallic ion on the basis of the smallest RMSEP of the validation set.
After the selection of the variables by SPA and GA, MLR models named MLR-SPA and MLR-GA, respectively, were built. These models and also PCR and PLS models were then applied to the prediction set. The results are showed in Table 2 in terms of RMSEP in the prediction set.
Overall, the results on Table 2 are similar; based on F – test applied on the squares of the RMSEPs. Only for copper there is significant statistical difference among PLS and MLR-GA result, at the 5% level. However, the wavelength selection allowed good results to be obtained Table 1. Reference values of metal concentrations in prediction set
(SM = synthetic mixtures and RS = real samples)
Samples Reference Values (mg L-1)
Cu2+ Mn2+ Zn2+
SM 1 0.44 0.24 0.13
SM 2 0.13 0.19 0.13
SM 3 0.28 0.19 0.20
SM 4 0.44 0.09 0.36
SM 5 0.20 0.14 0.36
SM 6 0.13 0.29 0.44
SM 7 0.13 0.29 0.44
SM 8 0.13 0.29 0.44
RS 1 0.072 0.077 0.50
RS 2 0.084 0.075 0.52
RS 3 0.083 0.073 0.47
RS 4 0.075 0.11 0.49
RS 5 0.095 0.11 0.24
RS 6 0.065 0.12 0.25
Table 2. RMSEP values for the concentrations of the investigated metalic ions in the prediction set
Model Cu2+ Mn2+ Zn2+
PCR 0.030 (6)a 0.028 (7)a 0.058 (5)a PLS 1 0.032 (5)a 0.026 (4)a 0.058 (5)a MLR-SPA 0.026 (14)b 0.022 (16)b 0.054 (7)b MLR-GAc 0.018 (12)b 0.030 (9)b 0.056 (7)b
61 Simultaneous Spectrometric Determination of Cu2+, Mn2+ and Zn2+
Vol. 16, No. 1, 2005
with MLR models which are simpler to calibrate and interpret than PCR and PLS models. With variable selection the number of wavelengths was significantly reduced from 61 to 16 at most for the manganese in MLR-SPA. In considering MLR-SPA and MLR-GA the former is advantageous since SPA is a deterministic algorithm, i.e., it always selects the same set of wavelengths among the original variables. On the contrary, GA is a stochastic algorithm and so it can result in a different set of wavelengths at the end of each run. It is important to note that the MLR-GA result presented in Table 2 corresponds to the best run out of 20. Moreover, SPA demands a smaller computational workload than GA for variable selection.
Conclusions
This paper demonstrated that the method of simultaneous multicomponent spectrometric analysis using PAR and multivariate calibration is successful for determination of Cu2+, Mn2+ and Zn2+ in real samples of a
polivitaminic/polimineral medicine, with a single spectrum for each sample and without prior treatment of the sample.
The results obtained using PCR and PLS were acceptable, which is in agreement with conclusions of the original paper.7 However with the optimization by the use
of algorithms for variable selection (SPA and GA), the building of MLR models was made possible. Among the models considered in this work, MLR models are advantageous for their simplicities, since models based on latent variables (PCR and PLS) may not have straightfoward physical interpretation. In comparing MLR-SPA and MLR-GA the first is the most indicated for simultaneous determination of the ions present in the samples studied, taking into account the computational time and the deterministic nature of the algorithm.
Acknowledgments
The authors are grateful to Dr. Edvan Cirino da Silva for his suggestions. The research fellowships granted by
the Brazilian agency CNPq and CAPES are greatly appreciated.
References
1. Araújo, M. C. U.; Saldanha, T. C. B.; Galvão, R. K. H.; Yoneyama, T.; Chame, H. C.; Visani, V.; Chemom. Intell. Lab. Sys. 2001, 57, 65.
2. Kompany-Zareh, M.; Massoumi, A.; Khajehshsrifi, H.;
American Lab. 2000, 32,20.
3. Kompany-Zareh, M.; Massoumi, A.; Fresenius J. Anal. Chem.
1999, 363, 219.
4. Iglesias, P. J.; Lago, S. H.; Solis, F. J. M.; Romero, C. J. M.; Rodriguez, G. V.; Anal Lett1997, 30, 317.
5. Collado, M. S.; Mantovani, V. E.; Goicoechea, H. C.; Olivieri, A. C.; Talanta2000,52, 909.
6. Dinç, E.; Baleanu, D.; Onur, F. J.; Pharm. Biom. Analysis
2001, 26, 949.
7. Saldanha, T. C. B.; Araújo, M. C. U.; Barros Neto, B.; Chame, H. C.; Anal. Lett. 2000, 33, 1187.
8. Gomez, E.; Estela, J.; Cerda, M. V.; Blanco, M.; Fresenius J. Anal. Chem.1992, 342, 318.
9. Otto, M.; Wegscheider, W.; Anal. Chem.1985, 57, 63. 10. CAMO AS; The Unscrambler User’s Guide 6.1; Norway, 1996. 11. Beebe, K. R.; Pell, R. J.; Seasholtz, M. B.; Chemometrics A
Practical Guide, Wiley-Interscience: New York, 1998. 12. Barros Neto, B.; Scarminio, I. S.; Bruns, R. E.; Como Fazer
Experimentos, 2nd ed., Unicamp: Campinas, 2003.
13. Box, G. E. P.; Hunter, W. G.; Hunter, J. S.; Statistics for Experimenters, John Wiley: New York, 1978.
14. Martens, H.; Naes, T.; Multivariate Calibration, John Wiley: London, 1993.
15. Dantas Filho, H. A.; Galvão, R. K. H.; Araújo, M. C. U.; Silva, E. C.; Saldanha, T. C. B.; José, G. E.; Pasquini, C.; Raimundo Jr., I. M.; Rohwedder, J. J. R.; Chemom. Intell. Lab. Sys. 2004,
72, 83.
Received: September 23, 2003
Published on the web: December 16, 2004