Printed in Brazil - ©2006 Sociedade Brasileira de Química 0103 - 5053 $6.00+0.00
A
r
ti
c
le
* e-mail: [email protected]
EQCM Behavior of Copper Anodes in Alkaline Medium and Characterization of the
Electrocatalysis of Ethanol Oxidation by Cu(III)
Thiago R. L. C. Paixão, Eduardo A. Ponzio, Roberto M. Torresi and Mauro Bertotti*
Instituto de Química, Universidade de São Paulo, 05508-900 São Paulo – SP, Brazil
A oxidação anódica de eletrodos de cobre em meio alcalino foi investigada utilizando-se voltametria, cronoamperometria, medidas de impedância eletroacústica e microbalança eletroquímica de cristal de quartzo (MECQ). Os experimentos foram realizados em soluções de NaOH na faixa de concentração de 0,1 a 3,0 mol L-1. A formação de espécies solúveis e insolúveis
como Cu(OH)42– and Cu
2O durante o processo de dissolução eletroquímica foi caracterizada
por estudos potenciodinâmicos e pela análise das relações entre massa e carga. Por outro lado, os resultados obtidos utilizando a MECQ não foram satisfatórios para confirmar a natureza das espécies de cobre propostas na literatura como CuO e Cu(OH)2, visto que há mudanças
viscoelásticas do filme eletrodepositado sobre o cristal de quartzo. A participação de espécies solúveis de Cu(III) no processo eletrocatalítico de oxidação do etanol foi caracterizada pelas medidas obtidas com a MECQ. Com estes dados foi possível propor um modelo para explicar o processo eletródico envolvendo a oxidação do etanol na superfície de cobre.
The anodic oxidation of copper electrodes in alkaline solutions was investigated by using voltammetry, chronoamperometry, impedance measurements and the electrochemical quartz crystal microbalance (EQCM). Experiments were carried out in NaOH solutions in the 0.1 to 3.0 mol L-1 concentration range. The formation of soluble and insoluble species such as Cu(OH)
4 2–
and Cu2O during the electrodic dissolution of copper anodes was characterized by analyzing potentiodynamic mass responses and the relationship between mass changes and charge. On the other hand, EQCM data were not effective to confirm the nature of other copper species proposed in literature named as CuO and Cu(OH)2 because of viscoelastic changes in the film
layer electrodeposited onto the quartz crystal. The participation of a Cu(III) soluble species in the electrocatalytic oxidation of ethanol was proved by EQCM measurements, data providing valuable information on the mechanism of the electrode process and formation of a Cu(II) insoluble species from the reaction of Cu(III) with ethanol.
Keywords: copper electrode, electrochemical quartz crystal microbalance, ethanol oxidation
Introduction
For active metallic electrodes such as copper, the electrodic process in alkaline medium involves the formation
of oxides of higher oxidative states, i.e., Cu(III),1 one of them
being proposed to behave as a redox mediator in
electrocatalytic processes.2-5 Accordingly, the anodic
oxidation of some compounds such as carbohydrates and small organic molecules (for instance, ethanol) is facilitated at copper surfaces, analytical methods with high sensitivity
being developed.3-5 Also, stable long-term detection in flow
systems is feasible, whereas pulsed potential waveforms are required to overcome fouling problems at other electrodic
surfaces such as glassy carbon, platinum and gold.6,7 Because
of these distinctive features, copper and copper-based electrodes have received considerable attention as they can
be used as amperometric detectors in liquid chromatography,8
capillary electrophoresis9 and FIA systems.3,10,11
Electrocatalytic reactions involving the anodic oxidation of substrates at copper surfaces have been largely investigated and a mechanism based on the mediation by
a Cu(III) species is the more accepted.2 By using rotating
ring-disc voltammetry, we have confirmed previous studies that suggest the formation of a free-soluble Cu(III) species by polarizing copper anodes in NaOH solutions at
relatively large positive potentials.4 Addition of ethanol
anodic signal owing to the electrocatalytic process. Analytical applications have been performed by using copper detectors for several compounds at both stationary
and flow conditions.3,4,8-12
Some attempts to understand the pathway of the formation of this electroactivelly Cu(III) species have involved the use of both electrochemical and surface
analytical techniques.13-15 Surprisingly, only a few reports on
the use of the electrochemical quartz crystal microbalance (EQCM) to investigate electrodic processes at copper surfaces have been found in literature, studies being performed in
moderately alkaline solutions (NaHCO3 + Na2CO3,16 borate
buffers17) and in 0.01 mol L-1 NaOH solution in the negative
potential region.18 Because the corrosion of copper anodes
in alkaline medium involves the formation of oxides, hydroxides and soluble species, the use of EQCM is certainly attractive. Accordingly, the aim of this work is to examine once again the electrochemical behavior of copper in NaOH solutions by comparing current information with mass changes as the potential is scanned in the region of oxides formation. Furthermore, results of some experiments to shed some light on the mechanism of the electrooxidation of ethanol at this electrodic material are also shown.
Experimental
Reagents
Solutions were prepared with deionized water processed through a water purification system (Nanopure Infinity, Barnstead). Analytical grade chemicals were used as received: sodium hydroxide (Dinâmica; São Paulo, Brazil), absolute ethanol (Merck; Darmstadt, Germany) and copper sulfate (Merck; Darmstadt, Germany).
Instrumentation
Measurements in all the experiments were performed in a conventional three-electrode electrochemical cell. The solution volume was 20 mL and the design of the
electrochemical cell has been described elsewhere.19 The
working electrode was a 6 MHz AT-cut piezoelectric quartz crystal with diameter of 25 mm and a piezo active
electrode area of 0.31 cm2. Both electrode sides were
previously evaporated with gold onto a chromium layer in order to improve adherence of gold onto the quartz substrate. Frequency resonance shift was transformed in
mass change using the Sauerbrey equation20 (
∆f = - K
∆m) where the integral sensitivity constant, K (6.5 x 10
7
g cm-2 Hz-1), was initially obtained by electrodeposition
from a copper sulfate solution (0.5 mol L-1) in an acidic
medium (H2SO4, pH = 1), and this value is in agreement
with that obtained when the calibration was carried out
by silver electrodeposition.21 This Cu(II) solution was also
used to obtain the copper electrodes used in all experiments, the electrodeposition of copper being performed at E = -0.1V for 30 minutes. The verification of the copper deposition was accomplished by measuring
the charge/mass ratio (3.31 x 10⁻⁴ g C-1), that corresponds
to a molar mass of 63.9 g mol-1. This value is in agreement
with the theoretical one (63.54 g mol-1), indicating the
efficacy of the copper electrodeposition. This procedure was carried out before each electrochemical experiment, previous copper layers being removed by immersing the
electrode in a 10% (v/v) HNO3 solution. A Ag/AgCl
(saturated KCl) and a platinum wire were used as reference and auxiliary electrodes, respectively. Electrochemical experiments were carried out with a model PG 3901 Omnimeta potentiogalvanostat. Frequency shifts during the potential scan were measured by using a Stardford Research Systems analyzer, model SR 620, connected to a microcomputer for data acquisition. Electroacoustic impedance measurements (EAI) experiments were carried out with a HP 4194A impedance analyzer, with working frequency range of 5 Hz to 13 MHz. In these experiments, an alternating voltage (± 0.3 V) of a specific frequency was applied to the quartz-crystal. The phase and amplitude of the ac current were measured and used to calculate various parameters related to the mechanical impedance of the crystal. The frequency range typically scanned in these experiments was ± 30 kHz around the fundamental resonance frequency, 6 MHz, using frequency steps between 10 and 50 Hz, depending on the width of the frequency resonance. Previous reports have detailed the dependence of the mechanical impedance of
quartz-crystals on both film and solution properties.22,23 Using
locally built electrochemical cells and instrumentation, it is possible to make such measurements while one face of the quartz-crystal is in an electrolytic solution and under
potential control, allowing the in situ investigation of the
mechanical impedance of the various copper oxide species electrodeposited onto the electrode surface.
Results and Discussion
Electrochemical behavior of copper electrodes in NaOH supporting electrolyte
Experiments in 1 mol L-1 NaOH solutions. Copper surfaces
are free of oxides at potentials more negative than ca.
–0.5 V vs Ag/AgCl in NaOH solutions at conventional
potential to more positive values, layers of oxides, hydroxides and free-soluble copper species in the I, II and III oxidation states are generated. Furthermore, interconvertion between different copper species, ageing phenomena, porosity of the films, formation of passivating layers and nature of mass transport of hydroxide ions to the electrode surface and their local concentration are all aspects that influence the current response in electro-chemical experiments carried out with copper electrodes
in alkaline medium.24-26 Literature27 on this subject covers
both kinetics and structural aspects, even though some apparent discrepancy still remains, especially in the case of the participation of a Cu(III) species in electrocatalytic processes.
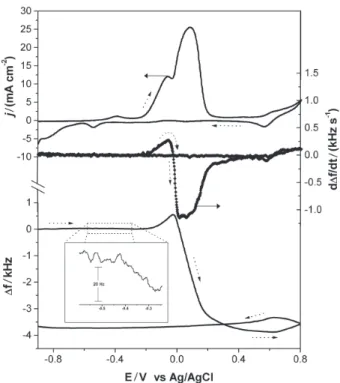
In order to exemplify this complex behavior, Figure 1 shows a typical voltammetric curve obtained by sweeping the potential from a region where the copper surface is free of oxides (-0.9 V) to the positive potential region. By measuring simultaneously frequency shifts as the potential
is scanned, both d∆f/dt and ∆f can be calculated as shown
in Figure 1. Mass change values can be determined by
using the Sauerbrey equation20 as mentioned in the
experimental section. With values of ∆m and charge
obtained from the cyclic voltammetry, information on the chemical composition of the species formed on the surface of the electrode can be acquired by using the charge, mass change and the Faraday law. Notwithstanding, it is well known that quartz-crystal frequency changes can be
influenced by redox induced changes in the viscoelastic
properties of the films being investigated.23 Thus, in order
to confirm that the Sauerbrey relationship can be used to calculate mass changes from the frequency changes observed during EQCM experiments, it is important to confirm that the thin films being investigated behave rigidly. With this in mind, EAI measurements were made for both a bare quartz-crystal electrode and a quartz-crystal electrode after electrodeposition of a thin copper film. These measurements were performed in all of the various electrolyte systems that were investigated, open circuit conditions being used for both bare and copper electrodeposited electrodes. In the case of the redox transformation onto the copper film, EAI experiments were carried out at open circuit condition after applying a potentiodynamic perturbation in order to produce the redox change. The potential-time protocol is shown in Figure 3 (insert).
Figure 1. Cyclic voltammetry (—), ∆f (—) and d∆f/dt (--) vs potential plots for a copper electrodeposited quartz-crystal during the potential scan in 1 mol L-1 NaOH supporting electrolyte. Scan rate: 50 mV s-1.
Figure 2. Conductance spectra of a quartz-crystal (a) and a quartz-crys-tal after copper electrodeposition (b) in a 0.5 mol L-1 copper sulfate solu-tion (deposisolu-tion solusolu-tion). Scan rate: 50 mV s-1.
Figure 2 shows conductance spectra for a
quartz-crystal electrode in 0.5 mol L-1 copper sulfate solution
(pH = 1) before (curve a) and after electrodeposition of a copper layer (curve b). Full width values at half
maximum of the conductance peaks (∆ffwhm) are slightly
different for both electrodes (2960 Hz for bare and 2840 Hz for electrodeposited copper). The frequency
maximum (fo) of the conductance plot suffers a
diminution of approximately 12 kHz associated with the mass increase produced by the copper electrodeposition. The quality factor is often a useful measure of the loss of mechanical energy from the vibrating crystal to the
film or solution.23 It can be defined as Q = f
o/∆ffwhm and
Q values are virtually the same for both electrodes (~ 2050). For crystals of the design used in this work, quality
factors in air can approach 104. The relatively low values
observed for the quality factor in all of these solutions is attributed to the viscosity. The value of conductance at
the peak maximum, Gmax, was monitored for both
electrodes. Differences of less than 1% were observed.
Since Gmax is inversely proportional to the film
viscosity,22,23 it is possible to conclude that the metallic
copper deposit behaves as acoustically rigid. Thus, these results validate the use of the Sauerbrey equation for mass calculations based on EQCM frequency data in these conditions.
Figure 3 shows the conductance spectra of electro-deposited copper in NaOH solution at different redox states according to the potential-time protocol shown in the insert. Curve a exhibits the conductance spectrum at open circuit conditions before electrochemical treatment in this solution. If this spectrum is compared with that of Figure
2 (curve b), there is an increase in fo and ∆ffwhm but a
diminution of Q (~1500) and these changes can be assigned to a change in the viscosity of the electrolyte solution (from copper sulfate to NaOH). As indicated in Figure 3 (insert), a potential sweep starting at -0.9V until
-0.3V at 50 mV s-1 was applied and after that the circuit
was opened, the conductance spectrum being then registered (curve b). Both spectra (a and b) are similar indicating that there are no viscoelastic changes after polarization of the electrode at this potential value. Then,
a potential sweep from -0.3V to -0.1V at 50 mVs-1 was
applied and the conductance spectrum was taken after this treatment at open circuit condition (curve c). Comparing
with curve b, there is an increase of fo in
~ 570 Hz, showing a mass diminution associated with an electrodic dissolution process. The Q value was ~ 2100
and there is a diminution of ~ 5% of Gmax; so, it is possible
to conclude that in this potential region, the Sauerbrey equation can be used to transform frequency shifts in mass
change. After this experiment, the potential was swept until 0.1V and the circuit was opened. Curve d shows the conductance spectrum obtained in this condition. There
is a diminution of fo and also a diminution of Q (~756)
and Gmax (0.84 mS), clearly indicating a mass increase.
However, the large decrease of Q and Gmax compared with
curve c suggests that important viscoelastic and/or surface roughness changes are provoked owing to the formation of copper oxides and/or hydroxides. Therefore, at these experimental conditions the relationship between frequency changes and electrode mass is not valid and no conclusions on the extent of reactions occurring at this potential value can be done. Finally, the potential was swept until 0.6V and the conductance spectrum was again obtained at open circuit conditions. As can be seen in Figure 3 (curve e), the conductance spectrum is similar to that of curve d, showing that during this electrochemical
treatment no significant changes in Q and Gmax occur.
Hence, in this region the Sauerbrey equation can be again used for mass calculations.
During the positive sweep toward positive potentials, three main anodic processes should be discussed in Figure 1: the oxidation of Cu to Cu(I) and Cu(II) at around –0.4V and 0 V, respectively, and the further
generation of Cu(III) at more positive potentials (ca. 0.6
V). More detailed information on these electrodic reactions follows below:
i)Peak at around –0.4 V: this current peak is attributed to
a Cu/Cu(I) redox couple. In the literature24 this process
has been ascribed as
2Cu + 2 OH– Cu
2O + H2O + 2 e
– (1)
The insert in Figure 1 shows a very small decrease in
frequency, i.e. increase in mass, in this potential region,
compared with the process at more positive potentials.
By calculating the theoretical ∆m/q ratio (using
equation 1), a value of 8.2 x 10⁻⁵ g C-1 is obtained. This
result is close to that obtained from Figure 1 with an
experimental value of 9.0 x 10⁻⁵ g C-1, confirming the
formation of Cu2O.
ii) Peaks at around 0 V: in this potential region, two
anodic processes are observed with Epa1 = -0.05 V
and Epa2 = 0.10 V. ∆f vs. potential curve in Figure 1 shows
an initial small increase in frequency (mass diminution) and then a remarkable frequency decrease (mass increase) at potentials corresponding to a second process. The dissolution of the copper electrode in alkaline supporting electrolyte has been ascribed as
Cu + 4 OH– Cu(OH)
4
leading to a theoretical ∆m/q = -3.29 x 10⁻⁴ g C-1. By analysis
of the data at the foot of the anodic wave (in the range -0.2 to -0.1 V, where the Sauerbrey equation may be used),
∆m/q was found to be -3.21 x 10
-4 g C-1, confirming the
nature of the free-soluble Cu(II) generated at this experimental condition. The increase in the electrode mass at slightly more positive potentials is caused by the
deposition of a mixture of copper(II) oxide (CuO, Ks =
7.8x10⁻²¹)27 or hydroxide (Cu(OH)
2, Ks = 1.6 x 10
-19).27 This
is a consequence of both the increase of the extent of the copper oxidation and the reduction of the local concen-tration of hydroxide ions at the interfacial region, as
suggested in a previous work.28
The d∆f/dt vs. potential curve presented in Figure 1
also demonstrates the relationship between the oxidation processes with the decrease and increase in frequency.
Positive values of d∆f/dt are observed in the potential
region that corresponds to the dissolution process and this a clear indication of formation of soluble species. For more
positive potentials, d∆f/dt changes sign going to negative
values, indicating a modification of the redox reaction towards the formation of insoluble species as described in equations 3 and 4:
Cu + 2OH– CuO + H
2O + 2e
– (3)
Cu + 2OH– Cu(OH)
2 + 2e
– (4)
There is some discrepancy in literature to claim the nature of the non-conductive Cu(II) species (CuO or
Cu(OH)2).29,30 Spectroscopy data derived for a similar
system support the idea that a mixed oxide/hydroxide copper is formed during the anodic oxidation, the top layer
being Cu(OH)2.29 From energy dispersive X-ray
spectroscopy results,4 we have already proposed that a
layer of CuO is formed firstly during a potential scan to the positive direction. The formation of a passivating layer
composed of Cu(OH)2 at more positive potentials depends
on experimental conditions such as the rate of the electrodic process, temperature and the kinetics of the equilibrium involving the hydration process of CuO
according to the following equation:24,27
CuO + H2O Cu(OH)2 (5)
iii) At around 0.6 V: the further oxidation of Cu(II) to Cu(III) at more positive potentials has been proposed to explain this oxidative step. The frequency increase (reduction of the mass of the electrode) as indicated by
d∆f/dt values (Figure 1) suggests that a soluble species is
formed. However, RRDE studies1,3,4 have indicated that
very low collection efficiency values are obtained at this potential region, suggesting that soluble and insoluble materials are simultaneously or competitively formed according to the following two possible equations:
CuO + 2 OH– CuO
2 – + H
2O + e
– (6)
2CuO + 2 OH– Cu
2O3 + H2O + 2e
– (7)
In both equations CuO was considered to be the precursor of Cu(III), in agreement with results obtained from EDS results of various copper films grown at different
potentials.4 Theoretical
∆m/q values related to the
formation of Cu(III) (equations 6 and 7) were calculated
as –8.2 x 10⁻⁴ and 0.8 x 10⁻⁴ g C-1, respectively. These
values are significantly different from the one
experimentally found (-3.7 x 10⁻⁴ g C-1), suggesting that
both reactions described by equations 6 and 7 are likely responsible for the anodic process at around 0.6 V. By
using the theoretical ∆m/q values calculated from
equations 6 and 7 and the experimental one, it was possible to conclude that both reactions contribute at the same
extent, i.e., 50%, to the anodic process at 0.6 V. This
supposition reinforces the conclusion from previous
RRDE voltammetric experiments,3,4 where collection
efficiency values measured at 0.6 V were lower than those
obtained with Fe(CN)64–, an electroactive species whose
oxidation product is stable and free-soluble in solution.
Influence of the electrolyte concentration
The influence of the concentration of hydroxide ions on the electrochemical profile was investigated by recording frequency shifts during potential scans at three different experimental conditions. Figure 4 shows that the frequency increase (mass diminution) at around 0 V is more pronounced when the NaOH concentration increases. This fact means that the formation of free-soluble copper ions at this potential region is facilitated at more alkaline solutions, as indicates the remarkable frequency increase observed in these curves. Finally, frequency shifts at the 0.6 V potential region are
also more noticeable at 3 mol L-1 NaOH electrolyte, a
condition that favors the formation of free-soluble Cu(III) species.
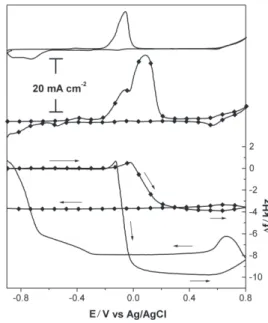
Time influence on the growth of the films
In order to investigate the effect of the scan rate on the anodic oxidation of copper electrodes, experiments
were performed at 5 and 50 mV s-1. Charge values
87 and 35 mC for voltammetric experiments recorded at
5 and 50 mV s-1, respectively. This is in agreement with
results presented in Figure 5, where frequency changes are noticed to be large at the lower scan rate. This would be expected as a consequence of the sudden change of the reaction path from formation of a soluble to an insoluble material, which is then continuously accumulated at the electrode interface.
Figure 5 also indicates a strong dependence of the electroreduction profile on the scan rate. For instance, at
the higher scan rate (50 mV s-1) the electrode loses material
at the end of the experiment, which suggests the existence of a time effect on the passivating layer growth. Hence, it is reasonable to suppose that the electroreduction profile depends on the history of the oxide layer and the equilibrium between its components, results in the
literature30 reporting similar conclusions. This is reinforced
by analyzing the frequency curve obtained at 5 mV s-1,
which demonstrates that the initial frequency is restored at the quartz crystal at the end of the potential sweep. Hence, the very sluggish equilibrium between oxide and hydroxides layers is likely to be disturbed in experiments performed at relatively large time windows.
Some preliminary experiments were carried out to observe the effect of time on the frequency shifts at potentiostatic conditions. For instance, at –0.2 V (Figure 6A) a small frequency increase accompanied by a sudden frequency decrease is observed, suggesting that as the local
hydroxide ions concentration decreases to form Cu(OH)42–,
the formation of insoluble Cu(II) species is initiated. At more positive potentials, the effect of a more pronounced copper
oxidation prevails and the formation of CuO and Cu(OH)2
occurs almost instantaneously (curves B, C and D). The amperometric profile shown in the insert of Figure 6 indicates that frequency shifts at this potential region occur essentially due to the electrode corrosion, no chemical transformation
from CuO to Cu(OH)2 due to a hydration process (equation
5) being noticed during the open-circuit step. Curves E and F, obtained at sufficiently positive potentials, confirm the formation of a passivating layer that restrains the electron transfer process.
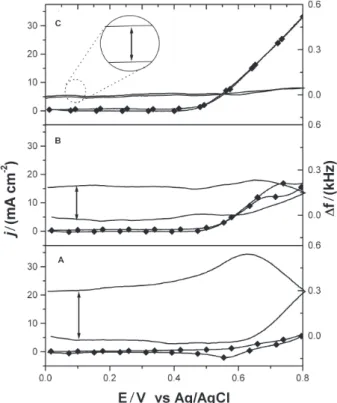
Anodic oxidation of ethanol at copper surfaces
The mediation of the anodic oxidation of ethanol by a free-soluble Cu(III) species has already been postulated
by voltammetry with RRDE3,4, as signals at the ring (due
to the reduction of free-soluble Cu(III) electrogenerated at the disc) decrease as the concentration of ethanol increases. We have investigated this electrode process by monitoring frequency shifts during the anodic process in
1 mol L-1 NaOH solutions before and after addition of
ethanol (0.17 and 0.85 mol L-1). From voltammograms in
Figure 7 it is possible to confirm the participation of a copper species in the electrode process involving the oxidation of ethanol, as a large anodic current enhan-cement associated with the disappearance of the cathodic signal (at 0.55 V in Figure 7A) is observed upon addition of ethanol to the NaOH solution.
The frequency shift measured from the beginning to the end of the potential scan increases and corresponds
to a mass diminution of 16 μg cm-2 (measured at 0.1 V
Figure 4. Frequency plots for a copper electrodeposited quartz-crystal in NaOH solutions of different concentrations: 0.1 (A), 1 (B) and 3 (C) mol L-1. Scan rate: 50 mV s-1.
as indicated in Figure 7A). When ethanol is added to the
solution a mass diminution of 11 μg cm-2 is observed
(Figure 7B). No significant frequency shift was observed at the more concentrated ethanol solution (Figure 7C). This is a clear indication that in the absence of ethanol (Figure 7A) the electrode suffers a dissolution process due to the formation of a free-soluble species (Cu(III)) in the forward scan. As the potential is reversed, the material not lost to the bulk solution may be reduced to an insoluble species and a partial mass recovery is observed. However, the chemical reduction of this copper oxidized species by ethanol occurs more efficiently if ethanol is added to the solution. Hence, the loss of Cu(III) to the solution is less effective and the frequency shifts is smaller in comparison to the experiment carried out in the absence of ethanol. Accordingly, curve C corresponds to a situation where the amount of ethanol in solution is so high that all material generated in the
positive scan is reduced in the negative scan, i.e., the
large concentration of ethanol ensures that the reaction layer is small compared to the diffusion layer.
Based on chromatographic and differential electro-chemical mass spectrometry experiments, some authors have reported that the oxidation of ethanol at copper electrodes leads to the formation of acetate in a four-electron process, acetaldehyde being a likely by
product.2,31 Based on the conclusions above mentioned,
a scheme for the electrocatalytic oxidation of ethanol at copper surfaces in alkaline medium has been proposed taking into consideration some suggestions on a similar
process carried out at gold surfaces.32 The proposed
mechanism involves the anodic oxidation of CuO in a first step (equation 7) followed by an O-transfer reaction
from the electrochemically generated CuO2– species to
ethanol. Being an electrophile, this Cu(III) species promotes the loss of water from the ethanol molecule and leads to the formation of acetate and the redeposition of CuO, this redeposition of an insoluble species being not reported in the literature. This proposed scheme showed below for the electrode process is in agreement with results in Figure 7C, where almost no mass change is observed during the voltammetric experiment owing to the regeneration of CuO.
Figure 6. Frequency plots for amperometric studies in a 1 mol L-1 NaOH solution with a copper electrodeposited quartz-crystal at different poten-tials: -0.20 (A), -0.15 (B), -0.10 (C), 0(D), 0.10 (E) and 0.60 V vs Ag/AgCl (F). Insert shows an amperometric study performed at –0.10 V vs Ag/AgCl, an open-circuit condition being imposed between points a and b.
Figure 7 – Cyclic voltammetry (--) and ∆f (—) vs potential plots for a copper electrodeposited quartz-crystal in 1 mol L-1 NaOH solution be-fore (A) and after addition of ethanol to give the following final concen-trations (mol L-1) = 0.17 (B) and 0.85 (C). Scan rate: 50 mV s-1.
Conclusions
By using an electrochemical quartz crystal microbalance we have demonstrated that Cu(I) and Cu(II) oxides and hydroxides have been formed at specific experimental conditions during the electrodic dissolution of copper electrodes in NaOH solutions. The first steps in the anodic
process involve the formation of Cu2O and Cu(OH)42–,
evidenced by EQCM data. Followed by the mass loss caused by the dissolution of copper and generation of a Cu(II) soluble species, a remarkable frequency decrease is observed as a
consequence of the formation of CuO and Cu(OH)2 owing
to the increase in the Cu(II) concentration at the vicinity of the electrode surface and the concurrent consumption of hydroxide ions. The composition of this film layer is dependent on experimental parameters such as hydroxide concentration, kinetics of the copper anodic oxidation and phase formation through nucleation and growth mechanisms. The generation of a soluble Cu(III) species from CuO at more positive potentials and its participation in the anodic oxidation of ethanol was definitely characterized by EQCM experiments, which also indicated that CuO can be entirely regenerated in the electrocatalytic process depending on the ethanol concentration.
Acknowledgments
Authors are grateful to FAPESP (Fundação de Amparo à Pesquisa do Estado de São Paulo and CNPq (Conselho Nacional de Desenvolvimento Científico e Tecnológico) for the financial support.
References
1. Miller, B.; J. Electrochem. Soc. 1969, 116, 1675.
2. Fleischman, M.; Korinek, K.; Plechter, D.; J. Chem. Soc., Perkin
Trans. II 1972, 1396.
3. Paixão, T. R. L. C.; Corbo, D.; Bertotti, M.; Anal. Chim. Acta
2002, 472, 123.
4. Paixão, T. R. L. C.; Bertotti, M.; J. Electroanal. Chem. 2004,
571, 101.
5. Luo, M. Z.; Baldwin, R. P.; J. Electroanal. Chem. 1995, 387, 87.
6. Iwasita, T.; Rasch, B.; Cattano, E.; Vielstich, W.; Electrochim. Acta 1989, 34, 1073.
7. Beden, B.; Morin, M.-C.; Hahn, F.; Lamy, C.; J. Electroanal.
Chem. 1987, 229, 353.
8. Callul, M.; Lopez, E.; Marce, R. M.; Olucha, J. C.; Borrull, F.;
J. Chromatogr. 1992, 590, 215.
9. Ye, J.; Baldwin, R. P.; J. Chromatogr. 1994, 687, 141.
10. Quintino, M. D. M.; Corbo, D.; Bertotti, M.; Angnes, L.; Talanta
2002, 58, 943.
11. Corbo, D.; Bertotti, M.; Anal. Bioanal. Chem. 2002, 374, 416. 12. Paixão, T. R. L. C.; Matos, R.; Bertotti, M.; Electroanalysis
2003, 15, 1884.
13. Sánchez, M. P.; Barrera, M.; González, S.; Souto, R. M.; Salvarezza, R. C.; Arvia, A. J.; Electrochim. Acta1990, 35, 1337.
14. Malvault, J. Y.; Lopitaux, J.; Delahaye, D.; Lenglet, M.; J. Appl.
Electrochem. 1995, 25, 841.
15. Moll, D. V.; de Chialvo, M. R. G.; Salvarezza, R. C.; Arvia, A.
J.; Electrochim. Acta 1985, 30, 1011.
16. Zhou, A.; He D.; Xie, N.; Xie, Q.; Nie, L.; Yao, S.; Electrochim. Acta 2000, 45, 3943.
17. Bertocci, U.; Electrochim. Acta 2004, 49, 1831.
18. Matsuoka, O.; Ono, S. S; Nozoye H.; Yamamoto, S.; Surf. Sci.
2003, 545, 8.
19. Varela, H.; Malta, M.; Torresi, R. M.; Quim. Nova 2000, 23, 664.
20. Sauerbrey, G.; Z. Phys. 1964, 178, 457.
21. Gabrielli, C.; Keddam, M.; Torresi, R.; J. Electrochem. Soc. 1991, 138, 2657.
22. Martin, S. J.; Granstaff, V. E.; Frye, G.C.; Anal. Chem. 1991,
63, 2272.
23. Buttry, D. A.; Ward, M. D.; Chem. Rev. 1993, 92, 1355. 24. Shoesmith, D. W.; Sunder, S.; Bailey, M. G.; Wallece, G. J.;
Stanchell, F. W.; J. Electroanal. Chem. 1983, 143, 153. 25. de Chialvo, M. R. G.; Marchiano, S. L.; Arvia, A. J.; J. Appl.
Electrochem. 1984, 14, 165.
26. Dong, S.; Xie, Y.; Cheng, G.; Electrochim. Acta 1992, 37, 17. 27. Pourbaix, M. In Lectures on Electrochemical Corrosion
translated by J.A.S. Green, translantion edited by R.W. Staehle, 3rd ed., expanded Imprenta Houston, NACE Internacional: NY, 1995, pp. 110 – 143.
28. Shoesmith, D. W.; Rummery, T. E.; Owen, D.; Lee, W.; J.
Electrochem. Soc. 1976, 123, 790.
29. Pyun, C.-H.; Park, S. M.; J. Electrochem. Soc. 1986, 133, 2025. 30. Becerra, J. G.; Salvarezza, R. C.; Arvia, A.J.; Electrochim. Acta
1988, 33, 613.
31. Pereira, M. G.; Jiménez, M. D.; Elizalde, M. P.; Manzo-Robledo, A.; Alonso-Vante, N.; Electrochim. Acta2004, 49, 3917.
32. Tremiliosi-Filho, G.; Gonzalez, E.R.; Motheo, A.J.; Belgsir, E.M.; Le´ger, J.-M.; Lamy, C., J. Electroanal. Chem.1998,
444, 31.
Received: August 18, 2005 Published on the web: February 22, 2006