The Fitness of Assumptions and an Alternative Model for Funding the
Public Sector Pension Scheme: The Case of Rio Grande do Sul*
Paulo Roberto Caldart
Bachelor in Actuarial Science and Statistics, Paranaprevidência, Curitiba e-mail: [email protected]
Silvia Teixeira da Motta
Bachelor in Actuarial Science, Secretariat of Finance of the State of Rio Grande do Sul, Porto Alegre e-mail: [email protected]
Marcelo Abi-Ramia Caetano
PhD in Economics, Department of Social Studies and Policies, Institute of Applied Economic Research , Brasília e-mail: [email protected]
Taís Vieira Bonatto
Bachelor in Actuarial Science, Tax Auditor of the State Revenue Service, Secretariat of Finance of the State of Rio Grande do Sul, Porto Alegre e-mail: [email protected]
Received on 12.2.2013 – Desk Acceptance on 12.6.2013 – 3rd version accepted on 8.21.2014.
ABSTRACT
The research presented herein has two objectives. First, this study will test whether actuarial assumptions for public sector pension sche-mes in Brazil adhere to reality and whether changing these assumptions might affect the results, particularly with respect to life tables and wage growth assumptions. The paper shows that the best fit life table is AT 2000 for males aggregated by one year, which involves a longer life expectancy than the life table proposed under current legislation (IBGE 2009). The data also show that actual wage growth was 4.59% per year from 2002 to 2012, as opposed to the 1% wage increase proposed by the same legislation. Changing these two assumptions increases the actuarial imbalance for a representative individual by 18.17% after accounting for the adjusted life table or by 98.30% after revising the wage growth assumption. With respect to its second objective, this paper proposes alternative funding mechanisms in which the local pension scheme will provide the funded component of the benefit that would be complemented by local government in a pay--as-you-go manner. The database utilized was for the state of Rio Grande do Sul in the month of November 2011. The results are thus restricted to Rio Grande do Sul.
Keywords: Pensions for public employees. Pension funding. Rio Grande do Sul.
DOI: 10.1590/1808-057x201412200
1 INTRODUCTION
he impact of pensions on public inances in Europe has been under discussion for some time, although this discussion has generally focused on the perspective of the general pension system and is not necessarily limited to the public employee pensions. For example, Feldstein and Sie-bert (2002) discuss how 10 European countries faced the conlict between generous pension promises and projected changes in demographic structure at the beginning of the 21st century.
he pension system in the Brazilian states is organi-zed into RPPSs and managed by an agency that operates all the parts of the system, including the provision and maintenance of pension beneits and administration of inancial resources.
he irst major step toward standardizing and developing guidelines for the RPPSs was the passage of Act no. 9717 (1998). Until that time, the lack of regulation allowed the pu-blic sector pension system to be addressed in a personal and intuitive manner, with no minimum or mandatory technical evaluation that might illuminate the reality of pension com-mitments made by the entities that created their own RPPSs. Shortly thereater, Ordinance no. 4992 (1999) regulated Act no. 9717 (1998) by establishing minimum and maxi-mum parameters to be used for the RPPS actuarial valu-ation process. To replace Ordinance no. 4992 (1999), the Brazilian Ministry of Social Security (Ministério da Previ-dência Social - MPS) issued Ordinance no. 403 (2008), whi-ch establishes new guidelines for parameters acceptable in performing actuarial valuations.
he regulatory premise established by Ordinance no. 403 (2008) with respect to maintaining a pension system with inancial and actuarial balance in the RPPSs assumes that there will be a inancial regime to fund the system; however, according to Nogueira (2012), this funding has not met the levels required to ensure long-term balance.
In a theoretical study on the regulatory policy of Bra-zilian RPPSs, Calazans and Caetano (2013) claim that the substantial number of RPPSs and the sheer size of the coun-try hinder the regulation of state employee pensions. hese authors thus propose alternatives – including self-regulation and social regulation – as complements to the current ins-truments of restraint and sanction. According to Avritzer (2008), beginning in the 20th century, Brazil has become a
country with a high degree of participatory propensity, but the study does not refer to RPPSs. In turn, Silva, Jaccoud and Beghin (2005) point to the limitations of management coun-cils as decision-making bodies.
he funding process established for the RPPSs through legislative guidelines has origins in the experience of the funding of private pension systems, which are called pen-sion funds. However, there is a striking diference between funding part of some remuneration (complementary pen-sion) structured under the strict rules of a private entity and funding the full beneits of public employees who have labor relations that are distinct from those of the private sector. he objective of the present study is to discuss whether
parameters commonly used in actuarial valuations adhe-re to adhe-reality and how adopting moadhe-re adhe-realistic assumptions with respect to these parameters afects actuarial results and projections.
he study also proposes a mixed funding plan for new public employees as a solution for problems involving con-tributions to funds that may be experienced by the Pension Regimes for Government Workers (Regimes Próprios de Previdência Social - RPPSs). he rationale for this propo-sal emerged from the observation of the political context in which the RPPSs are inserted into states and municipalities and into the peculiarities of public sector pension schemes.
he analytical and mathematical system developed in this study includes mechanisms typically used in actuarial valuations. Based on the parameters chosen, this system should relect the value of the mathematical reserve and of the projections for annual pension revenues and expenditu-res – both individual and collective – of the RPPS benei-ciaries. hese techniques can be observed in several studies, such as Vilanova (1969), Bowers, Gerber, Hickman, Jones and Nesbitt (1986), Jordan (1967) and Galé (1977). To per-form these simulations, data regarding the RPPS beneicia-ries in the state of Rio Grande do Sul, Brazil for the month of November 2011 were used. Accordingly, any and all results presented in this study are restricted to the pension reality of the state of Rio Grande do Sul and cannot be generalized to other federal entities in Brazil because the only database analyzed belonged to that state.
he Brazilian states are currently responsible for main-taining their own public pension systems that guarantee re-tirement and pension beneits to their public employees. A balanced pension system is vital for the iscal sustainability of the federal units. Covering pension deicits leads to in-creasing budget commitments for these states and results in concurrent losses to other operating areas of the state.
Studies indicate that the pension system consumes a large portion of Brazilian public savings (Giambiagi, 2009; Giambiagi, Zylberstajn, Afonso, Souza, & Zylberstajn, 2007; Velloso, Freitas, Caetano, & Cândido, 2013). Caetano (2013) shows that the total expenditures of the pension system in Brazil account for 11% of the Gross Domestic Product (GDP) and that reforms are necessary with respect to esta-blishing the minimum age, the formula for calculating death pension beneits and beneits indexation rules, particularly for the minimum wage policy and for the expansion of RPPS reforms, which is the focus of this study.
he funding of most of these pension funds began in the 1970s and 1980s at a time when the factors that inluence this process seemed more favorable. For example, at that time, there was a smaller proportion of beneiciaries in rela-tion to active worker and there was typically a larger return on inancial investments (Pinheiro, 2007).
With the problems thus identiied, the present study seeks to clarify that implementing and maintaining fun-ding schemes similar to those of the private sector without proper conceptual adequacy for public sector pensions is not feasible. For these public sector pension plans, it is ne-cessary to formulate alternatives that facilitate maintaining a funding system for the RPPSs based on the principle of
respecting the overall context in which all parties are invol-ved: the federal entity, the public employees and the mana-gement agency.
his study is divided into four sections, including this introduction. Section 2 describes the actuarial methodolo-gy adopted. In section 3, tests are performed that measure whether the assumptions of the life table and wage growth adhere to the pension reality in the state of Rio Grande do Sul. Section 4 presents individual and collective simula-tions of the mixed plan in alternative scenarios. Finally, the conclusions are discussed in section 5. At the end of this article, an appendix describes the mathematical methodo-logy adopted.1
2 METHODOLOGY
his study was conducted in two phases: (1) the irst phase features a study of the legally required minimum and maximum actuarial parameters and of the impact that more realistic parameters have on the actuarial results; (2) the se-cond phase develops a mixed funding plan to perform indi-vidual and collective simulations based on the actual records of the RPPS beneiciaries in the state of Rio Grande do Sul.
First, the individual and combined efects of actuarial parameters were studied, including life tables and wage growth igures that were more closely itted to reality. Fur-thermore, there was a discussion as to whether adopting the current minimum and maximum parameters establi-shed by Ordinance no. 403 (2008) relects the reality of fu-ture RPPS commitments.
he mixed plan that was created in the second phase of this study was developed with the intention of solving a serious problem related to public pension funding sche-mes: adopting contribution rates that are below the per-centage necessary to be fully funded. his practice com-promises the solvency of the fund and afects the payment of future beneits.
his plan simulates a scenario in which the pension con-tribution rate of 11% (the minimum required) will be main-tained for public employees and the corresponding entity.
At the time when the pension beneit is granted, the reserve formed by the sum of the employee’s own contributions, the employer’s contribution and the inancial return obtained will be checked for each public employee. From this calcu-lation, the value of the beneit that the fund will be able to pay out based on the amount that was actually funded for that public employee will be calculated. If the beneit that the public employee is entitled to exceeds the value of the beneit funded, the State Treasury will supplement the di-ference directly through a transfer to the RPPS; otherwise, the equating contribution shall be addressed as outlined in Ordinance no. 403 (2008).
Individualized simulations were also performed to che-ck the value actually funded during the public employee’s work period.
Finally, the study used data from the beneiciaries in the state of Rio Grande do Sul for the reference period of No-vember 2011 to collectively examine the assumptions adop-ted for the individual projections.
he simulations were performed on an actuarial system in which the pension policy governing the provision of be-neits – and the methods used to verify adherence to the biometric and inancial assumptions used in the projections – was observed.
3 ACTUARIAL PARAMETERS
he actuarial parameters can be divided into inancial and biometric parameters, such as interest rates and life ta-bles, respectively. he use of these parameters is indispen-sable in the actuarial valuation processes of pension entities because they provide the basic probabilistic tools required to generate the valuation process (Vilanova, 1969).
he choice of appropriate actuarial parameters is crucial given that the results observed by actuarial valuations in funding schemes express the status of the entity and guide corrective actions if future inancial shortfalls are identiied.
Through Ordinance no. 172 (2005), the MPS began requiring the Certificate of Pension Compliance ( Certi-ficado de Regularidade Previdenciária - CRP), which is, in summary, a document that attests the entity’s practice of routine procedures that are indispensable to pension issues of its RPPS.
Currently, Ordinance No. 403 (2008) establishes the minimum and maximum parameters to be used in actu-arial valuations of RPPSs. Table 1 presents some of the key parameters provided in the ordinance.
Next, the actuarial parameters required by law will be analyzed, in addition to their adequacy for the RPPSs in the specific case of the state of Rio Grande do Sul.
3.1 General Life Table.
he general life table, according to Rodrigues (2008), represents the efects of the lifespans of beneiciaries on the calculations of costs in public or private pension plans. Rodrigues (2008) also indicates that the life table is an eicient tool to measure these costs.
According to a note about the 2010 Census released by the Brazilian Institute of Geography and Statistics ( Insti-tuto Brasileiro de Geograia e Estatística - IBGE, 2010a), in 50 years (1960-2010), the life expectancy of Brazilians increased 25.4 years, from 48.0 to 73.4 years. By contrast, the mean number of children per woman decreased from 6.3 to 1.9 during this period, which is below the replace-ment level of the population. hese changes altered the age pyramid, narrowing the base and widening the top, pointing toward an aging population structure that is cha-racteristic of more developed countries (IBGE, 2010a).
3.1.1 Comparison between Life Tables.
he use of the minimum life table (IBGE-09) is justiied by the diiculty of performing adherence tests to choose the life ta-ble most appropriate for the RPPS beneiciary population, whi-ch is mainly due to the diiculty in obtaining consistent records.
he IBGE life table is designed by considering the ge-neral population (IBGE, 2010b) of all Brazilian states and municipalities, including parts of the population that are unemployed and are unable to access adequate health care or even basic sanitation in their homes.
Longevity conditions speciic to public employees from entities with some social structure are assumed to be bet-ter than the average for the general Brazilian population. hese public employees, in principle, have higher income, better hygiene information, better access to healthcare and higher levels of nutrition than the average person. Conse-quently, it is natural to assume that this increased access to well-being will yield higher life expectancy for this speciic group (Beltrão, Pinheiro, & Silva, 2010).
According to Rodrigues (2008), the use of life tables with risks that do not represent the real behavior of the co-vered population may reduce or increase mathematical re-serves and costs of beneit plans, which may cause structu-ral imbalances that are diicult to cover in the short term.
Similarly, RPPS beneiciaries, particularly in large cities, likely have general characteristics closer to the population participating in private pension plans, i.e., pension funds.
According to this perspective, the minimum parame-ter used in the actuarial valuation of these funds is the American life table, AT-83, a parameter provided by the Supplemental Pension Plan Management Council ( Con-selho de Gestão da Previdência Complementar - CGPC) Resolution no. 18 (2006). he National Supplemental Pension Superintendence (Superintendência Nacional de Previdência Complementar - PREVIC) considers this pa-rameter insuicient and is planning to adopt a more con-servative update, as described by Mr. Edevaldo Fernandes da Silva, director of actuarial accounting and economic afairs of PREVIC:
PREVIC wants to adopt a more conservative life table, i.e., one that assumes greater longevity of retirees and pensio-ners, present and future. Currently, the recommended ta-ble is the AT 83, according to which the median survival at age 60 is 22.6 years. (Izaguirre, 2012).
he use of a more conservative table than the AT-83 by pension funds is already provided for in review cases of be-neit plans because of surplus. For these cases, MPS/CGPC Resolution no. 26 (2008) requires the American table, AT-2000, as a minimum parameter.
In accordance with another perspective, it can be assumed that the life expectancy of public employees is proportional to the population covered by Brazilian insurance companies. Based on this assumption, the Su-perintendence of Private Insurance (Superintendência de Seguros Privados - SUSEP), by means of Circular Letter no. 402 (2010), published a life table with the experience of the Brazilian insurance market, the BR-EMSmt; this table also has a higher survival rate than that predicted by the IBGE-09 table.
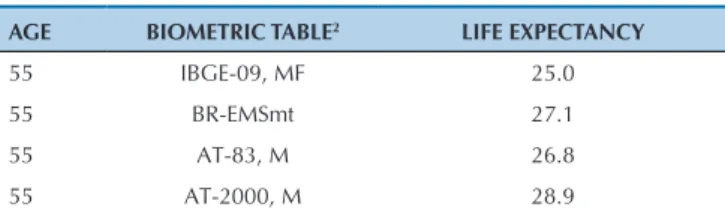
he comparison of the life expectancy at age 55 betwe-en the life tables discussed above is presbetwe-ented in Table 2.
he life expectancy at age 55 in the Brazilian table, BR--EMSmt, exceeds that of the AT-83, which justiies the PREVIC concern regarding the use of a table that projects a higher survival rate than the current rate.
3.1.2 Adherence Test for RPPS-RS.
From the databases of active and retired public employees of the state of Rio Grande do Sul (RS), annual tests were per-formed between 2006 and 2011 to identify which life table was more statistically appropriate for use in the actuarial projec-tions related to the RPPS of this state.
2 Only male life tables were selected, except for the IBGE-09 table, which includes both genders.
ITEM DESCRIPTION PARAMETER LEVEL
A General Life Table IBGE-09 Minimum
B Actual Annual Wage Growth 1.0% Minimum
Source: Ministry of the Social Security. Prepared by the authors.
Table 1 Actuarial parameters set forth in Ordinance no. 403 (2008)
AGE BIOMETRIC TABLE2 LIFE EXPECTANCY
55 IBGE-09, MF 25.0
55 BR-EMSmt 27.1
55 AT-83, M 26.8
55 AT-2000, M 28.9
Source: MPS, SUSEP, Society of Actuaries (SOA). Prepared by the authors.
Some life tables more common in actuarial studies were chosen to test the adherence of these tables with the database available for this study. By applying the distribution of mor-tality rates per age in each of the tables to the group of living beneiciaries, the expected mean death rate per year can be projected and compared with actual deaths to determine whi-ch tables have expected mean death rates that are closer to the observed rate. Table 3 presents the expected number of deaths according to the life tables and the actual number of deaths between 2006 and 2011.
According to Tables 3 and 4, life tables AT-2000, M, BR-EMSmt, AT-83, M and RP-2000, M were selected to perform the final adherence test because they had the four smallest deviations from the mean.
The chi-square test was chosen to determine which of the four previously selected tables were significant at the 5% level. The null hypothesis is that the life table chosen represents the true occurrence of deaths in the group of beneficiaries and the alternative hypothesis re-jects the table, i.e., the table chosen does not represent the occurrence of deaths. The hypothesis test consists of the observation of Type I error, i.e., rejecting the null hypothesis when it is true.
The chi-square test (Bussab & Morettin, 2002) tests whether the frequency with which a particular event ob-served empirically deviates significantly or not from the frequency at which it is expected.
Typically, the chi-square test becomes stricter as the number of studied classes increases; thus, the process was only accepted with a small number of age ranges, and extreme ages were eliminated because they did not fit any of the predefined life tables.
At the end of the tests, six age ranges were used, each covering a 10-year span, discarding extreme ages, begin-ning from the range between 31 and 40 years and ending with the range between 81 and 90 years, regardless of the gender of the beneficiaries. This distribution, with six age ranges, provides an adherence test with five degrees of freedom.
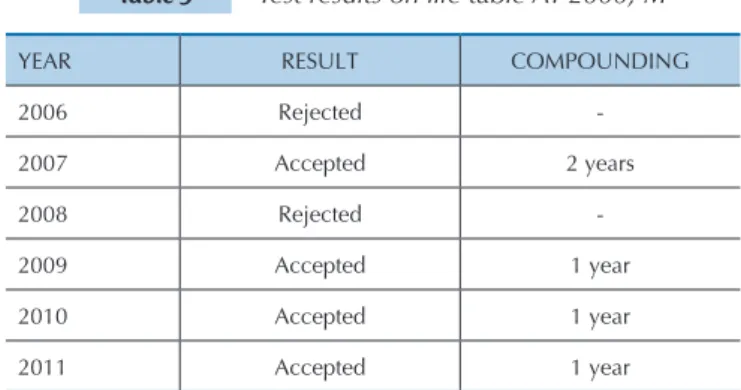
The final result of the test indicated that only life ta-ble AT-2000, M(+1) was adherent, i.e., aggregated over a year at a significance level of 5%. Aggregating a life table means aggregating mortality rates and, consequently, re-ducing the projected life expectancy. Figure 1 shows the adherence test of life table AT-2000, males, aggregated for one year.
This initial process is basically a filter to determine which life tables are adequate to test adherence. Table 4 presents the percent deviation of each of the mortality tables from actual deaths.
LIFE TABLE YEAR
2006 2007 2008 2009 2010 2011
AT-49, M 3898 4081 4277 4477 4645 4876
GAM-83, M 2862 3006 3164 3326 3465 3652
AT-83, M 2395 2509 2632 2758 2865 3011
AT-2000, M 1892 1984 2084 2185 2273 2391
UP-94-M 2620 2756 2904 3057 3188 3364
GAM-94, M 2436 2563 2701 2843 2965 3129
RP-2000, M 2400 2529 2671 2819 2947 3117
GKM-95, M 3308 3469 3645 3823 3979 4187
IBGE-09, MF 3116 3243 3376 3509 3621 3778
BR-EMSmt 2362 2469 2584 2701 2801 2936
ACTUAL 1909 2370 2283 2455 2518 2660
Source: MPS, SUSEP, SOA. Prepared by the authors.
Table 3 Expected and actual number of deaths per year
LIFE TABLE YEAR
2006 2007 2008 2009 2010 2011 MEAN
AT-49, M 104% 72% 87% 82% 84% 83% 86%
GAM-83, M 50% 27% 39% 35% 38% 37% 38%
AT-83, M 25% 6% 15% 12% 14% 13% 14%
AT-2000, M -1% -16% -9% -11% -10% -10% -9%
UP-94-M 37% 16% 27% 25% 27% 26% 26%
GAM-94, M 28% 8% 18% 16% 18% 18% 18%
RP-2000, M 26% 7% 17% 15% 17% 17% 16%
GKM-95, M 73% 46% 60% 56% 58% 57% 58%
IBGE-09, MF 63% 37% 48% 43% 44% 42% 46%
BR-EMSmt 24% 4% 13% 10% 11% 10% 12%
Source: MPS, SUSEP, SOA. Prepared by the authors.
Table 4 Percent deviation from actual deaths
Prepared by the authors.
Even with the conditions imposed on the adherence test, the method rejected years 2006 and 2008, and in the other years, for acceptance, aggregating table AT-2000, M was necessary, as Table 5 shows.
he RPPSs, in turn, will sufer the consequences of this volatility in the accounts. Sometimes, the beneit projec-ted during the activity period difers greatly in value from the beneit actually paid at the time of retirement.
hese distortions are caused by class gains provided for several reasons. he following news regarding the em-ployees of the municipality of Curitiba is an example:
The City Council of Curitiba yesterday granted a raise of 8.6% to municipal teachers. Added to the raise of 10% granted to public employees last week, these te-achers will have, overall, a pay raise of approximately 19%. This raise shall be paid on this month’s payroll (Boreki, 2012).
These advances, adjustments or readjustments, as discussed in the news, can be politically and legally reproduced in other federal entities. Without making judgments as to their fairness, the fact to be noted is the disproportionate gap that a public employee benefiting from advances adds to the RPPS pension commitments. In the situation described by the news, a teacher who is close to retirement will have their benefits increased by 19%, without any possibility that contributions made while they were active – by the employee and by the entity – will have been sufficient according to the new commitment.
he increase of the commitment made by the RPPS is even more complicated in relation to beneiciaries enti-tled to parity; in such cases, the beneit increase directly impacts pension charges, making contributions necessary to aford the new commitment.
With parity, any adjustment or restructuring granted to active public employees is immediately relected in equal proportion for RPPS retirees and pensioners. It is important to note that Constitutional Amendment no. 41 (2003) eliminated parity for employees who entered pu-blic service ater the date of its promulgation.
Regarding public employees who will not be entitled to parity when they retire, there would be, in theory, a greater predictability of the value of their benefits be-cause the benefits would only undergo inflation adjust-ment, and this procedure is common in pension fund regulations.
In practice, this situation may not occur, given the possibility that the entity grants parity to the active pu-blic employee, even after the advent of Constitutional Amendment no. 41 (2003), which constitutionally obli-gates them to grant only the adjustment of benefits to preserve their actual value, i.e., grant the adjustment in the same proportion to retirees and pensioner as a dis-cretionary matter.
Other factors at times change even the shortfalls of pu-blic employee retirement funds, such as with teachers who assume the roles of principals, administrators or course coordinators who, by means of Act no. 11.301 (2006), ac-quire the rights to special retirement with corresponding reductions in the contribution period.
he technical tests on the available records suggest that mortality table AT-2000, M aggregated in a year best represents the survival rate of the beneiciaries of the RPPS in the state of Rio Grande do Sul.
3.2 Actual Wage Growth.
According to Ordinance no. 403 (2008), the minimum actual growth rate of the wage of public employees throu-ghout their career that can be adopted by the RPPS is 1% annually. However, the bylaws of some entities set forth timely beneits, such as three-year and ive-year premiu-ms for their employees, and the granting of these rights may lead to higher growth than the minimum parameter required by the Ministry.
It is worth clarifying a common conceptual error about the efects that wage growth may have on the fun-ding scheme. It is natural to think that because the con-tribution level is proportional to the gains of a public em-ployee, that employee would have no practical efect on the funding process because if the employee increases the base and the commitment, then the income would also increase. However, as demonstrated below, this efect is not null. he wage variation during the activity period will produce signiicant efects on the funding process, implying an increase of the RPPS commitment.
In addition to the increase in remuneration obtained during the career plan progress of public employees (timely beneits and promotions), they receive pay raises resulting from collective labor agreements that frequently outweigh inlationary adjustments, i.e., that represent a real gain.
he Brazilian democratic electoral process provides a singular aspect to entities with respect to human resour-ces management that does not include predictability. Un-like the private sector, the public sector cyclically elects a new director who may not uphold the human resources policy of their predecessor. he results of this process can be observed in the contract cycles of public employees and wage adjustments.
YEAR RESULT COMPOUNDING
2006 Rejected
-2007 Accepted 2 years
2008 Rejected
-2009 Accepted 1 year
2010 Accepted 1 year
2011 Accepted 1 year
Prepared by the authors.
Considering that there is likely to be suppressed de-mand and a favorable economic momentum at the na-tional level in this context, the occurrence at any time of events similar to those discussed herein may nevertheless compromise the funding of the RPPSs to a large extent.
3.2.1 Wage Growth of Rio Grande do Sul Public Employees.
To estimate the actual growth rate of the wage of active pu-blic employees throughout their working lives, and therefore to determine whether the use of the minimum parameter
requi-red by law is suitable to the reality of the RPPS of the state of Rio Grande do Sul, data on public employees in the state of Rio Grande do Sul were analyzed.
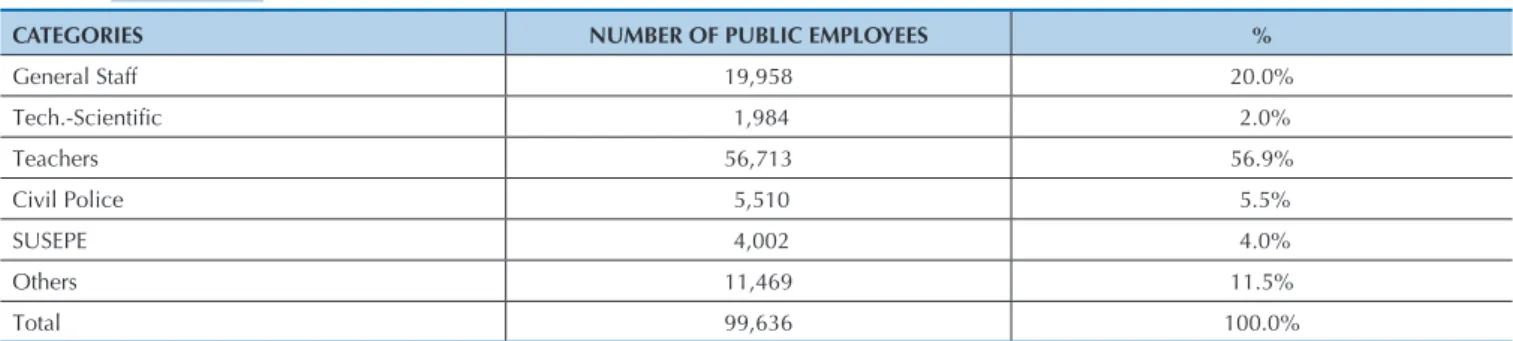
Only public employees were considered in the calculation because military employees have their own speciic pension fund. he main employment categories of the state were cho-sen and reprecho-sent 88.5% of the active public employees: tea-chers, general staf, civil police, Department of Correctional Services (Superintendência dos Serviços Penitenciários - SUSE-PE) and technical-scientiic employees. his distribution can be observed in Table 6.
In the wage growth estimate, career progression due to promotions and timely beneits in the form of three-year pre-miums were assumed. Under the law that regulates public service in the state of Rio Grande do Sul, the three-year pre-miums are 3% – i.e., every three years, the wage of the public employee is increased by 3% over the basic salary – with the exception of teachers, whose three-year premium is 5%.
To obtain the mean wage growth, the wages of the actual positions from the categories listed above were used on two occasions: 2002 and 2012. In this time span of 10 years, it was
considered that (a) public employees had 3 three-year pre-miums and (b) the career progression was proportional to the time elapsed and to the total time in oice for retirement pur-poses. For example, a technical-scientiic employee was hired in 2002; until 2012, they incorporated 3 three-year premiums (9% over the basic salary) and received a promotion (the ca-reer consisting of four levels, and to reach the inal level, three promotions are required).
Table 7 shows the calculation of wage growth based on the main categories.
Columns 3-5 show the value of the basic wage and the other wage portions totaling the minimum wage inherent to the position at current values . Columns 6-7 show the
in-crease resulting from incorporating the three-year premiu-ms. Column 8 presents the wage corrected by the National Broad Consumer Price Index (Índice Nacional de Preços
CATEGORIES NUMBER OF PUBLIC EMPLOYEES %
General Staff 19,958 20.0%
Tech.-Scientiic 1,984 2.0%
Teachers 56,713 56.9%
Civil Police 5,510 5.5%
SUSEPE 4,002 4.0%
Others 11,469 11.5%
Total 99,636 100.0%
Source: State Revenue Service of RS. Prepared by the authors.
Table 6 Number of active public employees in the main categories of the state of Rio Grande do Sul (RS)
CATEGORY (1)
PERIOD (2)
BASIC WAGE (R$)
(3)
OTHER PAYMENTS
(R$) (4)
WAGE WITHOUT THREE-YEAR
PREMIUM (5)
THREE-YEAR PREMIUM
(6)
WAGE WITH THREE-YEAR PREMIUM
(7)
CORRECTED WAGE
(8)
MEAN ANNUAL GROWTH
(9)
General Staff 2002 215.99 - 215.99 - 215.99 413.22
7.05%
2012 427.23 370.00 797.23 9% 835.68 835.68
Technical-Scientiic
Employees
2002 1,302.15 - 1,302.15 - 1,302.15 2,518.17
2.82%
2012 2,811.85 315.42 3,127.27 9% 3,380.34 3,380.34
Teachers 2002 310.40 44.54 354.94 - 354.94 683.40
3.89%
2012 884.10 - 884.10 15% 1,016.72 1,016.72
Civil Police 2002 365.61 676.59 1,042.20 - 1,042.20 2,024.13
2.84%
2012 824.27 1,829.87 2,654.14 9% 2,728.32 2,728.32
SUSEPE 2002 247.49 458.00 705.49 - 705.49 1,370.18
5.64%
2012 743.19 1,649.88 2,393.07 9% 2,459.96 2,459.96
Note: The data used for the calculation of the corrected wage (column 8) and mean annual growth (column 9) refer to the following: in 2002, to
Decem-ber/01 and, in 2012, to different times, namely, General Staff and SUSEPE – April/12, Technical-Scientiic Employees – July/12, Teachers – May/12, Civil
Police – August/12.
Source: State Revenue Service of RS. Prepared by the authors.
ao Consumidor Amplo - IPCA) until August/2012. Finally, column 9 shows the mean annual wage growth index obtai-ned by the wage variation for the period analyzed.
To obtain the mean actual wage growth of the cho-sen categories, growth indices per category were used (shown in Table 7) that were weighted by the number of
public employees that make up each category (shown in Table 6), which resulted in a igure of 4.59% per year. It must be emphasized that this index refers to the mean ac-tual wage growth of public employees of the RPPS from the state of Rio Grande do Sul and should not be directly applied to other RPPSs.
4 MIXED PLAN SIMULATIONS
Ater reviewing the assumptions used in the actuarial calculations, the adoption of a mixed plan for the RPPS was simulated. In this mixed plan, during the period when the public employee is active, their contributions, the contri-butions of the entity and inancial gains from the invest-ment of these resources will form a reserve. Based on the value of this reserve, the value of the beneit that the fund will be able to pay is calculated. If the value of the beneit that the public employee is entitled to – in accordance with constitutional provisions – exceeds the value of the funded beneit, the diference will be covered by transfers from the entity to the RPPS. If the value of the constitutional bene-it is lower than the funded value, bene-its equalization shall be addressed as provided by Ordinance no. 403 (2008).
he mixed plan is based on the momentary inability of most entities that performed mass segregation3 – and
therefore have inancial funds and pension funds – to con-tribute above the minimum required pension rate of 11% (deducted from federal public employees) of the wage con-tribution of the beneiciaries to the fund. his inability re-sults because the entity is also responsible for paying retire-ment and pension beneits for public employees belonging to the simple distribution system. Over time, the pension expenditure of the entity will be reduced for two reasons: the group of current retirees and pensioners will become gradually extinct, and the inlow of new pensions will be paid by the funded system.
his simulation considered that the contribution rate will remain at 11% equitably between beneiciaries and the enti-ty, for a total of 22%. Only when the payment of the pension beneit begins will the beneit amount that the public em-ployee or their dependent is entitled to be calculated, whi-ch was efectively funded. he remaining amount to com-plement the value of the beneit constitutionally guaranteed to the beneiciary or beneiciaries will be borne by the State Treasury under a simple distribution inancial scheme.
4.1 Individual Funding.
In this irst simulation, for comparison purposes, the calculation of the amount actually funded was performed for each public employee, with the diference as the state’s responsibility. he minimum contribution rate provided by law of 11% was adopted for the public employee plus 11% for the entity, in addition to the maximum and minimum parameters provided by Ordinance no. 403 (2008). he
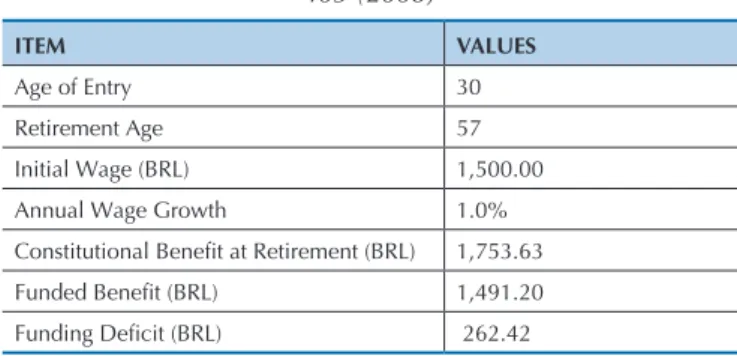
si-mulation of the constitutional beneit that the public em-ployee is entitled to, the funded beneit and funding deicit are presented in Table 8.
3 According to Ordinance no. 403 (2008), mass segregation is the separation of beneiciaries of the RPPS into different groups that will comprise the inancial plan and the pension plan. The irst refers to senior
public employees and is inanced by means of distribution. The second provides coverage to employees with less employment time in public service and is funded.
It is projected that the contribution plan is insuicient for full funding of the constitutional beneit that the public employee will be entitled to at the time of retirement. he example described herein uses the mean ages of entry (30 ye-ars) and retirement (57 yeye-ars) of the RPPS beneiciaries from the state of Rio Grande do Sul together with the mean initial public service salary of BRL 1,500.00. he constitutional be-neit that such public employees will be entitled to is BRL 1,753.63 (this value is the mean of the 80% largest salary con-tributions and not the inal payment, which is BRL 1,942.88). he contribution plan, by contrast, will fund a mathematical reserve that is proportional to a beneit of BRL 1,491.20, or 85% of the total projected constitutional beneit.
In the study case, the fund remains responsible for the full payment of the beneit to the public employee, BRL 1,753.63, which inevitably reveals consecutive actuarial deicits and, as observed in actuarial projections, the insolvency of the fund for the payment of beneits at a given time.
According to the initial simulation for the efective funding of a public employee that joins the RPPS, the required contri-bution rate should be approximately 25%, which is split betwe-en the public employee and the betwe-entity; this calculation would result in 11% for the public employee and 14% for the entity. However, the situation is not so simple, as will be shown next.
It is worth emphasizing that this simulation refers to a new public employee that joins the entity and not to those that have contributed for a long time; the possible efects of class gains,
ITEM VALUES
Age of Entry 30
Retirement Age 57
Initial Wage (BRL) 1,500.00
Annual Wage Growth 1.0%
Constitutional Beneit at Retirement (BRL) 1,753.63
Funded Beneit (BRL) 1,491.20
Funding Deicit (BRL) 262.42
Note: A percentage of 4.47% destined to cover risk beneits is assumed.
Prepared by the authors.
as described above, are not projected. For these cases, the cal-culation is more complicated.
As described before, it is projected that the minimum and maximum parameters established by Ordinance no. 403 (2008) are not in compliance with the RPPS. Because of this non-compliance, the projection of the efective funding was performed through the same contribution process with ag-gregation of these parameters.
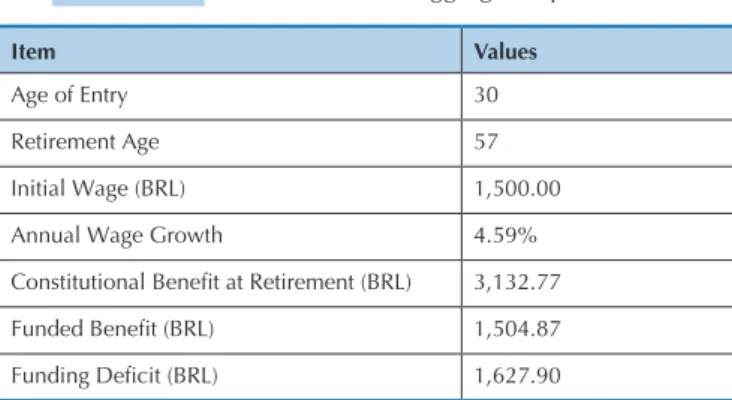
For this case, the life table AT-2000, M(+1) was chosen, replacing the IBGE-09; the wage growth projected became 4.59% annually, instead of 1%, and the actuarial interest rate was reduced from 6.0% to 4.5% annually. he simulation with these aggregated parameters is shown in Table 9.
According to the simulation of individual parameter changes, the reduction in the interest rate from 6% to 4.5% per year would produce the greatest efect, with an increase of 174.82% in contribution deicits.
With reference to the descriptions in section 3.2 of the efects produced by wage growth, the simulation demons-trates larger deicits in funding, in view of the increase in this parameter. In the study case, with the single modii-cation of the wage growth projection from 1.0% to 4.59% per year, the increase in the deicit is 98.30%.
Because they are not independent efects, the total sum of the individual increments of the parameters is not equivalent to the combined efect. he added efect of the parameters is approximately 247.19%, given that the funding deicit increased from 14.96% to 51.96% between simulations.
Another way to project the contribution deficit is to use simple mathematical reasoning in relation to the marked number of RPPS beneficiary teachers. In these cases, a total contribution of 22% (public employee plus entity) over the wage shall occur for approximately 25 years of activity, and the payment of 100% of the benefit for a mean life expectancy of 35 years shall occur after retirement. This calculation certainly cannot be affor-ded by the fund because 22% is paid to the fund for 25 years and 100% is payable for 35 years. One possible so-lution for this equation is for the fund to reach high pro-fitability levels from fund investment, which is unlikely, as previously observed.
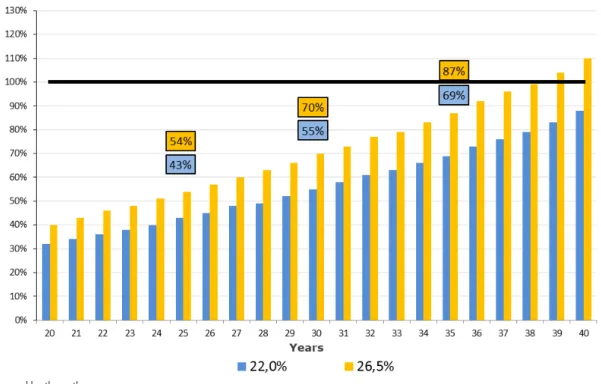
According to the assumptions deined as more adhe-rent to the RPPS of the state of Rio Grande do Sul (Table 9) and the mean records used in the individual projec-tions, Figure 2 compares the contribution period (in ye-ars) with the portion of the beneit that will be efectively funded (as a percentage). Two distinct contribution plans were simulated: the irst considers the total rate of 22% (11% for the public employee and 11% for the entity), the minimum required by the pension law. he second establishes a contribution level of 26.5% (13.25% for the public employee and 13.25% for the entity), which is the current situation of the state of Rio Grande do Sul. In this new simulation, with actuarial parameters
ag-gregated as described above, the result is bleak. Of the total projected constitutional beneit, BRL 3,132.77, it is estimated that only 48% will be funded, i.e., BRL 1,504.87. For the efective funding of the total beneit, the required rate shall be 41% of wages, 11% from the public employee and 30% from the entity, in this example.
Numerous simulations can be performed that will in-dicate that the funding level of the RPPS will be insui-cient to meet the payment of all public employee pension beneits. he parameter changes made for the second si-mulation (Table 9) only evidence such a reality, given that future commitments will likely be closer to the simulation performed with these parameters.
The final projected deficit goes from 15% of the to-tal benefit, by the initial parameters, to 52% of the toto-tal benefit, according to the calculation made with more conservative assumptions. The effect of each parame-ter change is ultimately compounded when applied si-multaneously, considering that these changes are not independent.
For illustrative purposes, the impact that each para-meter would add to the initial funding deicit is demons-trated in Table 10, if applied individually.
Item Values
Age of Entry 30
Retirement Age 57
Initial Wage (BRL) 1,500.00
Annual Wage Growth 4.59%
Constitutional Beneit at Retirement (BRL) 3,132.77
Funded Beneit (BRL) 1,504.87
Funding Deicit (BRL) 1,627.90
Prepared by the authors.
Table 9 Simulation with aggregated parameters
Item Initial
parameter
New Parameter
Deicit
Increase
Life Table IBGE-09 AT-2000(+1) 18.17%
Wage Growth 1.00% 4.59% 98.30%
Interest Rate 6.00% 4.50% 174.82%
Prepared by the authors.
The benefit will not be fully covered by contributions and earnings even in the second plan (26.5%) because that would require a contribution period of 38 years, at least, whereas in the first plan (22%), more than 40 years of contribution would be necessary. Both situations of such long contribution periods are not found in practice because the databases of the state of Rio Grande do Sul demonstrate that public employees contribute, on avera-ge, for 27 years.
For these simulations, financial compensation effects were not considered between schemes because such compensation typically is not sufficient for the com-mitments made by the RPPS, which would decrease the amount funded by the simulations.
4.2 Collective Funding of the State of Rio
Grande do Sul.
his section analyzes the collective capitalization of pu-blic employee pensions in the state the Rio Grande do Sul based on the new parameters deined as more realistic.
he pension fund for public employees was created on July 15, 2011, with the passage of Complementary Act no. 13.758 (2011). he current value of the wages of active em-ployees is BRL 720,627,054.35, ater considering all future wages of the current group of public employees who belong to FUNDOPREV, the funded state pension fund. he com-mitments of the fund, as well as the percentages relative to payroll, are presented in Table 11.
Table 12 shows the earnings that the irst contribution plan (22%) will yield to the funds.
Prepared by the authors.
Figure 2 Comparison between contribution time and funded benefit
Commitments Values in BRL % wages
Beneits Granted - 0.00%
Beneits to be Granted 371,928,941.27 42.46%
Beneits to be Granted– Future Generation - 0.00%
Total 371,928,941.27 42.46%
Prepared by the authors.
Table 11 Benefits granted and to be granted from RS pension funds
Income Value in BRL % wages
Contribution of Active Employees 96,350,943.70 11.00%
Contribution of Pensioners 11,157,868.24 1.27%
Pension Compensation 7,438,578.83 0.85%
State Contribution over the Wages of Active Employees 96,350,943.70 11.00%
State Contribution over the Wages of Pensioners - 0.00%
Total 211,298,334.46 24.12%
Prepared by the authors.
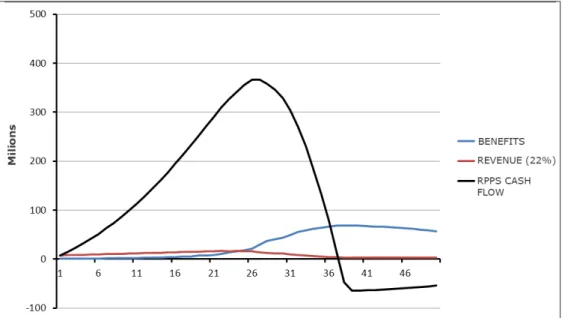
According to Tables 11 and 12, the formation of a mathe-matical reserve of BRL 160,630,606.81 (BRL 371,928,941.27 – BRL 211,298,334.46) will be required, i.e., 22.29% over the wages of active employees. In this model, the pension fund of the state of Rio Grande do Sul will have approximately 37 years of solvency. Beginning in 2048, it will no longer have the funds to aford to pay beneits to its retirees and pensio-ners, as Figure 3 shows.
his chart shows the pattern of three variables: (a) beneits
paid to retirees and pensioners; (b) revenue from the contri-butions of beneiciaries and the State; and (c) fund resources (contributions plus earnings). he negative impact on fund assets, beginning in the 25th year, will occur with an increase in
expenses due to the payment of retirement beneits and pen-sions associated with reduced pension revenue because the beneiciaries contribute only over the amount that exceeds the maximum limit of beneits from the General Social Security System (Regime Geral de Previdência Social - RGPS).
In the second contribution plan (26.5%), revenues will increase by BRL 39,416,295.15 (BRL 250,714,629.61 - BRL 211,298,334.46) based on an increase of 4.5% in the full
pension rate. Table 13 shows the distribution of revenues in this new model, approved by Complementary Act no. 14016 (2012).
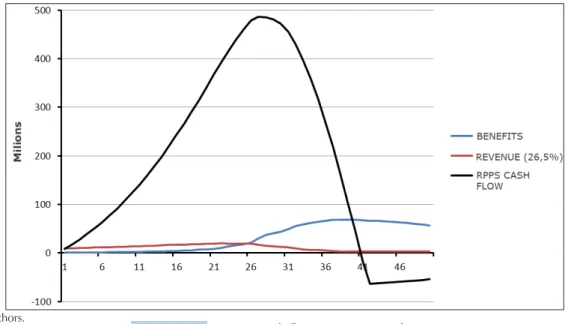
Based on Tables 11 and 13, the deicit amount in the new contribution plan of the state of Rio Grande do Sul is BRL 121,214,311.66 (BRL 371,928,941.27 - BRL 250,714,629.61), i.e., 16.82% of active employee wages. he projection indicates
that by 2051, the resources from pension funds will end, i.e., the MILITARY FUNDOPREV and FUNDOPREV will only be able to pay the pension beneits for 40 more years before they become insolvent.
Revenue Values in BRL % wages
Contribution of Active Employees 116,059,091.28 13.25%
Contribution of Pensioners 11,157,868.24 1.27%
Pension Compensation 7,438,578.83 0.85%
State Contribution over the Wages of Active Employees 116,059,091.28 13.25%
State Contribution over the Wages of Pensioners - 0.00%
Total 250,714,629.61 28.62%
Prepared by the authors.
Table 13 Income from funds in the 26.5% contribution plan
In Figure 4, the shape of the fund beneit, revenue and resource curves is similar to that shown in Figure 3. he diference is that at a contribution level of 26.5%, the pen-sion revenue is higher, which ensures the solvency of the
fund for another three years. It is noted that, even with the increase of the rate from 22% to 26.5%, the increase in pension revenue is not suicient to maintain the balance of the RPPS.
5 CONCLUSION
The biometric and financial assumptions of the RPPS actuarial valuation are contained in the minimum and maximum parameters set forth in Ordinance no. 403 (2008). As demonstrated throughout this study, the choice of parameters, the IBGE-09 life table and actual wage growth of 1% per year, do not reflect the current reality that is faced by the pension fund of the state of Rio Grande do Sul; the reality, unfortunately, is that the-se assumptions result in a smaller pension deficit for the RPPS of the state.
Thus, this study seeks to provide insight to managers of state pension funds so that – together with the res-ponsible actuary – they can choose the most plausible assumptions to maintain the actuarial and financial sus-tainability of the scheme.
According to the case analyzed from the state of Rio Grande do Sul, delegating full payment of pension be-nefits to the fund, regardless of reciprocal funding, will result in the gradual consumption of financial resources until they are inevitably extinguished.
In addition, the Rio Grande do Sul case also shows that increasing the entity transfer rate will be insuffi-cient due to the entire context involved, even if applied at the very high levels described herein. Furthermore, it should be emphasized that higher entity transfer rates may prove impossible to implement in practice, whether because of legal and tax impediments or because of the economic scenario that such entities eventually face.
Insufficient funding of all commitments to RPPS be-neficiaries is therefore a real projection for the fund in this case study. To mitigate this problem, a form of
mi-xed financing, partly funding and partly simple distri-bution, was suggested. Under this assumption, the fund would be responsible for the effectively funded part on the individual account of the public employee, and the complement, if necessary, to reach the constitutional benefit is payable by the entity and financed by simple distribution.
It is important to highlight two key aspects of this method: first, such financing mechanism does not pre-vent the benefit from becoming fully funded, whether by means of additional contributions or even due to favo-rable factors over time. In this case, the fund would be responsible for 100% of the benefit without the need for additional transfers, i.e., the proposed mixed plan for-mat does not exclude the possibility that the traditional mechanism of full funding may be used.
The second important factor is that the fund and – indirectly – the entity would not have to address the constant pressure to equalize actuarial deficits during its management, and in the case of the mixed plan, the mathematical reserve is always equivalent to the assets, and the plan would be in actuarial balance permanently.
As evidenced in this study, the proposal of a mixed plan aims to ensure the continued sustainability of the pension fund to prevent it from being liable for the pay-ment of benefits over its capacity, thus prematurely ex-tinguishing the fund’s resources, which would be a set-back for the public employee pension system.
The mixed plan allows the continuation of a funding scheme in the RPPS, which adds real financial gains to the federal entity over time.
Prepared by the authors.
Avritzer, L. (2008). Instituições participativas e desenho institucional: algumas considerações sobre a variação da participação no Brasil
democrático. Opinião Pública, 14 (1), 43-64.
Beltrão, K., Pinheiro, S., & Silva, L. (2010). Estimativa da mortalidade para indivíduos em famílias de baixa renda. In Escola Nacional de
Seguros. Microsseguros. (Série Pesquisas, Vol. 2). Rio de Janeiro:
FUNENSEG. Recuperado em 5 agosto, 2012, de htp://www. funenseg.org.br/extras/kz2.pdf.
Boreki, V. (2012, 3 abril). Câmara aprova aumento de 8,6% para
professores. Gazeta do Povo. Recuperado em 10 agosto, 2012, de
http://www.gazetadopovo.com.br/vidapublica/vereadores/conteudo. phtml?id=1240396.
Bowers, N., Gerber, H., Hickman, J., Jones, D., & Nesbitt, C. (1986).
Actuarial mathematics. Itasca, Illinois: Society of Actuaries. Brown, J., Clerk, R., & Rauh, J. (2011). he economics of state and local
pensions. Journal of Pension Economics and Finance, 10 (2), 161-172.
Bussab, W., & Morettin, P. (2002). Estatística básica. São Paulo: Saraiva.
Caetano, M. (2013). Reforma previdenciária, cedo ou tarde. In F.
Giambiagi, & C. Porto (Orgs.). Propostas para o governo 2015/2018
(pp. 253-264). Rio de Janeiro: Elsevier.
Calazans. F., & Caetano, M. (2013). A política regulatória contemporânea
dos regimes de previdência do funcionalismo público no Brasil: avanços, limitações e propostas (Texto para discussão, No 1838). Rio de Janeiro: IPEA.
Circular SUSEP n. 402, de 18 de março de 2010 (2010). Brasília. Diário Oicial da União, 50, 30.
Emenda Constitucional n. 41, de 19 de dezembro de 2003 (2003). Recuperado em 7 agosto, 2012, de http://www.planalto.gov.br/ ccivil_03/constituicao/emendas/emc/emc41.htm. BRASIL.
Feldstein, M., & Siebert, H. (2002). Social security pension reform in
Europe. Chicago: he University of Chicago Press.
Galé, J. (1977). Elementos de cálculo actuarial. Buenos Aires: Editora Macchi.
Giambiagi, F. (2009). Previdência: a reforma possível. In F. Giambiagi, & O.
Barros (Orgs.). Brasil pós-crise (pp. 103-120). Rio de Janeiro: Elsevier.
Giambiagi, F., Zylberstajn, H., Afonso, L., Souza, A.; & Zylberstajn, E. (2007). Impacto de reformas paramétricas na previdência
social brasileira: simulações alternativas. Pesquisa e Planejamento
Econômico, 37 (2), 175-220.
Instituto Brasileiro de Geograia e Estatística (2010a). Nota sobre o Censo
2010. Recuperado em 29 junho, 2012, de
http://www.ibge.gov.br/home/presidencia/noticias/noticia_visualiza. php?id_noticia=2170&id_pagina=1.
Instituto Brasileiro de Geograia e Estatística (2010b). Tábua completa
de mortalidade 2010. Nota técnica. Recuperado em 15 maio, 2012, de http://www.ibge.gov.br/home/estatistica/populacao/ tabuadevida/2010/notastecnicas.pdf.
Izaguirre, M. (2012, 15 março). Meta de retorno de fundos cairá. Valor
Econômico. Recuperado em 20 junho, 2012, de http://www.fazenda. gov.br/resenhaeletronica/MostraMateria.asp?page=&cod=794154.
Jordan, C. (1967). Life contingencies (2a ed.). Schaumburg, Illinois: Society
of Actuaries.
Lei n. 9.717, de 27 de novembro de 1998 (1998). Brasília. Recuperado em 15 maio, 2012, de http://www.planalto.gov.br/ccivil_03/leis/L9717.htm. Lei n. 11.301, de 10 de maio de 2006 (2006). Brasília. Diário Oicial da
União. Recuperado em 15 maio, 2012, de http://www.planalto.gov.br/ ccivil_03/_Ato2004-2006/2006/Lei/L11301.htm.
Lei Complementar n. 13.758, de 15 de julho de 2011 (2011). Rio Grande do Sul. Recuperado em 17 maio, 2012, de http://www.al.rs.gov. br/Legis/M010/M0100099.ASP?Hid_Tipo=TEXTO&Hid_ TodasNormas=56367&hTexto=&Hid_IDNorma=56367.
Lei Complementar n. 14.016, de 21 de junho de 2012 (2012). Rio Grande do Sul. Recuperado em 17 maio, 2012, de http://www. al.rs.gov.br/legis/M010/M0100099.ASP?Hid_Tipo=TEXTO&Hid_ TodasNormas=57893&hTexto=&Hid_IDNorma=57893.
Nogueira, N. (2012). O equilíbrio inanceiro e atuarial dos RPPS: de
princípio constitucional a política pública de estado (Coleção Previdência Social, Série Estudos, Vol. 34). Secretaria de Políticas de Previdência Social. Brasília: Ministério da Previdência Social. Novy-Marx, R., & Rauh, J. (2014). he revenue demands of public
employee pension promises. American Economic Journal: Economic
Policy, 6 (1), 193-229.
Pinheiro, R. A. (2007). Demograia dos fundos de pensão (Coleção
Previdência Social, Série Estudos, Vol. 24). Secretaria de Políticas de Previdência Social. Brasília: Ministério da Previdência Social.
Portaria n. 172, de 11 de fevereiro de 2005 (2005). Ministério da Previdência Social. Recuperado em 20 junho, 2012, de http://www. previdencia.gov.br/arquivos/oice/3_081014-105208-497.pdf.
Portaria n. 403, de 10 de dezembro de 2008 (2008). Ministério da Previdência Social. Brasília. Diário Oicial da União. Recuperado em 20 fevereiro, 2013, de http://www.previdencia.gov.br/arquivos/ oice/1_130123-155051-623.pdf.
Portaria n. 4.992, de 5 de fevereiro de 1999 (1999). Ministério da Previdência Social. Recuperado em 23 junho, 2012, de http://www81. dataprev.gov.br/sislex/paginas/66/mpas/1999/4992.htm.
Resolução MPS/CGPC n. 18, de 28 de março de 2006 (2006). Ministério da Previdência Social. Recuperado em 18 junho, 2012, de http:// www010.dataprev.gov.br/sislex/paginas/72/MPS-CGPC/2006/18.htm.
Resolução MPS/CGPC n. 26, de 29 de setembro de 2008 (2008). Ministério da Previdência Social. Brasília. Diário Oicial da União. Recuperado em 23 junho, 2012, de http://www010.dataprev.gov.br/sislex/ paginas/72/MPS-CGPC/2008/26.htm.
Rodrigues, J. (2008). Gestão de risco atuarial. São Paulo: Saraiva.
Silva, F. B. S., Jaccoud, L., & Beghin, N. (2005). Políticas sociais no Brasil:
participação social, conselhos e parcerias. In L. Jaccoud (Org.). Questões
sociais e políticas sociais no Brasil contemporâneo. Brasília: IPEA. Velloso, R., Freitas, P., Caetano, M., & Cândido, J. O. (2013). Na crise, Estado
e ajuste iscal permanente. In J. P. R. Velloso (Org.). Transformando crise
em oportunidade: como o Brasil fez na grande depressão (anos 30) e na crise do petróleo (1973/83) (pp. 99-172). Rio de Janeiro: INAE.
Vilanova, W. (1969). Matemática atuarial. São Paulo: Editora da
Universidade de São Paulo.
References
APPENDIX – DESCRIPTION OF ACTUARIAL METHODOLOGY
1 OBJECTIVE AND SCOPE
his technical note aims to establish the technical and actuarial valuation basis of the Pension Regime for Government Workers (RPPS), consistent with current legislation, beneit plans and contribution plans.
1.2 he beneit plans, under the law, are structured in the form of “deined beneits” that encompass public employees holding permanent oices associated under the RPPS, with their respective state/municipal entity as the sponsor of the plan.
1.3 he methodology of actuarial valuation developed in this technical note establishes:
1.3.1 Current value of obligations of the beneits granted; 1.3.2 Current value of obligations of the beneits to be granted; 1.3.3 Current value of contribution rights;
1.3.4 Current value of inancial compensation to be received; 1.3.5 Mathematical provisions.