Contents lists available atScienceDirect
Chemical Engineering Journal
journal homepage:www.elsevier.com/locate/cej
On the reasons for deactivation of titanate nanotubes with metals catalysts
in the acetalization of glycerol with acetone
Igor S. Gomes
a, Davi C. de Carvalho
a, Alcineia C. Oliveira
a,⁎, Enrique Rodríguez-Castellón
b,
Samuel Tehuacanero-Cuapa
c, Paulo T.C. Freire
d, Josué M. Filho
d, Gilberto D. Saraiva
e,
Francisco F. de Sousa
d,f, Rossano Lang
gaUniversidade Federal do Ceará, Campus do Pici-Bloco 940, Departamento de Química Analitica e Físico-Química, Fortaleza, Ceará, Brazil bUniversidad de Málaga, Departamento de Química Inorgánica, Facultad de Ciencias, 29071, Spain
cInstituto de Física, UNAM, Circuito de la Investigación s/n, Ciudad Universitaria, 04510 Coyoacán, D. F., Mexico dUniversidade Federal do Ceará, Departamento de Física, Campus Pici-922, Fortaleza, Ceará, Brazil
eFaculdade de Educação Ciências e Letras do Sertão Central, Universidade Estadual do Ceará, 63.900-000, Quixadá, Brazil fUniversidade Federal do Sul e Sudeste do Pará, Campus Universitário de Marabá, 68505-080 Marabá, Pará, Brazil gInstituto de Ciência e Tecnologia
–ICT, Universidade Federal de São Paulo UNIFESP, 12231-280 São José dos Campos, SP, Brazil
G R A P H I C A L A B S T R A C T
A R T I C L E I N F O
This paper is dedicated to the memory of Professor Josue Mendes Filho
Keywords:
Titanate nanotubes Modification Deactivation Raman Acetalization Glycerol
A B S T R A C T
Pt-containing titanate nanotubes (PTNT) catalyst had PtOxand chlorined-Pt species dispersed on the alkali trititanate nanotube phase (TNT). This solid was morphologically and structurally stable during glycerol acet-alization of glycerol with acetone. In contrast, a significant transformation of Ni2+and Co3+/Co2+surface species dispersed on TNT provoked morphological, textural and surface changes affecting the catalytic perfor-mance of these samples, as observed with the help of HRTEM, XPS, Raman and textural properties measure-ments. Leaching of Co and Ni species was identified as the main mechanism for the deactivation respectively on Co-containing titanate nanotubes (CTNT) and Ni-containing titanate nanotube (NTNT) catalysts. On the con-trary, PTNT performed very well giving rise to 28% of conversion and 11% selectivity to solketal over three reaction cycles of 24 h. This was thanked to the suitable tuning of pore-structure and proper surface acidity of PTNT, resulting in a stable solid for the reaction.
1. Introduction
The cyclization (condensation) reactions have been extensively
studied for decades, since they are efficient processes to convert
alde-hydes or ketones into most valuable compounds [1,2]. As part of a condensation reaction, the acetalization of glycerol with ketones or
https://doi.org/10.1016/j.cej.2017.11.112
Received 28 June 2017; Received in revised form 6 November 2017; Accepted 21 November 2017 ⁎Corresponding author.
E-mail address:alcineia@ufc.br(A.C. Oliveira).
Available online 22 November 2017
1385-8947/ © 2017 Elsevier B.V. All rights reserved.
aldehydes can be widely applied in chemical industries to producefive and six-member ring carbocycles, for instance (2,2-dimethyl-[1,3]di-oxan-4-yl)-methanol, i.e., solketal and 2,2-dimethyl-[1,3]dioxan-5-ol, namely acetal [3]. These two compounds are constituent of many agricultural, pharmaceutical and biologically active natural products [4–6]. Indeed, the aforesaid glycerol-derived acetals may be in-corporate into additive for standard diesel fuel as well as decrease the emission of hydrocarbons and particulate species[3–7].
The acetalization of glycerol with ketones or aldehydes is carried out over homogeneousi.e., HCl, H2SO4, HF, dichloroacetic acid, H3PO4, p-toluenesulphonic acids and Lewis catalysts[8]. Also, heterogeneous solids such as, exchange resins, zeolites, rare-earth triflates, metal oxides, activated carbons, gold salts, mesoporous silicates, montmor-illonite, heteropolyacids and supported rare-earth nanoparticles are extensively used in the reaction[3–8].
The heterogeneous catalysts are the preferred ones due to the se-paration and corrosion issues. Specifically in case of acetalization of glycerol with ketones, it is widely acknowledged that heterogeneous acid solids can promote the formation of a cation from the protonated hemiacetal in the rate determining step of the reaction, being crucial to achieve high catalytic activity [7–10]. Nevertheless, these catalysts usually have severe leaching of the acid sites and phase transformations drawbacks, which do not meet the requirements for efficiently convert glycerol to cyclic products. Moreover, it is noteworthy that the acet-alization of glycerol with acetone inherently produces low amount of water from the condensation reaction, which may deactivate Lewis and Brønsted acid sites[11].
In order to overcome these problems, the redox catalysts have been studied. For instance, Priya and coworkers reported that transition metal ions (M = Fe2+, Co2+, Ni2+, Cu2+or Zn2+) promoted mordenite zeolite catalyst gave Lewis acid sites of strong leaching resistance in glycerol acetalization and thus, suppressing deactivation and improving catalytic activity in the title reaction[12]. Another promising strategy is reported by Kapkowski et al. that supported Re, Rh, Ru or Ir nano-particles on silica and molybdenum oxides to have catalysts of re-markably structure resistance property, and hence improving the se-lectivity to the desired cyclic products[13].
Besides the type of catalyst, the reaction conditions parameters should also be important and be modified to further improve the cat-alytic activity. Accordingly, the reaction temperature, glycerol to ke-tone molar ratio, nature of the keke-tone substrate and solvent presence exerted a great influence on the catalyst performance[3,14,15].
Currently, acid titanate nanotubes (TNTs) prepared with different synthesis time have been successfully tested as catalysts for glycerol acetalization with acetone showing good performances [3]. In TNTs catalyst, reactants access active moderate acid sites through the ele-vated surface area or accessible pores to produce the desired acetal and solketal products [3]. This was because tuning morphology, surface area, porosity and acidity was crucial for better catalytic results. However, acidity of these catalysts would enhance the activation and chemisorption of products and, thereby providing more byproducts formation during initial steps of the reaction. Particularly, the changes
in structure, composition and morphology in terms of the catalytic activity of the TNTs were no longer studied. This inspired us to in-vestigate the effect of structure tuning the TNTs with the intercalation of metals on their structure.
Here, we report the synthesis of TNTs incorporated with metals (Pt, Co, Ni) and their effects on the reaction parameters such as acetone to glycerol molar ratio, catalyst mass and temperature used for facilitating interaction between glycerol and acetone in the TNTs. These catalysts are expected to be highly active in the optimum reaction conditions and maintain high resistance towards deactivation by leaching and coking. This will enable us to establish a correlation between catalytic perfor-mance, including stability against leaching and the formation of coking, and the chemical and structural properties of TNTs catalysts, as well.
Metal-containing titanate nanotubes (MTNTs) promoted multi-functionality of nanotubes structure[16–18]. With this background of requirement for an effective catalyst, the metals confined in TNTs are expected to play the role of stabilizing the solid, that preventing leaching and can effectively help the active sites to interact with
gly-cerol and acetone to exhibit deactivation resistance properties.
2. Experimental
2.1. Preparation of metal-containing titanate nanotubes (MTNTs)
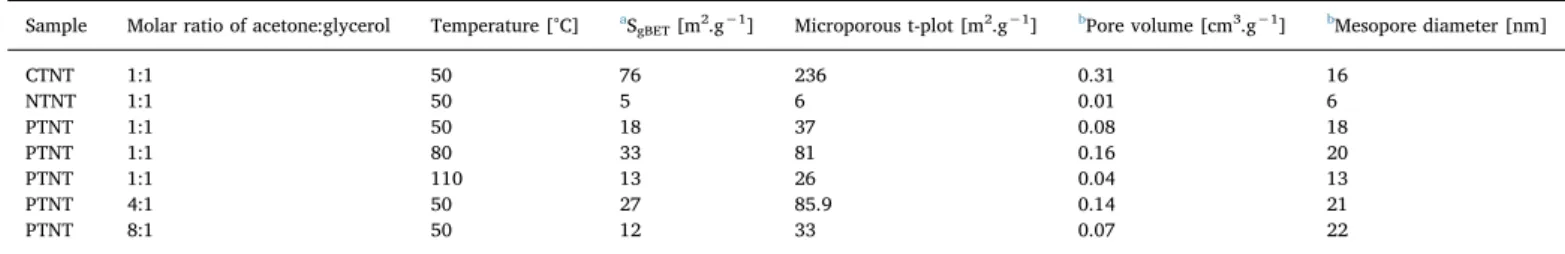
The synthesis of the MTNTs was based on the hydrothermal treat-ment method from TiO2(titanium (IV) oxide, anatase nanopowder, < 25 nm particle size from Aldrich) and sodium hydroxide precursors, as published elsewhere[3,16]. Briefly, about 1.0 g of TiO2in the anatase form was mixed with a 10 mol.L−1 of sodium hydroxide. After dis-solution, the mixture was vigorously stirred and introduced in an au-toclave at 160 °C for 72 h. The obtained precipitate was then collected, washed with deionized water to reach thefinal pH of 7. Then, the solid was dried at 50 °C for 6 h to produce the alkali TNT. The later solid was submitted to ion exchange with cobalt (II) nitrate or nickel (II) nitrate solutions to obtain an 18 wt% of the catalyst. For platinum incorpora-tion, the TNT was added to 5.1μmol of hexachloroplatinic acid pre-pared with hydrochloric acid solution (0.019 M). The prepre-pared MTNTs were dried carefully at 100 °C during 24 h for moisture elimination. These materials were denoted as TNT system for titanate nanotubes. According to metal presence, it was possible to determine the types of solid, being Co, Ni and Pt designated as CTNT, NTNT and PTNT, re-spectively. Chemical analysis confirmed the expected M/Ti molar ratio of 0.33 in the investigated materials. The detailed characterization of the fresh solids is discussed in the previous findings [3]. The main characterization results are summarized inTable 1.
2.2. Characterizations of spent solids
X-ray diffraction (XRD) patterns were collected with a X-ray dif-fractometer (Bruker D8 Advance, 18 kV) using Cu-Kαradiation at 40 kV and 40 mA. The diffraction patterns have been indexed by comparison
with the ICDDfiles (International Centre for Diffraction Data) and the
Table 1
Summary of fresh MTNTs physicochemical properties through XRD, Raman spectroscopy, TEM, XPS and textural properties.
Catalyst XRD, Raman and TEM XPS [surface ions]
Metal [content wt %]
Textural properties Acidity measurements [μmol Py gcat−1]
References
Sodic TNT Na2Ti3O7 Ti4+ – high surface area;
mesoporous –
[3]
CTNT Co(OH)2intercalled in Na2Ti3O7 Co2+/Ti4+ 17 high surface area;
mesoporous
93 [3,16]
NTNT Ni(OH)2intercalled in Na2Ti3O7 Ni2+/Ti4+ 16 high surface area;
mesoporous
103 [3,16]
PTNT PtOx, PtOxClyor Pt(OH)xClydispersed on
Na2Ti3O7
Pt2+/Pt4+/Pt+δ 1.5 high surface area; Mesoporous
Joint Committee on Powder Diffraction Standards (JCPDS) as well.
Raman spectroscopy measurements of the solids were performed on a LabRAM HR Horiba Scientific spectrophotometer with laser line of 633 nm. The laser power on the sample was 0.5 mW. The measurements were calibrated by referencing Si at 521 cm−1.
Transmission electron micrographs were recorded on a high-re-solution transmission electron microscope (JEOL JEM 2010F) with an acceleration voltage of 200 kV. High Angle Annular Dark Field-Scanning Transmission Electron Microscopy (HAADF-STEM) micro-graphs were obtained on the same microscope by using an electron probe of 0.5 nm of diameter and a diffraction camera length of 10 cm.
Scanning electron micrographs and solid composition were de-termined on a FEI, Quanta 200 FEG electron microscope equipped with an EDS system coupled to a SEM microscope at 2 kV.
The Brunauer-Emmett-Teller (BET) surface areas were obtained from nitrogen adsorption-desorption isotherms at 77 K (BELSORP-mini II). The pore size distributions were obtained from using Barrett-Joyner-Halenda method (BJH).
Acidity measurements were performed through temperature pro-grammed of pyridine desorption of pyridine (TPD-Pyridine) followed by thermogravimetry (TG) measurements. IR spectra were recorded on a TGA/DSC1 Mettler Toledo equipment coupled to a SDT 2960 (TA Instruments).
The oxidation states of Co, Pt, and Ni species were determined by X-ray photoelectron spectroscopy-XPS (Physical Electronics PHI 5700) using the Mg-Kαline at 1253.6 eV as the excitation source. The binding energies were calibrated using the C 1speak (284.8 eV).
2.3. Catalytic studies in the acetalization of glycerol with acetone
Catalytic testing were performed for acetalization of glycerol with acetone reaction in a batch reactor from Parr Instruments at 150 rpm with using a temperature range of 50–110 °C. About 130 mg of the samples were placed in the reaction initially at 50 °C and a molar ratio of acetone to glycerol = 1:1 under nitrogenflow. The later parameter was also varied to better understand the effects of the composition on the catalytic performance. Blank experiments showed that without the catalysts, the reaction takes place with conversions lesser than 3%.
The quantitative analysis of the products and reactants was carried out by gas chromatography using a G-8000 Intercrom coupled to FID detector. The dimethylformamide was used as internal standard. Products identification was conducted by liquid chromatography using a Shimadzu QP5050 CG-MS equipment, with 4 analysis segments and
range of 70–240 °C. In all experiments, the performances of the solids were evaluated in terms of conversion of glycerol and selectivity to the products[3].
Recycle studies were conducted at 50 °C, 130 mg of catalyst, using acetone to glycerol molar ratio of 1. After the first acetalization of
glycerol run with the fresh catalysts, the reaction was allowed to settle and the catalyst was removed from the reactor washed with chloroform and dried at 35 °C for 6 h. The subsequent runs were continued by adding the aforesaid catalyst to perform 5 runs.
The turnover frequency (TOF) was calculated based on the number of molecules reacted at each available catalytic site per time.
3. Results and discussion
3.1. Effect of the metal addition in TNTs on the catalytic performance
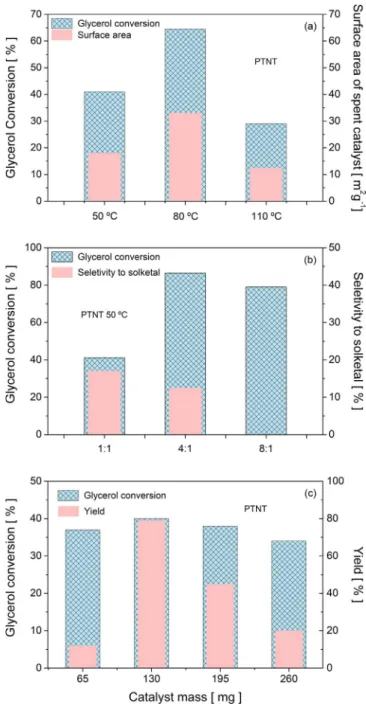
Fig. 1exhibits the effect of sort of M (M = Pt, Co, Ni) solids on the acetalization of glycerol with acetone performance. Although the solids are active in the reaction (Fig. 1a) the presence of metals results in different performances. This is consistent with the physicochemical features of the materials. That is to say, the fresh materials are com-posed of Na2Ti3O7.xH2O trititanate nanotube phase coexisting with Co and Ni ions incorporated to the TNTs as Co(OH)2intercalled and Ni (OH)2phases, respectively for CTNT and NTNT (TEM, XRD and Raman measurements inTable 1). In case of PTNT, Pt is found to be outside the tubular structure as either PtOxor PtOxClyspecies dispersed on alkali trititanate phase[16].
Acidity measurements by TPD-pyridine suggest that the acidity of the MTNTs may be a determining factor in their performance, as PTNT possessing the amount of ca. 261μmol Py gcat−1displays the higher glycerol conversion (Table 1). Surface acidity studies of Pt species, re-veals that oxidized PtOx(PtO or PtO2) and chlorine (Pt(OH)xClyand PtOxCly) chemical entities have medium to strong acidities but not superacidic sites [19,20]. In fact, PTNT combine acid sites of mild acidity from Na2Ti3O7phase and strong Lewis acidity of the aforesaid Pt-related phases. The extremely high acidity of chlorinated entity as for Pt(OH)xClyand PtOxCly[19–21], which is indeed a Lewis acid site plays a key role in the activity and selectivity to the products in glycerol acetalization. This may cause the start of parallel reactions involving acetone, as later shown by the products formed during the 6 h of cat-alytic run.
Moreover, PTNT acidity can be associated with the highest densities of surface acidic groups such as Brønsted and Lewis acid sites dispersed in a very high surface area or included inside the pores (XPS and tex-tural properties results)[3,16]. However, by introducing Co and Ni species in TNT, the amount of acid sites is lower than that of PTNT, even if the acid sites present on the CTNT and NTNT are quite similar in terms of amounts; hence, these materials are less prone to promote acetalization of glycerol with acetone, compared to PTNT. A role for NiO low acidity in alkane isomerization is supported, by the conclu-sions drawn by Guo[22].
Also, the Co species hold species with weak acidities as for Co/ZrO2 and Co/MgO catalysts applied to glycerol related reactions [23]. However, the Co entities exhibit higher activity than the Ni ones. In-terestingly, the Na2Ti3O7 alkali trititanate has mild acidity and its catalytic performance in glycerol acetalization is negligible, in contrast to H2Ti3O7one, owing to exposure of the inner surface of protonic TNT that retaining the structure after the catalytic test[3]. These features enable the materials studied to catalyze the acetalization of glycerol with acetone.
Additionally, the surface area and porosity of spent TNTs follows the order: NTNT < PTNT < CTNT, which is the opposite catalytic performance trend, except for PTNT. When comparing CTNT and NTNT solids, glycerol conversion tends to decrease slightly with increasing the textural properties. Although the good dispersion of Co species inter-called on TNTs is favorable for the reaction, it seems to suppress the Fig. 1.(a) Catalytic performances for acetalization of glycerol with acetone of MTNTs
glycerol interaction with acetone due to the lack of stability of CTNT, as latter shown by other characterization techniques. Moreover, glycerol conversion on NTNT is quite low (< 7%), which is characteristic for the Ni species leaching from the solid. On the contrary, Ni dispersed in multi walled carbon nanotubes e.g., Ni/MWCNT tested in mild glycerol acetalization reaction conditions achieved good catalytic performance [24]. Judging from the fact that a much harsh conditions are used in this work, leaching of the Ni nanoparticles may cause the structure collapse of the nanotubes, as further observed by TEM.
Remarkably, platinum addition on TNT promotes the activity of the PTNT catalyst and glycerol conversion is close to 40%, as can be seen in theFig. 1a. The reason for the good catalytic performance could be explained as follows. Assuming that the textural properties of PTNT
after the catalytic reaction is half part of that of CTNT catalyst, Pt species may be located in both interlamellar and decorating the TNT surface and these positions may determine the accessibility to the re-actants to the PtOxor the oxichlorinated Pt active sites. In addition, the acetalization reaction is catalyzed initially by the attack of the carbonyl group from acetone to Pt nanoparticles dispersed on TNT structure, as suggested inFig. 1b. Thus, Pt is coordinated with the carbonyl group of the acetone and glycerol to form an intermediate (step 1, Fig. 1b), which interact with the proton of the TNT structure to obtain acetal and solketal, respectively step 1a and 1b (Fig. 1b).
may occur (step 2,Fig. 1b). Towards further bonds formation between the carbonyl oxygen atom and theβ-carbon of the glycerol are formed and thus, the dehydration of glycerol gives the formation of solketal product. As expected, the selectivity to solketal is close to 18% with a poor acetal production for PTNT whereas the selectivities are not measured for NTNT and CTNT due to the low conversions levels achieved.
Thus, either Ni or Co interactions with TNT are different from that of Pt (if existing at all) or the former metals do not provide any sig-nificant TNT enhancement of the catalytic activity.
Based on these observations, PTNT is chosen for the study of the optimization of the catalytic reaction conditions to improve its catalytic performance. A schematic illustration of catalytic action of PTNT is given inFig. 1c.
3.2. Optimization of the reaction conditions with PTNT
Effects of temperature, acetone to glycerol molar ratio and catalyst mass are examined to improve the conversion and selectivity using PTNT catalyst. Results are shown inFig. 2.
3.2.1. Effects of temperature on PTNT performance
A screening of temperature reaction is carried out over all solids (Fig. 2a). The results display a not straightforward correlation between the catalytic results and the temperature by following afixed catalyst mass of 130 mg and acetone to glycerol molar ratio of 1 condition. For instance, PTNT has a very high conversion value of 40% at 50 °C whereas NTNT and CTNT have less than 5% of glycerol conversion. Further increases in the temperature beyond 50 °C did not further im-prove catalytic performance of NTNT and CTNT, where steady deacti-vation results in glycerol conversion steadily dropping to zero. In-dependent of the temperature tested, sodic TNT has no activity due to the lack of acid sites to catalyze the reaction.
As implied by the exothermic nature of the acetalization of glycerol with acetone reaction[19,25], the temperature increment on the re-action drops the rere-action rates and the solids became generally sensitive to deactivation, as well. Another point to be emphasized is that Ni and Co are well known by their cleavage of C–C bonds of glycerol abilities [26,27]. Though, the acid sites present on Na2Ti3O7 surface and the
interlaced Co(OH)2 and Ni(OH)2 onto TNT structure have been ex-tensively explored[3]. So far, they are not effective to promote
clea-vage of O–H bonds from glycerol to produce solketal and acetal at temperatures up to 50 °C due to the leaching of these species from the solids. This deactivation phenomenon is later confirmed over Co and Ni
chemical entities by TEM and XPS.
On the contrary, the reaction temperature rises from 50 to 80 °C over PTNT resulting in a glycerol conversion increase to more than 86%. This effect is most probably due to the Pt species action at ele-vated temperatures than the temperature increment. In agreement, studies on platinum species in acid catalysts clearly show that Lewis sites such as Pt(II) complexes as well the Brønsted acid sites from the TNT itself were highly active for the acetalization of aldehydes or
Fig. 1. (continued)
ketones with the Lewis ones exhibiting interactions with O–H and C–H bonds with little to no coking[27,28].
Further increase of temperature to 110 °C, a dramatic deterioration in the glycerol conversion is observed, being restricted to 30% due to lesser contact between glycerol in liquid phase and acetone in the gas phase [28,29]. As a result, parallel reactions such as glycerol dehy-dration and etherification reaction over metal-containing acids sites may occur, similarly to thefindings reported by Zhang[30]. Moreover,
the formation of 1,2,3-propanetriol monoacetate and 2,2-dimethyl-[1,3]-diozane-4-il-methanol with selectivity of 50% at 80 °C may be due to the total oxidation solketal.
Although temperatures higher than 50 °C increase the conversion, this effect lowers the selectivity to low solketal and acetal products by forming 2-hydroxypropan-2-yloxy)propane-1,2-diol, 1,2,3-propanetriol monoacetate and 2,2-dimethyl-[1,3]-diozane-4-il-methanol, 3-(2-hy-droxypropan-2-yloxy)propane-1,2-diol and byproducts of condensa-tion, as a result of glycerol and acetone secondary reactions. It may also be that at 110 °C, the suppression of the textural properties with the consequent drop of the conversion is responsible for a decrease in the catalyst’s selectivity to solketal of ca. 70%.
3.2.2. Influence of the acetone to glycerol molar ratio on PTNT performance The influence of the acetone to glycerol molar ratio on the catalytic performance of PTNT is studied to verify the importance of close in-teraction of Pt species and the reactants.Fig. 2b displays the results of testing PTNT at various acetone to glycerol molar ratios. It is noted that the acetone to glycerol molar ratio increase from 1:1 to 4:1 leads to enhanced glycerol conversion from 40 to 86.5%, respectively. In turn, it supports the idea that the Pt atoms on the TNT surface promote the formation of a cation from the protonated hemiacetal reaction from acetone (Fig. 1b) to achieve high catalytic performances. Hence, Pt species such as PtOx, Pt(OH)xClyor PtOxCly, which are seen later by TEM and XPS are functioning as effective active catalytic component for enhancing TNT activity. Also, the aforesaid species may have been acting stabilizing the solid against phase transformation, in a similar way as the Pt-based catalyst for acetalization of aldehydes and ketones reactions[27].
Furthermore, there is a steady drop in the conversion over 10% of its initial conversion and with no measurable selectivity to solketal and acetal products with using the acetone to glycerol molar ratio of 8:1. Without the close contact among acetone, glycerol and the catalyst afforded by the high amount of acetone molecules in the reaction media upon using this condition at 50 °C and thus, there is no glycerol reaction with acetone. This implies that the Pt is promoting selectivity towards monocyclic side products from either acetone or glycerol reactions. Previousfindings also indicate that most of the HTi3O7−formed in the reaction media carries strong negative surface charges giving electro-static binding sites for the positively charged carbocations from acetone parallel reactions[3].
3.2.3. Effect of catalyst mass
The effect of the catalyst mass on the catalytic performance of PTNT is investigated (Fig. 2c). As the catalyst loading increases from 65 to 130 mg the conversion of glycerol slightly increases from 37 to 40% and then the conversion decreases to values close to 34% with further in-crement in the catalyst mass. In other words, there is no improvement in the conversion with increasing the amount of the active sites more than 130 mg due to the agglomeration of PTNT sites.
On the contrary, the yields exhibit a distinct behavior from that of conversion. An increase in the catalyst mass from 65 to 130 mg results in the percentage yield increased appreciably from 5 to 79% and then the yield declines slightly to 10% with increment in the catalyst mass. This indicates that the expected condensation of solketal with other molecules takes place although its concentration in the product mixture decreases.
At acetone to glycerol molar ratio of 1:1 using 130 mg catalyst, the
corresponding glycerol conversions are higher than that for the 4:1 and 8:1; this further implies that the Pt addition to TNT constitutes an un-precedented sample of improved resistance to leaching and phase transformation, later shown by the characterizations of the spent solid.
3.2.4. Recyclability studies on PTNT
The recyclability studies were conducted with the optimized PTNT catalyst in order to gain a deeper knowledge on the process and es-tablish an activity/deactivation relationship for the solid. The reaction conditions used in these experiments were at 50 °C, catalyst mass of 130 mg with acetone to glycerol molar ratio of 1. The mixture was al-lowed to react for 6 h for each run. Afterwards, the catalyst was re-covered from the reaction mixture by centrifugation, washed with CH2Cl2, dried and reused in the subsequent run at regular 24 h inter-vals. The reaction progress was monitored by GC and the liquidfiltrated
was also analyzed by ICP-OES.
Following this methodology, the PTNT catalyst was reused 1 time without any loss in the conversion, affording 10% of solketal and 0.7% of acetal with 46.2% of byproducts formation (Table 2, entry 1). Moreover, the result of entry 1 inTable 2demonstrates that thefirst use of the solid in 24 h gives a TOF of 25 h−1.
The entries 2 and 3 illustrate that thefirst three runs correspond to
similar results, in terms of selectivities to the products whereas a de-crease in glycerol conversion from 37.4 to 28.8% is observed with a TOF of 10 h−1, entry 2 and 5 h−1, entry 3. On the contrary, a loss of percent of metal content of 57% is observed when comparing the 1st with the 3rdrun. At this stage, the metal leaching is not the cause of the observed deactivation due to the stability of the solid.
On the other hand, the successive runs carried out under the stan-dard experimental conditions show the PTNT catalyst performance significantly decreases with a large amount of byproducts formation,
namely others. For instance, the conversion after fourth and mainly in thefifth runs is about 6 times lower than that of entry 3. While the selectivity to the products remains practically unchanged, the entries 4 and 5 depict that the deactivation of the catalyst leads to a TOF of less than 1 h−1. Therefore, we conclude that some catalyst losses have oc-curred during this step; thus, a limited amount of fresh catalyst (< 4% of the total weight) was also added to the reaction medium. Nevertheless, results clearly show that the solid displays, a rather good reusability during the threefirst cycles with a stabilization of the cat-alytic parameters. However, a rapid deactivation of the active sites is experienced, after 3 uses as a consequence of the changes in the structural and morphological features.
This observation may suggest the physical degradation of the solid only after the third run, as later shown by SEM image, which indicate that the morphology of PTNT is changed. Also, the presence of large Pt particles attached to the surface of the solid is detected by EDS analysis, reinforcing this assumptions.
The fact that the either sintering or phase transformation may occur probably explains the poor performance of the solid, only after the 4th
Table 2
Recycling experiments of glycerol acetylation with acetone in 24 h intervals for each reaction cycle. Reaction conditions: temperature 50 °C, acetone to glycerol molar ratio of 1 and catalyst mass of 130 mg.
Entries [cycles]
Glycerol conversion [%]
Selectivity [%] TOF [h−1]
Solketal Acetal Othersa
1 46.7 10.0 0.7 46.2 25
2 37.4 10.2 5.6 53.2 10
3 28.8 10.8 – 40.0 5
4 16.6 11.0 – 60.6 1
5 5.3 11.1 – 60.4 0.3
aOthers include 2-hydroxypropan-2-yloxy)propane-1,2-diol, 1,2,3-propanetriol
run. Hence, PTNT can be successfully reused for three times under identical reaction conditions, without any noticeable drop in the cata-lytic performance.
3.3. Physicochemical features of spent MTNTs catalysts
3.3.1. Structural features by XRD and Raman
Examining the XRD patterns of the spent NTNT and CTNT catalysts tested at 50 °C (Fig. 3a) can provide insight into the cause of deacti-vation of these solids. Accordingly, the Na2Ti3O7trititanate nanotube phase remains in both solids with the signature of the broad peak at around 2θ= 9.5° (1 0 0)[3,31,32]. Moreover, peaks intensities indexed to 2θequal to 24.2 (0 1 1), 28.3 (1 1 1) and 48.6° (3 0 3) from CTNT and NTNT can be associated with the layered titanate structure belonging to theP21/mspace group. In addition, the disordered species dispersed into the interwall region of the nanotubes such as Co(OH)2and Ni(OH)2 are a result of intercalation of Co and Ni, respectively ions. These fea-tures are detected through the broad and weak peaks at 2θvalues of 33.7 and 38.7°. Also, interwall distances of the fresh solids vary from 0.92 to 0.90 nm for the spent ones, which confirm these hypotheses. A good agreement exists between these features and low catalytic per-formance, which means that these species are not able to catalyze the glycerol acetalization reaction.
XRD pattern of spent PTNT found similar peaks to those of CTNT and NTNTi.e., Na2Ti3O7, independently of the temperature studied. In other words, the PtOx, Pt-chlorinated species located previously on the outermost surface of the nanotubes (Table 1) may be dispersed on TNT affecting the catalytic performance.
Raman measurements of the spent MTNTs are performed to get complementary insights into the structure of the solids, after being tested at 50 °C, acetone to glycerol molar ratio of 1 and using a catalyst mass of 130 mg during 6 h.
Fig. 3b and c show the spectra recorded with different metals. As previously shown, sodic TNT displays optical active Raman modes at about 145 (E1g), 185 (Eg), 272 (Ag) 442 (B1g) 674 (A1g), 708 (Ag) and 930 (Bg) cm−1. The main modes are ascribed to Ti–O–Ti stretching vibrations from the TiO6octahedra from edge-sharing TiO6octahedra forming corrugated layers[3,16]. The similarities between the Raman spectrum of the sodic TNT and the Raman features of the metal-con-taining TNTs (Fig. 3b) suggest that the modes are attributed to be from the lattice and Na–O–Ti vibrations from Na2Ti3O7 phase with layer structure, as previously indicated by XRD.
In addition, vibrations in the 800–950 cm−1range corresponding to stretching of not shared Ti–O terminal bonds indicate the existence of residual Na ions from ion exchange process, notably in NTNT and CTNT. Further, except for the downshift and weak intensities of the modes observed in all Raman features, the spectrum of PTNT is similar to that of NTNT and CTNT. It is apparent that the phase structure does not change on CTNT and NTNT, but under the conditions used at 50 °C and acetone to glycerol molar ratio of 1, the Co and Ni ions included into TNT structure may be leached from the solids decreasing their catalytic performance.
It is noteworthy that the acetone reacts readily with glycerol to form the products of the reaction, as observed on CTNT and NTNT catalysts. Accordingly, the very weak Raman bands at about 485, 585 and 821 cm−1 are associated with byproducts of the reaction while the mode at Raman at 708 cm−1evidences the strong O
⋯C–O interactions
between glycerol and acetone molecules [33–36]. Importantly, at 647 cm−1the assignment of solketal formation is corroborated by the
findings[33]. However, the abovementioned reaction conditions
pre-ferentially give the adsorption of solketal and byproducts on PTNT surface decreasing the intensity of the Raman modes.
At high frequency regions (Fig. 3c), the vibrations arise at around 1132 cm−1 (C
–O stretching), 1227 cm−1 (CH
2 twisting), 1339 cm−1 (CH2twisting) and 1466 cm−1(C–H twisting) due to the glycerol mo-lecule adsorption on CTNT surface, as found elsewhere[34,35]. The
findings have demonstrated the presence of acetone mode at about 1595 and 1718 cm−1, in agreement with our results at around 1700–1834cm−1(C]O stretching)[34].
3.3.2. Morphology and texture
Fig. 4a shows EDS analyses and SEM images of the MTNTs tested at 50 °C, acetone to glycerol molar ratio of 1 using 130 mg of catalyst. The particles consist of a bunch of bundles in an agglomerated form, as consequence of either phase transformation or structural collapse of the solid to produce particles with irregularly shaped morphology, after the catalytic test. The morphological aspects of NTNT and PTNT seem to be a great agglomeration of tangled nanosheets whereas CTNT one has a lesser density of titanate nanotubes.
It is worth noting that the EDS analyses reveal the presence of Co, Ni, Pt, Na, Ti, O and C, as the main constituent of the solid surface. Interestingly, the amount Na over NTNT is much higher than those of PTNT and CTNT. According to the previous studies[3], a decreased acidity due to the excess of Na result in an ineffective catalyst for gly-cerol acetalization. Moreover, similar phenomena may occur in the NTNT possessing low glycerol conversion.
Besides, the presence of Co and Ni chemical entities on solid surface does not provide active sites able to catalyze the reaction. Accordingly, the Me/Ti ratios of CTNT and NTNT are 0.23 and 0.16, respectively and these values lower than the theoretical value of ca. 0.33, as a result of either the intercalation of the ions into the structure or the leaching of Ni and Co, as suggested by XRD and Raman. From EDS measurements,
the amount of Pt upon using this condition is less than the actual content of Pt of ca. 1.5 wt%, confirming the slight leaching of the Pt
species from the solid surface without affecting the catalytic perfor-mance.
In agreement with the morphological features, the nitrogen ad-sorption-desorption analysis reveals the lesser surface area and pore volumes for NTNT and PTNT while the elevated textural properties are observed over CTNT. Accordingly, the N2physisorption measurements illustrate the formation of a type IV isotherm possessing a H3hysteresis, typical of non-rigid aggregates of plate-like particles for PTNT (Table 3, Fig. 4b). This hypothesis is also supported by previous results achieved on similar MTNTs[3]. Thus, it can be suggested that the solid have the mesoporosity preserved, after the catalytic test.
On the other hand, the hysteresis loops of CTNT shift to the relative pressure high regions, having a decrease in its hysteresis area. This means that any collapse in CTNT structure due to either leaching or sintering of the metal nanoparticles included in the titanate nanotubes is likely. Also, micropores volumes and areas are superior to those of the mesopores ones in CTNT, probably due to the changes in the morphology of the nanotubes, after the catalytic test. Additionally, the small pores with a diameter lesser than 10 nm may correspond to the pores inside the nanotubes whereas pores diameters are associated with the inner diameter of the nanotubes, being the largest ones e.g., 10–40 nm corresponding to aggregation of the nanotubes, in line with thefindings[37,38].
Besides, the type I isotherm obtained for NTNT spent solid is
(b)
interpreted as the majoritary presence of micropores in the tubular structure, which results in low catalytic performance. This is in reason of the easy Ni leaching or sintering and growth of the particles, as stated previously. Accordingly, the corresponding pore diameter curves show a narrow pore size distribution of the NTNT nanotubes with an average value of ca. 6 nm (Fig. 4b, included), which is indeed the lowest among the solids studied. Moreover, PTNT tested at 50 °C exhibits a wide pore size distribution ranging from 1.5 to more than 40 nm. Besides, the solid exhibits surface area of ca. 18 m2.g−1and an average diameter of ca. 18 nm including the micropores.
3.3.3. Surface composition and oxidation states
The surface properties of the MTNTs are investigated thoroughly by XPS to understand the oxidation states of metals interacting with tita-nates nanotubes and their surface atomic concentration. All solids show the XPS signal of Ti 2pwith binding energies located at 457.2 eV and 463.3 eV, respectively from Ti 2p3/2 and Ti 2p1/2 levels (Table 4). Hence, the Ti4+ions from the trititanate structure are on the surface of the solids[3,39], as indicated by XRD and Raman.
The XPS O 1sspectra exhibit different features regarding the surface
properties. For instance, CTNT has the typical binding energy values of Ti–O bonds at 528.6 eV in addition to a peak located at 530 eV from Ti–OH[40]. Additionally, the core level binding energy of the Co 2p displays two major peaks at 781.4 and 797.1 eV corresponding to Co 2p3/2 and Co 2p1/2, respectively. One pair of satellites at 787.2 and 803.1 eV assigns to Co2+ions from CoO[41]. Very interestingly is the presence of the Co 2pcomponent at 803.1 eV on the high energy side clearly indicating a weak interaction with the TNT support. A re-presentation of the coverage of cobalt species on the surface of the TNT is given by the Co:Ti peak area ratio, which is found to be 0.037, suggesting the occurrence of leaching as compared with the fresh sample[3].
XPS spectrum of O 1sfrom NTNT shows BE at around 529 eV, which is assigned to the O2−lattice oxygen bounded to Ni2+in NiO nano-particles whereas the peak at around 530 eV is attributed to O2−lattice oxygen bounded to Ni3+and/or oxygen from hydroxyl group bounded to nickel. In agreement, the scan of NTNT spectra revels the Ni 2pcore level with components at binding energies of 853.2 eV for Ni 2p3/2from NiO whereas the BE at 855.6 eV from Ni 2p1/2is due to Ni3+species. In comparison to O 1score levels of CTNT, the NTNT spectrum exhibits binding energies shifting upward systematically due to the transfor-mation from nanotubes to nanosheets. This fact confirms that, rather than the strong interaction with the support, the NiO species as Ni2+ oxidation state is weakly interacting with TNTs and therefore migration from the ionic exchanges sites to the solid surface may occur, as found elsewhere[42]. Indeed, the surface of the, Ni species are found with relative amounts of 1.3% on the surface of the solid, as compared with the 3.4% of the fresh sample[3]. This result illustrated that leaching of the Ni2+species during the reaction is the leading cause of the deac-tivation of NTNT catalyst.
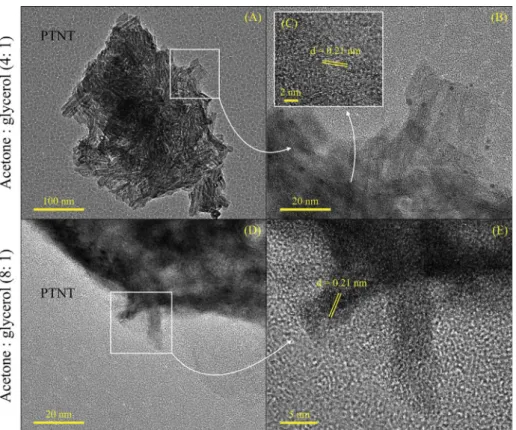
Fig. 4c depicts the XPS spectrum of Pt signals. As it can be seen, the Pt 4fcore level appear to be very broad with very small shoulders,
which is frequently assigned to the presence of different oxidation states of Pt along with major Pt2+. Thus, the low BE value of 72.2 eV can be assigned to Pt 4f7/2level from PtOxspecies, such as PtO[43–45]. Whereas the one at 74.8 eV corresponds to platinum chloride species, in accordance with the Cl 2p level from Pt-chlorined species in the 198.7–200.6 eV range. Thefindings states that the aforesaid species are
probably from the hexachloroplatinic acid precursor [44,45]. These results seem to be consistent with the observations of Lin et al. and explain the diffusion of Pt atoms into the TiO2lattice to be oxidized to Pt2+, which is substituted for Ti4+or forms interstitial ions at a tem-perature as low as 200 °C[45]. Moreover, 27% of platinum is present in the form of Pt-chlorined species while 73% appears as PtO. Of parti-cular importance, the peak at 74.8 eV can be attributed to the stabili-zation of only one type of Pt4+oxidation state (e.g., PtO
x) after the catalytic test, in line with reference[44]. This entity may strongly in-teract with the TNT support on surface and more electron transfer be-tween the active component and the support (metal-support interac-tion) is likely. Due to this interaction, PTNT gave high activity and selectivity towards acetalization of glycerol.
Moreover, peaks at 284.7–288.9 eV range are assigned to be from C 1sfor all spent MTNTs and accounts only for 9.0% of the total surface composition.
3.4. Spent characterizations of PTNT tested at different reaction temperatures
3.4.1. Structural features
The structural features of the PTNTs tested at different reaction temperatures are investigated by X-ray diffraction patterns (Fig. 5a). XRD analysis displays peaks in the same 2θpositions as that of the Na2Ti3O7phase. Remarkably, the peaks at 2θequal to 18.1° (0 0 1) and 26.4° (0 2 2), which are assigned to the presence of PtOxspecies in the fresh solid (space groupP42/mmc, ICDD 00-043-1100) are not observed at 110 °C. Thus, the Pt particles on the solids tested at different tem-peratures are below the sensitivity limit of XRD technique.
Table 3
Textural properties obtained by the nitrogen adsorption-desorption isotherms of the spent titanate nanotubes containing metals.
Sample Molar ratio of acetone:glycerol Temperature [°C] aS
gBET[m2.g−1] Microporous t-plot [m2.g−1] bPore volume [cm3.g−1] bMesopore diameter [nm]
CTNT 1:1 50 76 236 0.31 16
NTNT 1:1 50 5 6 0.01 6
PTNT 1:1 50 18 37 0.08 18
PTNT 1:1 80 33 81 0.16 20
PTNT 1:1 110 13 26 0.04 13
PTNT 4:1 50 27 85.9 0.14 21
PTNT 8:1 50 12 33 0.07 22
aFrom Brunauer-Emmet-Teller (BET) method. bFrom Barrett-Joyner-Halenda (BJH) method.
Table 4
XPS data of the spent MTNT solids. The solids were tested at 50 °C, acetone to glycerol molar ratio of 1, using 130 mg of catalysts during 6 h of reaction time.
Sample Binding energy [eV]
Co 2p Cl 2p Pt 4f Ni 2p Ti 2p C 1s O 1s
CTNT 781.4 787.2 797.1 803.1
– – – 457.2
463.3 285.0 286.6 288.9 528.6 528.6
NTNT – – – 853.2
855.6 457.0 465.1 284.7 286.6 288.7 529.0 530.0
PTNT – 198.7
200.6 72.2 74.8 – 457.1 465.2 284.9 286.5 529.7 531.6
To confirm these hypotheses, Raman spectra are recorded for PTNT at different reaction temperatures (Fig. 5b and c). At 50 and 80 °C, the spectra do not exhibit significant changes in profiles and positions confirming the presence of the sodic trititanate, in agreement with XRD
measurements. As mentioned previously in Section3.2, the vibrations of adsorbed byproducts are apparent after the reaction at around 243, 483, 540 and 820 cm−1(Fig. 5b). Also, a very weak Raman band ob-served at 755 cm−1is ascribable to the interaction between the OH group from glycerol molecule and the carbonyl group of the acetone whereas acetone is discernible through the mode 380 cm−1. Further-more, Raman bands pertaining to solketal at about 667, 701 and 931 cm−1are found, in line with thefindings[33]. Interestingly, the translational modes in the 100–200 cm−1range have experienced a blue shift and some modes are vanished from the spectra at 110 °C. Although no phase transformation is observed by XRD, the Raman measurement suggest that the sintering of Pt species might have
occurred, which in turn account for the low performance of the solid at 110 °C. This is later supported by the observations from SEM and TEM taken in the same conditions.
At high frequency regions (Fig. 5c), the spectrum recorded at 50 °C exhibits predominantly a weak mode at about 1463 cm−1, which in-dicates the presence of adsorbed glycerol molecules (i.e., C–O stretching), as stated previously. Moreover, the bands arising at 80 °C with vibrations at around 1330 and 1460 cm−1are typical of the ter-tiary alcohol vibrations from solketal and glycerol, respectively [33,35]. Besides, the spectrum taken at 110 °C displays the formation of carbonaceous species on solid structure through the D and G bands. These bands are assigned to be from the bond stretching of all pairs of sp2atoms in rings and chains as well as the breathing modes of the rings [46]. According to the literature, the G band is related to the C–C vi-bration of the carbon material with asp2orbital structure while the D band is due to the disorder-induced vibration of C–C bond[16,46]. The origin of the carbon deposition on PTNT at 110 °C can be explained by the decomposition of acetone derived byproducts contributing to the formation of carbon species on PTNT surface, which in turn give a lesser catalytic performance of the solid at this condition.
As shown that Na2Ti3O7 has no activity, the leached PtOx and chlorined-Pt species may catalyze the reaction at different tempera-tures.
The spectra of the PTNT reused 3 times at 50 °C and raw glycerol are illustrated inFig. 5d and e. At low frequencies regions (Fig. 5d), the Raman modes assigned to be from glycerol in both spectra are seen at 1465 cm−1(CH
2scissoring), 1252 cm−1(in plane O–H deformation), 1111 cm−1 (C
–O stretching), 844 cm−1 (C
–C–O stretching), and 393 cm−1(C
–O deformation vibration)[34]. Also, bands from acetone are apparent at about 1702 cm−1 (C]O stretching), 1419 cm−1 (asymmetric CH3 deformation) vibration (CH3–C(O–)), 1223 cm−1 (C–C stretching), 487 and 331 cm−1(
–C–(O)–C in plane deformation). Interestingly, the modes of solketal are observed at around 600–700 cm−1, 1401 and 1648 cm−1 [35]. The formation of an acetone-glycerol adduct stable intermediate that can be inferred by the presence of a mode at 732 cm−1can not be ruled out, as found else-where[33]. At high frequency (Fig. 5e), the hydrogen-bonded O–H intermolecular vibrations at 3318 cm−1along with the bands at 2960 (CH2 asymmetric stretching) and 3115 cm−1 (OH asymmetric stretching from water) are indicative of the glycerol molecule in the spectrum of the trialcohol[34]. On the contrary, only the bands at 2900 and 2950 cm−1from soketal are found in the PTNT spectrum. This is indicative that the reused sample is efficient for glycerol and acetone conversion.
3.4.2. Morphology, texture and chemical composition
At distinct temperatures, SEM images reveal similar features to that of Fig. 4a, exhibiting agglomeration of tangled nanotubes forming sheets, especially at 80 °C (Fig. 6). On the other hand, the Pt is indeed in a large cluster on the solid surface (dashed line circle), when the cat-alytic reaction is performed at 110 °C. These effects on the solids morphology are a result of the simultaneous coking and sintering of the Pt species, as demonstrated by Raman.
The changes in the morphology of PTNTs particles after the catalytic tests are confirmed by the TEM micrographs (Fig. 7). After testing PTNT at 50 °C, some nanotubes tangled together forming nanosheets with the others keeping their original elongated tubular structure (Fig. 7A). The HAADF-STEM (Fig. 7B) images suggest the presence of small Pt sphe-rical particles (1–3 nm in diameter) highly dispersed and adhered to the inner- and outer-wall of the titanate nanotubes. The main reason is assigned to the PtOx, PtOxClyor Pt(OH)xCly species stabilization in PTNT as compared to the CTNT and NTNT counterparts, which can justify the better catalytic performance of the former solid. Similar features are observed for the solid tested at 80 °C (not shown). It is convinced that the PTNT is sensitive to the reaction condition studied. Hence, at 110 °C (Fig. 7C), PTNT nanotubes may suffer a severe Fig. 6.SEM images of PTNT tested at different temperatures of reaction. The white region
interlayered dehydration and possible lattice distortion forming a big cluster. As consequence, the nanoparticles migration from the inner-and outer-walls of the nanotubes to the adjacent titanate margins is observed (Fig. 7D). These observations are also corroborated with the
findings using gold-containing titanate nanotubes applied to oxidation
reactions at similar conditions of temperatures[41]. Also, a possible explanation to this phenomenon is supposed to be the particle growth e.g., sintering and carbon deposition on the titanates during the reac-tion. This is in line with the mean particle size values of 17 nm for PTNT tested at 110 °C and Raman results showing the formation of carbo-naceous species on the solid.
In addition, changes of the textural properties are noticeable, when the solid is tested at 80 °C (Table 2) with the solid retaining mainly the mesoporous structure. Apparently, the porous structure of PTNT is disrupted and poor textural parameters are observed at 110 °C due to coking.
3.5. Spent characterizations of PTNT tested at different acetone to glycerol molar ratios
3.5.1. Structure and chemical composition of the spent solids
Fig. 8a exhibits the XRD patterns of PTNTs at different acetone to glycerol molar ratios. Clearly, Na2Ti3O7phase is observed at acetone to glycerol molar ratios of 1 and 4, with no distinction among the dif-fractograms. Similar effects are found by varying the catalyst mass (figure not shown). However, the intensity of diffraction peak testing the solid at acetone to glycerol molar ratio of 8 results in much higher peak intensities than those of 1 and 4. In particular, the diffraction
peaks at 2θequal to 39.8 (1 1 1) and 48.0° (2 0 0) correspond to the face-centered cubic PtOxcrystal structure. These peaks arise together with a new peak centered at 2θ= 25°, which is assigned to be from graphite (0 0 2) plane. Also, additional peaks and shoulders at
2θ= 17.9, 27.3, 38.0 and 43.0° are superimposed on a diffuse pattern from the (0 1 1), (0 2 2), (1 1 1) and (0 0 4) planes of PtO2, PtO and chlorine Pt species, as well[3].
Raman spectra of the PTNTs nanotubes by varying acetone to gly-cerol molar ratio are illustrated inFig. 8b and c. The Raman features of the spent PTNTs tested at different reactants compositions may be roughly regarded as a sodic trititanate layered structure instead of the ion-exchanged PTNT (Fig. 8b). Furthermore, they are apparently dif-ferent from that of the fresh solids due to PtOxspecies stick out into the interlayer space of PTNT by leaching, as agreed by XRD. As discussed earlier, the spectrum of the PTNT indeed display very similar fre-quencies, line width and intensities of either the Na2Ti3O7or the ad-sorbed hydrocarbons, although some modes do appear in the vicinities of the protonic phase.
At acetone to glycerol molar ratios superior to 4, the modes display a redhshift being mostly overlapped, which can be ascribed to the presence of high amounts of acetone causing a softening of the modes. At high frequencies (Fig. 8c), the spectra are almost identical displaying very broad bands from the adsorbed hydrocarbons. It is interesting that weak modes at 1125, 1465 and 1720 cm−1relative to acetone to gly-cerol molar ratio equal to 4, appear to confirm the acetone interaction
with glycerol [33,35]. On the contrary, the fact that the elevated amounts of acetone such as 1:8 may underline dissimilarities among the spectra suggests a physical degradation of the catalyst upon using these conditions, relative to those for lower acetone to glycerol molar ratios. It is assumed that high concentrations of acetone is not an optimal condition to have efficient selective PTNT catalyst for glycerol acet-alization tofive-membered cyclic acetals due to acetone parallel reac-tion, as experienced at acetone to glycerol molar ratio of 8 at 50 °C using 130 mg of catalyst. These facts are closely related to the sintering of Pt species effects, as shown in the subsequent TEM and XPS sections.
3.5.2. Morphological and textural features and chemical composition of the spent solids
The morphology and particle distribution are shown inFig. 9. As it can be seen, EDS mapping is used to more clearly distinguish the dis-tribution of the elements on PTNT surface. As discussed earlier, the tangled nanotubes are aggregated forming sheets and their elements distribution e.g. Pt, Ti, Na and Cl are not uniform. In this case, Pt and Na compositions are almost not seen on the surface of the sample tested at 50 °C and acetone to glycerol molar ratio of 1. It may be ascribed to the interaction of solids with the hydrocarbons adsorbed on solid sur-face, in accordance with the previous report by Raman and XRD.
To gain further insights, representative selection of HAADF-STEM images is obtained (Fig. 10). It can be found that at acetone to glycerol molar ratio of 1, the sample displays nanosheets with well-shaped Pt Fig. 8.Spent characterizations of PTNT tested at different acetone to glycerol molar
ra-tios: (a) XRD patterns, (b) and (c) Raman spectra at low and high frequency regions, respectively. Reaction conditions were using a catalyst mass of 130 mg and T = 50 °C for 6 h of reaction and varying the acetone: glycerol molar ratio of 1:1, 4:1 and 8:1.
crystalline nanoparticles with average diameter of 1–5 nm. The surface of the nanotubes becomes more uneven and agglomerated with an in-crease of the acetone to glycerol molar ratio to 4 (Fig. 10A). Further-more, the solid presents not well-dispersed spherical-type nanoparticles included in the tangled nanotubes (Fig. 10B). Indeed, the crystalline Pt nanoparticles has evidently larger sizes with broad distribution be-tween 8 and 21 nm diameter, the 8 nm size being predominant. The interplanar spacing of ca. 0.21 nm matches well with (1 1 1) crystal plane of PtO2and PtO (1 1 0), as observed in the inset HRTEM image (Fig. 10C). This can possibly explain why upon using this condition, the PtOxnanoparticles are considered to act as anchoring sites that interact with hydrocarbons, improving the conversion but, some of these par-ticles grew and thus, they are easily leached from the solids, even at low temperatures.
In case of PTNT tested at acetone to glycerol molar ratio of 8, the sample has a fairly low tubular morphology in the presence of a much higher content of acetone (Fig. 10D). Of particular importance, the solid develops a morphology consisting of a not well-defined
nanosheet-shaped structure (Fig. 10E) possessing a wrinkled aggregation of the tubes. The structures have an average size of 26 nm. The larger particles could be formed because of the excess of acetone giving byproducts of acetone condensation on Pt sites that are free of interaction with the TNT support. Contrarily to the former conditions, the acetone to gly-cerol molar ratio of 8 may result in a solid with low stability and the nanoparticles are prone to sintering.
On the basis of these results, the synergetic effect between Pt na-noparticles and titanate nanotubes structure accounts for the excellent behavior of PTNT in acetalization of glycerol at 50 °C. This can be es-sentially regarded as the activation of glycerol by ether oxidized or chlorine Pt sites and TNT structure being these species thereby, acting as stabilizer for these active nanoparticles. From the interaction sug-gested inFig. 2a, the nanoparticles located on TNTs inner tubes could benefit from the acidic/redox properties of Pt providing a synergetic effect that can efficiently convert the reactants.
The BET surface areas and micropore volume of spent PTNTs are also measured to determine the correlation of the textural properties
with at different molar ratios of the reactants. At an acetone to glycerol molar ratio of 1, the surface area is around 18 m2.g−1, which is much lower than the other sample tested at acetone to glycerol = 4 (e.g., 27 m2.g−1) with similar trends for pore volumes. The rise in the textural properties with increasing the amount of acetone is mainly due to the migration of either chlorined Pt or PtOxspecies on the solid surface (e.g. 1.4 wt%), which may help to make stronger interaction between acetone and/or hemicetal intermediate through the electrostatic inter-actions. Especially for the acetone to glycerol molar ratio of 8, Pt loading on surface increases for 5.2 wt%, which also reflects the lowest textural properties of the solid upon using this condition. Thus, there is possibility of Pt species deposition on catalyst surface and phase transformation, which is confirmed by declining in BET surface area and pore volumes with the consequent decrease in the catalytic per-formances at acetone to glycerol molar ratios of 8.
According toTable 2, pore diameters values slightly increase with the increment in the amount of glycerol possibly due to the voluminous byproducts formation such as 2,2-dimethyl-[1,3]-diozane-4-il-methanol and 2-hydroxypropan-2-yloxy)propane-1,2-diol on the pores. There-fore, it can be speculated that some of the Pt particles may be confined inside the pore while the remaining within the nanotubes is assessable for acetone and glycerol reactants (about 0.23 wt%), resulting in a higher catalytic performance at acetone to glycerol molar ratio of 1.
In sum, the above observation from XRD and Raman, act in ac-cordance with the SEM-EDS, HRTEM and textural properties analysis results, revealing the existence of an optimum reaction condition to obtain a good performance of the PTNT at acetone to glycerol molar ratio of 1 and T = 50 °C, using 130 mg of catalyst.
In view of these premises, the relationship among the MTNTs structures, morphology and catalytic performances can be due to the strong interaction of Pt species and the trititanate phase, which is thought to be a key factor for the stabilization of PTNT under certain reaction conditions. Gratifyingly, only after the 4rd use of the solid in the reaction, PTNT deactivated and these results clearly improved those previously reported in the literature for glycerol acetalization with acetone, in terms catalyst stability[16,35].
Also, the spent solid characterizations suggest the causes of the deactivation after using PTNT in the reaction are based on the mor-phological and surface changes occurred during the acetalization of glycerol, which in turn have an impact in decreasing the activity and the selectivity of the products formed.
Specifically in case of NTNT and CTNT catalysts, the leaching of the active species is proposed as the origin of the deactivation of these species during the transformation of glycerol strongly confirming that
the Co and Ni species are indeed accumulated on the external surface of the solid and in the inner region of its pores, as well.
Lastly, MTNTs catalysts are used as it is without any additional pre-treatment unlike the reported ones[35]. Thus, this restrains the usage of other operations steps and makes it cost effective.
4. Conclusions
Catalytic reactivity of MTNTs towards glycerol acetalization with acetone is linked to the nature of the transition metal oxide presence in the catalysis. Although the inclusion of Pt, Co or Ni in the titanate nanotubes exerts distinct effects on the textural properties and acidity of the solids, the aforesaid properties did not determine the catalytic performance. The leaching of Ni and Co was higher comparing with the platinum catalyst, thus suggesting a stabilization of the trititanate structure by the presence of Pt. The reaction conditions control is cru-cial to help the optimization of the overall performances. As for, PTNT displayed at 50 °C with molar ratio acetone:glycerol equal 4, the best glycerol conversion (e.g., 86.5%) and high selectivity towards fi ve-member solketal, ca. 10%, when compared with the NTNT and CTNT counterparts. Resistance against deactivation by surface metal leaching, phase transformation and particle sintering exhibited by PTNT was due to the strong interaction of chlorine-Pt and PtOxspecies with the triti-tante structure. The reason for the stability and high recyclability of the solid in glycerol acetalization with acetone is the trititante phase sup-port in strong interaction with Pt ions.
Acknowledgements
We acknowledge the CNPq, CAPES/FUNCAP (Grants No 23038.008860/2013-92 and 23038.007964/2012-07) for financial support of this work. The authors acknowledge to Central Analitica da UFC for SEM-EDS measurements. ERC acknowledges the financial
support of the project CTQ2015-68951-C3-3R of MINECO and FEDER funds. Thanks to NADP for CG-MS analysis. We are thankful to Samuel Tehuacanero Núñez, and Dr. Jesús Arenas-Alatorre from LCM IFUNAM for the comments and support in the TEM images.
References
[1] E. Berliner, The mechanism of cyclization reactions, J. Am. Chem. Soc. 64 (1942) 2894–2898.
[2] M. Sutter, E. Da Silva, N. Duguet, Y. Raoul, E. Leta, M. Lemaire, Glycerol ether synthesis: a bench test for green chemistry concepts and technologies, Chem. Rev. 115 (2015) 8609–8651.
[3] D.C. Carvalho, A.C. Oliveira, O.P. Ferreira, J.M. Filho, S. Tehuacanero-Cuapa, A.C. Oliveira, Titanate nanotubes as acid catalysts for acetalization of glycerol with acetone: influence of the synthesis time and the role of structure on the catalytic performance, Chem. Eng. J. 313 (2017) 1454–1467.
[4] M.N. Timofeevaa, V.N. Panchenkoa, N.A. Khan, Z. Hasan, I.P. Prosvirin, S.V. Tsybulya, Sung H. Jhung, Isostructural metal-carboxylates MIL-100(M) and MIL-53(M) (M: V, Al, Fe and Cr) as catalysts for condensation of glycerol with acetone, Appl. Catal., A: Gen. 529 (2017) 167–174.
[5] M.J. da Silva, F.Á. Rodrigues, A.A. Júlio, SnF2-catalyzed glycerol ketalization: a friendly environmentally process to synthesize solketal at room temperature over on solid and reusable Lewis acid, Chem. Eng. J. 307 (2017) 828–835.
[6] S. Zaher, L. Christ, M.A.E. Rahim, A. Kanj, I. Karamé, Green acetalization of glycerol and carbonyl catalyzed by FeCl3·6H2O, Mol. Catal. 438 (2017) 204–213. [7] X. Hong, O. McGiveron, A.K. Kolah, A. Orjuela, D.J. Miller, Reaction kinetics of
glycerol acetal formation via transacetalization with 1,1-diethoxyethane, Chem. Eng. J. 15 (2013) 828–835.
[8] A.R. Trifoi, P.S. Agachi, T. Pap, Glycerol acetals and ketals as possible diesel ad-ditives. A review of their synthesis protocols, Renewable Sustainable Energy Rev.
62 (2016) 804–814.
[9] R. Rodrigues, D. Mandelli, N.S. Gonçalves, P.P. Pescarmona, W.A. Carvalho, Acetalization of acetone with glycerol catalyzed by niobium-aluminum mixed oxides synthesized by a sol–gel process, J. Mol. Catal. A: Chem. 422 (2016) 122–130.
[10] H. Serafim, I.M. Fonseca, A.M. Ramos, J. Vital, J.E. Castanheiro, Valorization of glycerol into fuel additives over zeolites as catalysts, Chem. Eng. J. 178 (2011) 291–296.
[11] G. Vicente, J.A. Melero, G. Morales, M. Paniagua, E. Martin, Acetalisation of bio-glycerol with acetone to produce solketal over sulfonic mesostructured silicas, Green Chem. 12 (2010) 899–907.
[12] S.S. Priya, P.R. Selvakannan, K.V.R. Chary, M.L. Kantam, S.K. Bhargava, Solvent-free microwave-assisted synthesis of solketal from glycerol using transition metal ions promoted mordenite solid acid catalysts, Mol. Catal. 434 (2017) 184–193. [13] M. Kapkowski, W.A. Zkiewicz, T. Siudyg, R. Sitko, J. Szade, J. Klimontko, K. Balin,
J. Lel Atkod, J. Polanski, Nano silica and molybdenum supported Re, Rh, Ru or Ir nanoparticles for selective solvent-free glycerol conversion to cyclic acetals with propanone and butanone under mild conditions, Appl. Catal. B: Environ. 202 (2017) 335–345.
[14] S.B. Umbarkar, T.V. Kotbagi, A.V. Biradar, R. Pasricha, J. Chanale, M.K. Dongare, A.S. Mamede, C. Lancelot, E. Payne, Acetalization of glycerol using mesoporous MoO3/SiO2solid acid catalyst, J. Mol. Catal. A: Chem. 310 (2009) 150–158. [15] J. Deutsch, A. Martin, H. Lieske, Investigations on heterogeneously catalysed
con-densations of glycerol to cyclic acetals, J. Catal. 245 (2007) 428–435.
[16] D.C. Coelho, A.C. Oliveira, J.M. Filho, A.C. Oliveira, A.F. Lucredio, E.M. Elisabete, E. Rodríguez-Castellón, Effect of the active metal on the catalytic activity of the titanate nanotubes for dry reforming of methane, Chem. Eng. J. 290 (2016) 438–453.
[17] Z. Cai, X. Zhao, T. Wang, W. Liu, D. Zhao, Reusable platinum-deposited anatase/ hexa-titanate nanotubes: roles of reduced and oxidized platinum on enhanced solar-light-driven photocatalytic activity, ACS Sustain. Chem. Eng. 5 (2016) 547–555. [18] X. Zhao, Z. Cai, T. Wang, S.E. O’Reilly, W. Liua, D. Zhao, A new type of
cobalt-deposited titanate nanotubes for enhanced photocatalytic degradation of phenan-threne, Appl. Catal. B: Environ. 187 (2016) 134–143.
[19] M. Edake, M. Dalil, M. Jaber, D. Mahboub, J.-L. Dubois, G.S. Patience, Catalytic glycerol hydrogenolysis to 1,3-propanediol in a gas–solidfluidized bed, RSC Adv. 7 (2017) 3853.
[20] R. Camposeco, S. Castillo, I. Meji-Centeno, J. Navarrete, V. Rodriguez-Gonzalez, Behavior of Lewis and Brönsted surface acidity featured by Ag, Au, Ce, La, Fe, Mn, Pd, Pt, V and W decorated on protonated titanate nanotubes, Microp. Mesop. Mater. 236 (2016) 235–243.
[21] F.A. Marchesini, L.B. Gutierrez, C.A. Querini, E.E. Miró, Pt, In and Pd, In catalysts for the hydrogenation of nitrates and nitrites in water. FTIR characterization and reaction studies, Chem. Eng. J. 159 (2010) 203–211.
[22] X. Guo, Y. Li, R. Shi, Q. Liu, E. Zhan, W. Shen, Co/MgO catalysts for hydrogenolysis of glycerol to 1,2-propanediol, Appl. Catal. A: Gen. 371 (2009) 108–113. [23] J. Feng, Y. Zhang, W. Xiong, H. Ding, B. He, Hydrogenolysis of glycerol to
1,2-propanediol and ethylene glycol over Ru-Co/ZrO2catalysts, Catalysts 6 (2016) 51. [24] M.R. Nanda, Z. Yuan, W. Qin, H.S. Ghaziaskar, M.-A. Poirier, C.C. Xu,
Thermodynamic and kinetic studies of a catalytic process to convert glycerol into solketal as an oxygenated fuel additive, Fuel 117 (2014) 470–477.
[25] V.L. Oliveira, C. Morais, K. Servat, T.W. Napporn, G. Tremiliosi-Filho, K.B. Kokoh, Studies of the reaction products resulted from glycerol electrooxidation on Ni-based materials in alkaline medium, Electrochim. Acta 117 (2014) 255–262.
[26] K.N. Papageridis, G. Siakavelas, N.D. Charisiou, D.G. Avraam, L. Tzounis, K. Kousi, M.A. Goula, Comparative study of Ni Co, Cu supported onγ-alumina catalysts for hydrogen production via the glycerol steam reforming reaction, Fuel Process. Technol. 152 (2016) 156–175.
[27] M. Cataldo, E. Nieddu, R. Gavagnin, F. Pinna, G. Strukul, Hydroxy complexes of palladium(II) and platinum(II) as catalysts for the acetalization of aldehydes and ketones, J. Mol. Catal. A: Chem. 142 (1999) 305–316.
[28] P. Sudarsanam, B. Mallesham, A.N. Prasad, P.S. Reddy, B.M. Reddy, Synthesis of bio–additive fuels from acetalization of glycerol with benzaldehyde over mo-lybdenum promoted green solid acid catalysts, Fuel Process. Technol. 106 (2013) 539–545.
[29] S. Chai, H.P. Wang, Y. Liang, B.Q. Xu, Sustainable production of acrolein: gas-phase dehydration of glycerol over Nb2O5catalyst, J. Catal. 250 (2007) 342–349. [30] S. Zhang, Z. Zhao, Y. Ao, Design of highly efficient Zn-, Cu-, Ni- and Co-promoted
M-AlPO4solid acids: the acetalization of glycerol with acetone, Appl. Catal. A: Gen. 496 (2015) 32–39.
[31] Y.L. Pang, S. Lim, H.C. Ong, W.T. Chong, A critical review on the recent progress of synthesizing techniques and fabrication of TiO2-based nanotubes photocatalysts, Appl. Catal. A: Gen. 481 (2014) 127–142.
[32] W. Liu, W. Sun, Y. Han, M. Ahmad, J. Ni, Adsorption of Cu (II) and Cd (II) on titanate nanomaterials synthesized via hydrothermal method under different NaOH concentrations: role of sodium content, Colloids Surf. A: Physicochem. Eng. Asp. 452 (2014) 138–147.
[33] V. Calvino-Casilda, K. Stawick, M. Trejd, M. Ziolek, M.A. Bañares, Real-time Raman monitoring and control of the catalytic acetalization of glycerol with acetone over modified mesoporous cellular foams, J. Phys. Chem. C 118 (2014) 10780–10791. [34] Y. Wang, J.-B. Ma, Q. Zhou, S.-F. Pang, Y.-H. Zhang, Hygroscopicity of mixed
glycerol/Mg(NO3)2/water droplets affected by the interaction between magnesium ions and glycerol molecules, J. Phys. Chem. B 119 (2015) 5558–5566. [35] K. Stawicka, A.E. Díaz-Álvarez, V. Calvino-Casilda, M. Trejda, M.A. Bañares,
[36] S. Lefrant, M. Baibara, I. Baltog, Raman and FTIR spectroscopy as valuable tools for the characterization of polymer and carbon nanotube based composites, J. Mater. Chem. 19 (2009) 5690–5704.
[37] M. Thommes, K. Kaneko, A.V. Neimark, J.P. Oliver, F. Rodriguez-Reinoso, J. Rouquerol, K.S.W. Sing, Pure Appl. Chem. 87 (2015) 1051–1069.
[38] D.V. Bavykin, V.N. Parmon, A.A. Lapkin, F.C. Walsh, The effect of hydrothermal conditions on the mesoporous structure of TiO2nanotubes, J. Mater. Chem. 14 (2004) 3370.
[39] J. Yu, H. Yu, B. Cheng, C. Trapalis, Effects of calcination temperature on the mi-crostructures and photocatalytic activity of titanate nanotubes, J. Mol. Catal. A: Chem. 249 (2006) 135–142.
[40] S.H.M. Suhaimy, S.B.A. Hamid, C.W. Lai, M.R. Hasan, M.R. Johan, TiO2nanotubes supported Cu nanoparticles for improving photocatalytic degradation of simazine under UV illumination, Catalysts 6 (2016) 167.
[41] Z. Wan, Q. Xu, H. Li, Y. Zhang, Y. Ding, J. Wang, Efficient Co@CoO core-shell nanocrystals as catalysts for visible-light-driven water oxidation, Appl. Catal. B:
Environ. 210 (2017) 67–76.
[42] Ş.-B. Ivan, I. Popescu, I. Fechete, F. Garin, V.I. Pârvulescu, I.-Ce. Marcu, The effect of phosphorus on the catalytic performance of nickel oxide in ethane oxidative dehydrogenation, Catal. Sci. Technol. 6 (2016) 6953.
[43] F. Fina, H. Menard, J.T.S. Irvine, The effect of Pt NPs crystallinity and distribution on the photocatalytic activity of Pt-g-C3N4, Phys. Chem. Chem. Phys. 17 (2015) 13929.
[44] Z. Jint, Z. Chen, Q. Li, C. Xi, X. Zheng, On the conditions and mechanism of PtO, formation in the photoinduced conversion of H, PtCl6, Photochem. Photobiol. A: Chem. 81 (1994) 177–182.
[45] C.H. Lin, J.-H. Chao, C.H. Liu, J.-C. Chang, F.-C. Wang, Effect of calcination tem-perature on the structure of a Pt/TiO2 (B) nanofiber and its photocatalytic activity in generating H2, Langmuir 24 (2008) 9907–9915.