DOI: 10.1590/0004-282X20160053
ARTICLE
Predictors of quality of life after moderate to
severe traumatic brain injury
Preditores de qualidade de vida após trauma crânio-encefálico moderado a grave
Karina Tavares Weber1, Viviane Assunção Guimarães1, Octávio M Pontes-Neto1,2, João P. Leite1, Osvaldo
Massaiti Takayanagui1, Taiza E. G. Santos-Pontelli1
Trauma is considered a disease of varied aetiology and cor-responds to the third cause of death worldwide, surpassed only by cardiovascular diseases and neoplasms1. In Brazil, it afects
about one million people per year, 360,000 of them have some impairment or disability, and 120,000 of them don’t survive2.
Among the types of trauma, traumatic brain injury (TBI) stand out as the most important cause of disability among young people and a common cause of neurologic morbid-ity. It represents a serious public health problem with high socio-economic costs related to mortality, morbidity and dis-ability3. TBI is also considered a “silent epidemic” because the
vast majority of long-term disabilities remains underestimated4.
At present, TBI is an important public health problem
world-wide and traic accidents are among the leading causes of dis -ability and premature death. In 2005, the USA had, due to
traf-ic accidents, a mortality rate of 29.7/100,000 inhabitants,
while in European countries, the problem exists to a lesser
ex-tent: Germany presents rate of 10.5/100,000 inhabitants and Netherlands, 8.4/100,000 inhabitants5. According to the World
Health Organization (WHO), in South America countries,
increas-ing annual numbers of traic accidents contribute an alarmincreas-ing
compromise of quality of life (QOL) in those populations5.
However, there are very few epidemiological stud-ies about TBI in developing countrstud-ies6. Especially in Brazil,
1Universidade de São Paulo, Faculdade de Medicina, Departamento de Neurociências e Ciências do Comportamento, Ribeirão Preto SP, Brasil;
2Harvard Medical School, Massachusetts General Hospital, Department of Neurology, Boston MA, United States.
Correspondence: Taiza E. G. Santos-Pontelli; Departamento de Neurociências e Ciências do Comportamento, Faculdade de Medicina de Ribeirão Preto, Universidade de São Paulo; Av. dos Bandeirantes, 3900; 14049-900 Ribeirão Preto SP, Brasil. E-mail: [email protected]
Conflict of interest: There is no conlict of interest to declare.
Support: This work was supported by funds from the Coordenaçao de Aperfeiçoamento de Pessoal de Nível Superior - Brazil. Received 2 September 2015; Received in inal form 14 December 2015; Accepted 15 March 2016.
ABSTRACT
Objective: To verify correlations between age, injury severity, length of stay (LOS), cognition, functional capacity and quality of life (QOL) six months after hospital discharge (HD) of victims of traumatic brain injury (TBI). Method: 50 patients consecutively treated in a Brazilian emergency hospital were assessed at admission, HD and six months after HD. The assessment protocol consisted in Abbreviated Injury Scale, Injury Severity Score, Glasgow Coma Scale (GCS), Revised Trauma Score (RTS), Mini Mental Test, Barthel Index and World Health Organization QOL - Brief. Results: Strong negative correlation was observed between LOS and GCS and LOS and RTS. An almost maximal correlation was found between RTS and GCS and functional capacity and GCS at HD. Age and LOS were considered independent predictors of QOL. Conclusion: Age and LOS are independent predictors of QOL after moderate to severe TBI.
Keywords: brain injuries, epidemiology; quality of life.
RESUMO
Objetivo: Veriicar correlações entre idade, gravidade do trauma, tempo de hospitalização (TH), cognição, capacidade funcional e qualidade de vida (QV) seis meses após alta hospitalar (AH) de vítimas de trauma crânio-encefálico (TCE). Método: 50 pacientes tratados em um hospital de emergência brasileiro foram avaliados na admissão, AH e seis meses após AH. O protocolo de avaliação consistia em Escala Abreviada de Lesões, Índice de Gravidade de Lesão, Escala de Coma de Glasgow (ECG), Escore de Trauma Revisado (RTS), teste Mini-Mental, Índice de Barthel e Questionário Breve de QV da Organização Mundial de Saúde. Resultados: Forte correlação negativa foi observada entre TH e ECG e TH e RTS. Correlação quase máxima foi observada entre RTS e ECG e capacidade funcional e ECG na AH. Idade e TH foram considerados preditores independentes de QV. Conclusão: Idade e TH são preditores independentes de QV após TCE moderado e grave.
the few studies available have focused on hospital mortality
and use of hospital resources. here are very few data about
the dysfunction and impact of QOL after a TBI in Brazil7.
Only a few small studies in Brazil have applied instruments to assess QOL in the population with TBI8, making it dii
-cult to evaluate which aspects may inluence the outcomes
of those patients. Moreover, as pointed out by some authors, patient-centred outcome research may increase our ability to translate that information into public policies for prevention, treatment and rehabilitation for TBI9.
his study was designed to evaluate patients after TBI ad -mitted to a public tertiary trauma centre in Brazil and to iden-tify predictors of functional capacity and QOL six months af-ter their hospital discharge.
METHOD
he Ethics Committee of Clinics Hospital – Faculdade de Medicina de Ribeirão Preto – Universidade de São Paulo ap -proved this study. Written informed consent forms were ob-tained from all patients or legally authorized representative.
his is a longitudinal and descriptive study conducted at
the emergency unit of a public university hospital, which is a tertiary referral centre for the care of TBI at Ribeirão Preto and its metropolitan area.
We evaluated 50 survivals of moderate to severe TBI, aged over 18 years who were consecutively discharged from the neurology ward of a tertiary emergency and agreed to
par-ticipate in the study. he exclusion criteria were terminal ill -ness with life expectancy less than one year determined by the medical provider; previous neurological disease with
sig-niicant functional impairment and prognostic impact and cognitive inability to ill out the questionnaire administered.
Clinical evaluation was performed in three distinct stag -es: admission, hospital discharge and six months after
hos-pital discharge. he data from admission were collected ret
-rospectively from the hospital-based registry. he data from
hospital discharge and six months after the hospital dis-charge were collected prospectively.
At admission, anatomical and physiological trau-ma scores were used to assess the severity of the injury and to define the extent of injury2,10. The physiological
scores used were Glasgow Coma Scale (GCS) and Revised
Trauma Score (RTS). The anatomical score used was the Injury Severity Score (ISS).
Upon hospital discharge, demographic data, the GCS, Mini
Mental Test and Barthel Index were assessed. After six months of hospital discharge, a single home visit was performed to
evaluate GCS, Mini Mental Test, Barthel Index and QOL. he QOL of patients with TBI was evaluated by World Health Organization Quality Of Life – brief (WHOQOL-brief),
an instrument recognized worldwide that is easy to use and understand, available and validated in Brazil11.
It was emphasized that the questionnaire refers to the con-ditions of life in the last two weeks, regardless of where the
indi-vidual was living. he interviewer didn’t inluence the patient’s
response nor discussed the issues or answers. If there were any
questions while illing out the questionnaire administered,
the interviewer read back the questions, avoiding synonymous to prevent interference with the response of the patient.
he reliability of the factors was determined by assessing the internal consistency of each one by the Cronbach’s alpha tech -nique. A factor was considered accurate if the minimum index of internal consistency was equal to or greater than 0.8012. Data and statistical analysis
he data were analysed using Statistical Package for the Social Sciences (SPSS) version 20.0 for Mac. he calculations of the
WHOQOL-brief questionnaire were performed according to the
oicial site: http://www.ufrgs.br/psiquiatria/psiq/whoqol4.html. Categorical variables are described using absolute and relative frequency, and the Chi-square test was used to verify potential associations among the variables. Comparisons be -tween the results of three or more related samples (average
posts) were made using a Friedman ANOVA test (paired sam
-ples). he Wilcoxon test was used if there were no signiicant diferences between the means. his test also assessed wheth
-er th-ere w-ere signiicant dif-erences between mean positions
for two groups while comparisons between mean positions for more than two groups were made using the Kruskal-Wallis test.
he Spearman correlation coeicient was used to examine as
-sociations between variables. he Cohen’s (1988) conventions were used to interpret efect size. A correlation coeicient of
0.10 was considered a weak or small association; a correlation
coeicient of 0.30 was considered a moderate correlation, and a correlation coeicient of 0.50 or larger was considered a high
correlation. When appropriately related to relevant
hypothe-ses of the present study, the variables with statistically signii -cant correlation were included in linear regression analysis.
he level of signiicance was set at 5% (p < 0.05).
RESULTS
50 patients discharged from the neurological ward with moderate to severe TBI in the study period were included.
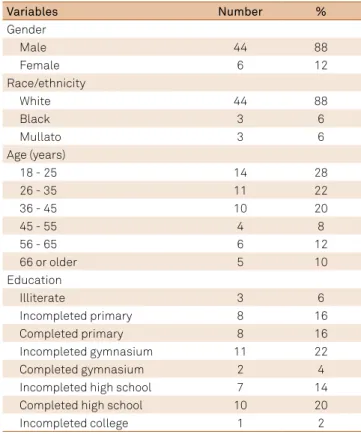
hey were in agreement with our inclusion/exclusion crite -ria. Table 1 describes the demographic and socioeconomic data of the patients.
Table 2 shows the general causes of TBI and according to age groups. Most motor vehicle accidents and cases of inter-personal violence in this study composed by victims of
physi-cal abuse (beatings) and injury by irearms occurred in young -er age groups, while falls w-ere the most common among the
Regarding the injured body area, it was observed that
100% of the victims showed nonspeciic lesions beyond the
TBI as abrasions, contusions and generalized lacerations that can’t be considered a single piece body.
Concerning primary lesions arising TBI, there were ob
-served skull fractures (22%), contusions (48%), difuse axonal injury (26%), intraparenchymal hematoma (4%), subdural hematoma (30%), extradural hematoma (16%) and other mi
-nor injuries (12%) while in secondary lesions there was ob
-served the brain swelling (38%). Haemorrhage was found in 24% of the victims being the intraparenchymal the most fre -quent followed by the arachnoid.
he length of hospitalization ranged from 02 to 133 days (median = 18.5 days), 50% of patients required admission to the intensive care unit (ICU) (mean = 15.84 SD 9.78 days) and 60% required mechanical ventilation (MV) (mean = 7.7 SD 4.74 days). In accidents involving private cars and motorcy
-cles, the use of MV was required in 84% of cases, and 72% of these were admitted to the ICU. Of the patients undergo
-ing MV, 16 (64%) underwent tracheotomy procedure and of these, 11 (68.75%) were discharged with tracheotomy.
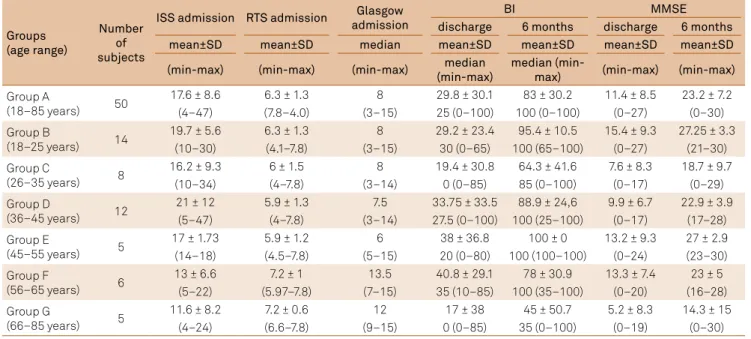
According ISS, the most frequent injury classiication was moderate (48%), followed by mild trauma (38%) and severe trauma (14%). he variation in scoring ISS was 5 to 35, and the mean value of 17.60 ± 8.62. Table 3 shows the results of
the anatomical and functional scales according to age groups
(group A: 18–85 years old; group B: 18–25 years old; group Table 1. The distribution of victims according to demographic and education data.
Variables Number %
Gender
Male 44 88
Female 6 12
Race/ethnicity
White 44 88
Black 3 6
Mullato 3 6
Age (years)
18 - 25 14 28
26 - 35 11 22
36 - 45 10 20
45 - 55 4 8
56 - 65 6 12
66 or older 5 10
Education
Illiterate 3 6
Incompleted primary 8 16
Completed primary 8 16
Incompleted gymnasium 11 22
Completed gymnasium 2 4
Incompleted high school 7 14
Completed high school 10 20
Incompleted college 1 2
Table 2. The distribution of victims according to demographic and etiological data.
Variables number %
Causes of TBI
Automobile 16 32
Fall 12 24
Bike 6 12
Running over 6 12
Motorcycling 3 6
Physical aggression 6 12
Firearm 1 2
Causes of TBI according to age group
15 – 25 years old
Trafic accidents of motor vehicles 10 20
Aggressions 1 2
Accidental falls 2 4
Homicide and injuries caused intentionally
by others 1 2
26 – 35 years old
Trafic accidents of motor vehicles 9 18
Aggressions 2 4
Accidental falls 0 0
Homicide and injuries caused intentionally
by others 0 0
36 – 45 years old
Trafic accidents of motor vehicles 5 10
Aggressions 2 4
Accidental falls 3 6
Homicide and injuries caused intentionally
by others 0 0
46 – 55 years old
Trafic accidents of motor vehicles 3 6
Aggressions 1 2
Accidental falls 0 0
Homicide and injuries caused intentionally
by others 0 0
56 – 65 years old
Trafic accidents of motor vehicles 2 4
Aggressions 3 6
Accidental falls 0 0
Homicide and injuries caused intentionally
by others 0 0
66 – 85 years old
Trafic accidents of motor vehicles 2 4
Aggressions 0 0
Accidental falls 4 8
Homicide and injuries caused intentionally
by others 0 0
Other lesions
Head 50 100
Face 15 30
Neck 1 2
Chest 11 22
Column 4 8
Abdomen 7 14
Upper limbs 14 28
Lower limbs 10 20
Pelvis 1 2
C: 26–35 years old; group D: 36–45 years old; group E: 45–55 years old; group F: 56–65 years old; group G: 66–85 years old). At admission, 52% of the victims had a GCS score ≤ 8 (se
-vere TBI), whereas 80.8% of these were admitted to the ICU, while mild trauma accounted for 36% of the patients studied.
In each case, the most common mechanism of injury was the
motor vehicle accidents (40%) and falls (18%), respectively.
Strong negative correlation was observed between
length of stay (LOS) in hospital and GCS (Spearman corre
-lation, p < 0.001, r = -0.709). he causal relationship between
these variables was conirmed by linear regression analysis (p < 0.001, r2 = 0.32) (Figure 1).
he mean RTS in the study population was 6.33 ± 1.30 (Min = 4.09; Max = 7.84). here was a strong negative cor
-relation with statistical signiicance between LOS and RTS (Spearman correlation, p < 0.001, r = -0.701). A linear re
-gression analysis conirmed the causal relationship and it is shown in Figure 2 (Linear Regression, p < .001, r2 = 0.28).
A linear regression analysis shown in Figures 1 and 2 demon
-strates that the one-point increase in GCS promotes, on average,
Table 3. Results of the anatomical and functional scales according to age groups.
Groups (age range)
Number of subjects
ISS admission RTS admission Glasgow admission
BI MMSE
discharge 6 months discharge 6 months
mean±SD mean±SD median mean±SD mean±SD mean±SD mean±SD
(min-max) (min-max) (min-max) median (min-max)
median
(min-max) (min-max) (min-max)
Group A
(18–85 years) 50
17.6 ± 8.6 6.3 ± 1.3 8 29.8 ± 30.1 83 ± 30.2 11.4 ± 8.5 23.2 ± 7.2
(4–47) (7.8–4.0) (3–15) 25 (0–100) 100 (0–100) (0–27) (0–30)
Group B
(18–25 years) 14
19.7 ± 5.6 6.3 ± 1.3 8 29.2 ± 23.4 95.4 ± 10.5 15.4 ± 9.3 27.25 ± 3.3
(10–30) (4.1–7.8) (3–15) 30 (0–65) 100 (65–100) (0–27) (21–30)
Group C
(26–35 years) 8
16.2 ± 9.3 6 ± 1.5 8 19.4 ± 30.8 64.3 ± 41.6 7.6 ± 8.3 18.7 ± 9.7
(10–34) (4–7.8) (3–14) 0 (0–85) 85 (0–100) (0–17) (0–29)
Group D
(36–45 years) 12
21 ± 12 5.9 ± 1.3 7.5 33.75 ± 33.5 88.9 ± 24,6 9.9 ± 6.7 22.9 ± 3.9
(5–47) (4–7.8) (3–14) 27.5 (0–100) 100 (25–100) (0–17) (17–28)
Group E
(45–55 years) 5
17 ± 1.73 5.9 ± 1.2 6 38 ± 36.8 100 ± 0 13.2 ± 9.3 27 ± 2.9
(14–18) (4.5–7.8) (5–15) 20 (0–80) 100 (100–100) (0–24) (23–30)
Group F
(56–65 years) 6
13 ± 6.6 7.2 ± 1 13.5 40.8 ± 29.1 78 ± 30.9 13.3 ± 7.4 23 ± 5
(5–22) (5.97–7.8) (7–15) 35 (10–85) 100 (35–100) (0–20) (16–28)
Group G
(66–85 years) 5
11.6 ± 8.2 7.2 ± 0.6 12 17 ± 38 45 ± 50.7 5.2 ± 8.3 14.3 ± 15
(4–24) (6.6–7.8) (9–15) 0 (0–85) 35 (0–100) (0–19) (0–30)
MMSE: Mini mental state examination; RTS: Revised trauma score; BI: Barthel index; GCS: Glasgow coma scale; SD: Standard deviation; Min: Minimum; Max: Maximum.
Figure 1. Linear regression analysis between the time of hospitalization and the Glasgow Coma Scale.
120
100
80
60
40
20
0
8 9 10 11 12 13 14 15
Glasgow Coma Scale
Time of hospitalization (days)
Figure 2. Linear regression analysis between the time of hospitalization and the Revised Trauma Score.
120
100
80
60
40
20
0
4 5 6 7
Revised Trauma Score
Time of hospitalization (days)
a decrease of 4.11 days in LOS, whereas the decrease of one point in RTS promotes an increase of 11.86 days in LOS.
A correlation was observed almost maximal with strong
statistical signiicance (p < 0.001, r = -0.969) in the analysis of Spearman correlation between the RTS and GCS variables.
As expected, there was a signiicant improvement in the activities of daily living function (ADL) observed by Barthel
Index scores after six months of hospital discharge compared
with the hospital discharge scores (mean = 29.8 SD 30.1 and mean = 83.3 SD 30.2, respectively; Wilcoxon Signed Ranks Test, p < 0.001). It was also observed strong statistically sig
-niicant correlation between functional capacity and GCS at hospital discharge (Spearman correlation, p < 0.001 r = 0.542), as well as a moderate correlation of the ADL function at hos
-pital discharge with both GCS and RTS (Spearman correla
-tion, GCS: p = 0.005, r = 0.45; RTS: p = 0.01, r =0.41).
QOL was assessed after six months of hospital
dis-charge in 37 patients. Among the 13 excluded patients, five
died, five were not found for an address change, and three showed no level of consciousness to participate in the
in-terview (GCS <8).
he reliability of the four domains and facets was veriied through analysis of internal consistency (Cronbach’s alpha
technique) and revealed that in all groups presented with a good level of internal consistency (higher than 0.8).
here was a moderate correlation between the cognitive
state (Mini Mental test scores) with the physical and envi-ronmental domains of the WHOQOL-brief (physical domain:
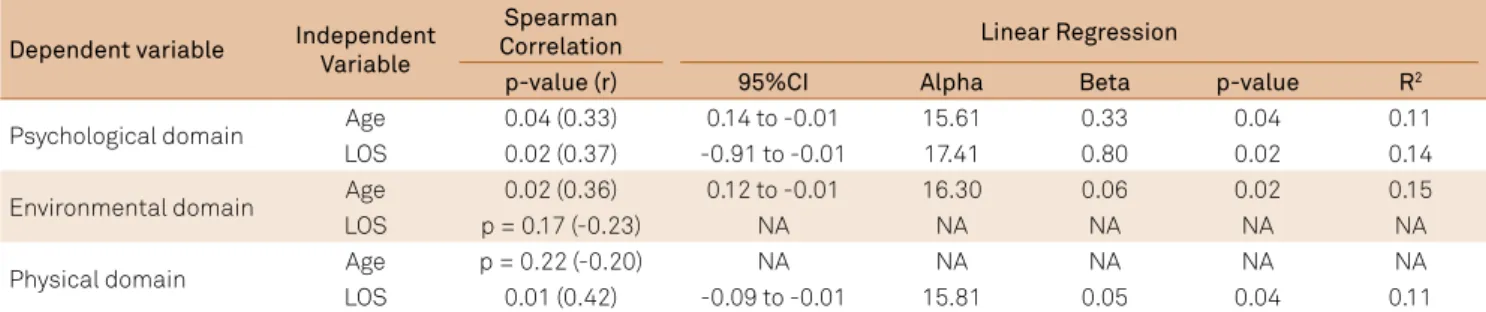
p = 0.03, r = 0.35; environmental domain p = 0.02, r = 0.37). Table 4 shows the analyses of Spearman Correlation and
Linear Regression of the WHOQOL-brief domains with age
and length of stay. here was a moderate negative correla -tion of the psychological and environmental domains of the WHOQOL-brief with age (psychological domain: p = 0.04, r = -0.33; environmental domain: p = 0.02, r = -0.36), and the psychological and physical domains of the WHOQOL-brief
with the LOS (psychological domain: p = 0.02, r = -0.37; physi
-cal domain: p = 0.01, r = -0.42). Further regression analysis
suggested a causal relationship between those variables: psychological domain (age: r2 = 0.11, p = 0.04; LOS: r2 = 0.14, p = 0.02), physical domain (LOS: r2 = 0.11, p = 0.04) and envi-ronmental domain (age: r2 = 0.15, p = 0.02).
DISCUSSION
he relevance of this research is that it provides several ep -idemiological data and represents, to the best of our
knowl-edge, the latest research on QOL with a signiicant sample size
of patients with TBI after six months from hospital discharge developed in a Brazilian institution. Recently, in northern of Brazil, QOL was evaluated six months after the TBI event, but the aim of this study was mainly descriptive13. Also, other
stud-ies assessed aspects of quality of care and QOL after discharge of overall patients with trauma1,7. A further relevance of the
present study relies on the analysis of the predictor factors of QOL in this population and on the helpful discussion for de-signing future studies on QOL after TBI.
In this study, it was found that the characteristics of the victims are related to the mechanisms of trauma, in which young adults engage more frequently in high-speed motor ve-hicle accidents, while the elderly, in falls, which corroborates the literature14,15. Also, the physiological condition on RTS
was similar to data from another study that found a score greater than six16. hese higher scores, i.e. less severe lesions,
can be explained by prevention campaigns of the competent bodies as mandatory use of safety equipment and guidelines regarding the risk of accidents caused by the combination of direction and alcohol consumption. However, these data should be weighted, because the determination of
respira-tory rate, one of the components of the RTS, is inluenced
by patients’ age, mechanism of injury, and mechanical ven-tilation9. Moreover, we observed that the worst RTS’ scores
(values between three and four) were associated with motor vehicle accidents and the best (values above seven) with falls.
he severity of TBI analysed by both the GCS and the RTS
was found as predictive factors for LOS. Although some
stud-ies don’t consider the values of GCS and RTS as valid pre -dictors of LOS17, most of the previous studies have observed that the GCS is a useful tool in prediction models of TBI out -comes18,19. More recently, it was demonstrated that the mo-tor component of the GCS together with pupillary reactiv -ity provide a simple and feasible score to stratify the sever-ity
of patients with TBI, contributing to the early deinition of
prognosis and most appropriate intervention for neuropro-tection20. Also, it was noted that the RTS has been assessed as
Table 4. Results of the correlation and linear regression analyses between the domains of WHOQOL-brief with age and length of stay.
CI: conidence interval; LOS: length of stay; NA: not analyzed.
Dependent variable Independent Variable
Spearman
Correlation Linear Regression
p-value (r) 95%CI Alpha Beta p-value R2
Psychological domain Age 0.04 (0.33) 0.14 to -0.01 15.61 0.33 0.04 0.11
LOS 0.02 (0.37) -0.91 to -0.01 17.41 0.80 0.02 0.14
Environmental domain Age 0.02 (0.36) 0.12 to -0.01 16.30 0.06 0.02 0.15
LOS p = 0.17 (-0.23) NA NA NA NA NA
Physical domain Age p = 0.22 (-0.20) NA NA NA NA NA
a useful scale to predict mortality, trauma severity and LOS in patients with polytrauma21. hus, the results of these assess
-ments can directly determine the LOS.
Nowadays, many tools have been created with the aim of assessing the physical, mental and social-related QOL, and to evaluate the impact of a disease on this22. Within this
re-ality, we decided to use the WHOQOL-brief because it is a free access instrument, available in twenty languages and have good psychometric qualities. More recently, a multidis-ciplinary expert group on TBI recommended the WHOQOL as a good patient-centred outcome measure for this popula-tion23. Most recently, a systematic review of studies on QOL
after TBI reported that WHOQOL-brief showed positive re-sults, but further evidence is limited24.
Relevant indings of the present study were that age and LOS are predictors of perceived QOL. he relationship
observed that the higher the age, the better the QOL per-ceived by the patient corroborates with other studies that emphasized the impact of normative perceptions while ag-ing on health25. According to these authors, older adults with
TBI may consider the changes in their health or their symp-toms as consequences of the aging process, rather than be-ing caused by their TBI. In contrast, younger adults have a satisfactory health and when compare themselves with their healthy and age-matched peers may be more capable of per-ceiving changes in their health.
he relationship observed that the higher the LOS, the
worse the QOL can be explained by the fact that the LOS
re-lects the injury severity efects that are not well tapped by GCS
or RTS, i.e., the LOS may be the result of several severity-related
factors and, thus, directly inluence the QOL. he LOS can
also be an indicator of the seriousness of other comorbidities
and/or concomitant injuries that afects the QOL negatively
after the hospital discharge in patients with TBI26.
In the present study, the functional capacity wasn’t cor-related with QOL, which is contradictory to the results found previously27. It is likely that this diference may have occurred
due to the restricted sample studied and may indicate the
need to use more sensitive instruments such as Functional Independence Measure (FIM), the Glasgow Outcome Scale Extended (GOSE), and the Disability Rating Scale (DRS) 23,28,29,30.
Limitations of this study must be borne in mind when in-terpreting these results and for designing future studies on QOL after TBI. Although the population with TBI admitted to our tertiary emergency hospital during the study period was large, analyses were limited to inpatients only from the
neurology ward and capable of illing out the questionnaire
administered six months after the hospital discharge, which
restricted the sample size. hus, our results may not apply to more cognitively impaired participants. Furthermore, the results found in our sample relect the characteristics of the population admitted to the neurology ward. herefore, ind -ings may not generalize to those with mild TBI who do not receive inpatient care in the neurology ward, or to those with very severe TBI who are treated in long-term nursing
facili-ties. Further investigation with a larger sample size and path
analysis modelling is required. Besides, the use of sample with a homogeneous severity of TBI will provide better con-ditions to evaluate the impact of the traumatic event on QOL.
he present study represents a pioneering analysis of the QOL of patients who have sufered TBI in Ribeirao Preto and
its administrative area, and shows the importance of trying to optimize assistance to the population victim of trauma not only in order to improve QOL, but also to reduce hospital
costs. Consequently, our results and interpretations add one more factor in judging the cost-efectiveness of therapeutic
strategies, and will contribute to future studies conducted at tertiary emergency units.
References
1. Costa CDS, Scarpelini S. Avaliação da qualidade do atendimento ao traumatizado através do estudo das mortes em um hospital terciário. Rev Col Bras Cir. 2012;39(4):249-54. doi:10.1590/S0100-69912012000400002 2. Carvalho AO, Bez Júnior A. Caracterização das vítimas de trauma
assistidas por um serviço de atendimento pré-hospitalar. Einstein. 2004;2(3):199-205.
3. Shivaji T, Lee A, Dougall N, McMillan T, Stark C. The epidemiology of hospital treated traumatic brain injury in Scotland. BMC Neurology. 2014;14(1):2. doi:10.1186/1471-2377-14-2
4. McIntyre A, Mehta S, Aubut J, Dijkers M, Teasell RW. Mortality among older adults after a traumatic brain injury: a meta-analysis. Brain Inj. 2013;27(1):31-40. doi:10.3109/02699052.2012.700086 5. Rocha GS, Schor N. Acidentes de motocicleta no município de
Rio Branco: caracterização e tendências. Ciênc Saúde Coletiva. 2013;18(3):721-31. doi:10.1590/S1413-81232013000300018 6. Melo JR, Silva RA, Moreira Júnior ED. Características dos
pacientes com trauma cranioencefálico na cidade de Salvador, Bahia, Brasil. Arq Neuropsiquiatr. 2004;62(3A):711-4. doi:10.1590/S0004-282X2004000400027
7. Alves ALA, Salim FM, Martinez EZ, Passos ADC, De Carlo MMRP, Scarpelini S. Qualidade de vida de vítimas de trauma seis meses após a alta hospitalar. Rev Saúde Publ. 2009;43(1):154-60. doi:10.1590/S0034-89102009000100020
8. Silva SCF, Settervall CHC, Sousa RMC. Amnésia pós-traumática e qualidade de vida pós-trauma. Rev Esc Enferm USP. 2012;46(Esp):30-7. doi:10.1590/S0080-62342012000700005 9. Gabriel SE, Normand SLT. Getting the methods right: the foundation
of patient-centered outcomes research. New Engl J Med. 2012;367(9):787-90. doi:10.1056/NEJMp1207437
10. Kondo Y, Abe T, Kohshi K, Tokuda Y, Cook EF, Kukita I. Revised trauma scoring system to predict in-hospital mortality in the emergency department: Glasgow Coma Scale, age, and systolic blood pressure score. Crit Care. 2011;15(4):R191. doi:10.1186/cc10348
11. Fleck MPA, Louzada S, Xavier M et al. Aplicação da versão em português do instrumento WHOQOL-bref. Rev Saúde Pública. 2000;34(2):178-83. doi:10.1590/S0034-89102000000200012 12. Fukuda CC, Pasquali L. Professor eicaz: um instrumento de aferição.
13. Vieira RCA, Hora EC, Oliveira DV, Ribeiro MCO, Sousa RMC. Quality of life of victims of traumatic brain injury six months after the trauma. Rev Lat Am Enferm. 2013;21(4):868-75. doi:10.1590/S0104-11692013000400006
14. Utomo WK, Gabbe BJ, Simpson PM, Cameron, PA. Predictors of in-hospital mortality and 6-month functional outcomes in older adults after moderate to severe traumatic brain injury. Injury. 2009;40(9):973-7. doi:10.1016/j.injury.2009.05.034
15. Cartaxo CKA, Nunes MS, Raposo OFF, Fakhouri R, Hora EC. Fall-related traumas in urgent care centers. Clinics. 2012;67(10):1133-8. doi:10.6061/clinics/2012(10)03
16. Batista SEA, Baccani JG, Silva RAP, Gualda KPF, Vianna RJA. Análise entre os mecanismos de trauma, as lesões e o peril de gravidade das vítimas em Catanduva-SP. Rev Col Bras Cir. 2006;33(1):6-10. doi:10.1590/S0100-69912006000100003
17. Shah S, Muncer S. A comparison of rehabilitation outcome measures for traumatic brain injury. OTJR (Thorofare N J). 2003;23(1):2-9. doi:10.1177/153944920302300101
18. McNett M. A review of the predictive ability of Glasgow Coma Scale scores in head-injured patients. J Neurosci Nurs. 2007;39(2):68-75. doi:10.1097/01376517-200704000-00002
19. Duncan R, Thakore S. Decreased Glasgow coma scale score does not mandate endotracheal intubation in the emergency department. J Emerg Med. 2009;37(4):451-5. doi:10.1016/j.jemermed.2008.11.026 20. Hoffmann M, Lefering R, Rueger JM, Kolb JP, Izbicki JR, Ruecker AH
et al. Trauma Registry of the German Society for Trauma Surgery: pupil evaluation in addition to Glasgow coma scale components in prediction of traumatic brain injury and mortality. Braz J Surg. 2012;99(S1):122-30. doi:10.1002/bjs.7707
21. Sloan EP, Koenigsberg M, Clark JM, Desai A. The use of the Revised Trauma Score as an entry criterion in traumatic hemorrhagic shock studies: Data from the DCLHb Clinical Trials. Prehospital Disaster Med. 2012;27(4):330-44. doi:10.1017/S1049023X12000970 22. Diaz AP, Schwarzbold ML, Thais ME, Hohl A, Bertotti MM, Schmoeller
R et al. Psychiatric disorders and health-related quality of life after
severe traumatic brain injury: a prospective study. J Neurotrauma. 2012;29(6):1029-37. doi:10.1089/neu.2011.2089
23. Ardolino A, Sleat G, Willett K. Outcome measurements in major trauma – Results of a consensus meeting. Injury. 2012;43(10):1662-6. doi:10.1016/j.injury.2012.05.008 24. Polinder S, Haagsma JA, Klaveren D, Steyerberg EW, Beeck EF.
Health-related quality of life after TBI: a systematic review of study design, instruments, measurement properties, and outcome. Popul Health Metr. 2015;13(1):4. doi:10.1186/s12963-015-0037-1 25. Breed ST, Flanagan SR, Watson KR. The relationship between age
and the self-report of health symptoms in persons with traumatic brain injury. Arch Phys Med Rehabil. 2004;85 Suppl 2:S61-7. doi:10.1016/j.apmr.2003.08.115
26. Cuthbert JP, Corrigan JD, Harrison-Felix C, Coronado V, Dijkers MP, Heinemann AW. Factors that predict acute hospitalization discharge disposition for adults with moderate to severe traumatic brain injury. Arch Phys Med Rehabil. 2011;92(5):721-30. doi:10.1016/j.apmr.2010.12.023
27. Scholten AC, Haagsma JA, Andriessen TM, Vos PE, Steyerberg EW, Beeck EF, Polinder S. Health-related quality of life after mild, moderate and severe traumatic brain injury: patterns and predictors of suboptimal functioning during the irst year after injury. Injury. 2015;46(4):616-24. doi:10.1016/j.injury.2014.10.064
28. Pretz CR, Dams-O’Connor K. Longitudinal description of the GOS-E for individuals in the traumatic brain injury model systems national database: a national institute on disability and rehabilitation research traumatic brain injury model systems study. Arch Phys Med Rehabil. 2013;94(12):2486-93. doi:10.1016/j.apmr.2013.06.02 29. Pretz CR, Malec JF, Hammond FM. Longitudinal description of
the Disability Rating Scale for individuals in the national institute on disability and rehabilitation research traumatic brain injury model systems national database. Arch Phys Med Rehabil. 2013;94(12):2478-85. doi:10.1016/j.apmr.2013.06.019 30. Shukla D, Devi BI, Agrawal A. Outcome measures for traumatic