Espessura retiniana medida pela tomografia de coerência óptica (OCT)
no edema macular do pseudofácico
Hospital das Clínicas, Department of Ophthalmology Universidade de São Paulo - São Paulo (SP) - Brasil. 1Doctor in Ophthalmology, Retina Service. Hospital
das Clínicas, Department of Ophthalmology Universi-dade de São Paulo - USP - São Paulo (SP) - Brasil. 2Doctor in Ophthalmology, Retina Service. Hospital
das Clínicas, Department of Ophthalmology USP - São Paulo (SP) - Brasil.
3Doctor in Ophthalmology, Retina Service. Hospital das Clínicas, Department of Ophthalmology USP - São Paulo (SP) - Brasil.
4Doctor in Ophthalmology, Retina Service. Hospital das Clínicas, Department of Ophthalmology USP - São Paulo (SP) - Brasil.
5Doctor in Ophthalmology, Retina Service. Hospital das Clínicas, Department of Ophthalmology USP - São Paulo (SP) - Brasil.
6Doctor in Ophthalmology, Retina Service. Hospital das Clínicas, Department of Ophthalmology USP - São Paulo (SP) - Brasil.
7Doctor in Ophthalmology, Retina Service. Hospital das Clínicas, Department of Ophthalmology USP - São Paulo (SP) - Brasil.
Address for correspondence: Maria Teresa Bonanomi. Rua José Bonifácio, 87 - Jacareí (SP) CEP 12327-190 E-mail: [email protected]
Recebido para publicação em 18.09.2005 Versão revisada recebida em 25.04.2006 Aprovação em 28.04.2006
Research sources: Pub Med, SciElo and LILACS. Maria Teresa Brizzi Chizzoti Bonanomi1 André Gustavo Bombana Nicoletti2 Pedro Carlos Carricondo3
Flávio Buzalaf4 Newton Kara-José Jr.5 André Marcelo Vieira Gomes6 Yoshitaka Nakashima7
Keywords: Cataract; Macular edema, cystoid/diagnosis; Fluorescein angiography; Tomo-graphy, optical coherence; Retina/pathology
INTRODUCTION
Cataract is the main cause of blindness among the adult population(1). It is
estimated that, in India alone, 3.8 million people become blind from cataract every year(2). The rate of cataract surgery has been reported to increase from
1.2 to 7.2 in 1,000 inhabitants per year, in a period of eight years. This is explained not only by the population lifespan but is mainly due to earlier surgical procedures(3). Macular edema in pseudophakic eyes continues to
cause disappointing visual results in uneventful surgeries, despite the de-crease in complication rate associated with the current surgical techniques.
tomography (OCT) in pseudophakic macular edema
Purpose: To evaluate the usefulness of the optical coherence tomography (OCT) retinal map in angiographic pseudophakic macular edema (ACME).
Methods:This is a prospective analysis of a group of 36 pseudophakic eyes at the fifth postoperative week, submitted to optical coherence tomography 2 macular map and fluorescein angiography on the same day and, a control group of twenty-two 20/20 vision eyes with a minimum 6-month postoperative period, submitted to optical coherence tomography 2 macular map only.Exclusion criteria were diabetes, any macular patho-logy and unreadable optical coherence tomography or angiogram. The angiograms were divided into three groups according to the edema intensity: Group I: level 0 (absence of angiographic pseudophakic macular edema); group II: levels 1 and 2 (incomplete and complete perifoveal angiographic pseudophakic macular edema respectively) and group III: levels 3 and 4 (up to one disc diameter and greater than one disc diameter angiographic pseudophakic macular edema area respectively). The nine zones of the optical coherence tomography macular map were compared between the control and the three subgroups of the study group and, between group I and groups II and III. Results: Among the 36 eyes, 23 (64%) were classified as group I, 10 (28%) as group II and three (8%) as group III. The mean thickness of the fovea zone was 185±15 µm for the control group, 189±24 µm for group I, 213±33 µm for group II and 455±38 µm for group III. Significant differences: between group III and the control or group I for all zones (p<0.01) and, between group II and control or group I for the fovea and temporal inner zones (p<0.05).
Conclusion: The optical coherence tomography retinal map is useful in angiographic pseudophakic macular edema diagnosis.
The angiographic macular edema (ACME), detected by the fifth post-operative week is reported in 24%(4) of eyes with posterior
chamber lens implants and, as many as 50% using several cataract extraction techniques(5). Routinely, macular edema has
been diagnosed by slit lamp biomicroscopy and fluorescein angiography(4-6). Biomicroscopy of the macula is a difficult,
subjective and often an inconclusive examination of recently operated eyes due to photophobia and light diffraction in the eye or in the intraocular lens. Fluorescein angiography is an invasive test and may not be conclusive in 15% of cases in the cataract postoperative follow-up(6).
Optical coherence tomography (OCT) is an interferometric method, which provides optical cross-sectional images of the eye(7). The macular map program (Humphrey Instruments, Inc.
San Leandro California) analyzes six, 6mm scans radiated through the fovea and provides an average retinal thickness map in nine regions of the macula. OCT has been used to study macular thickness in diabetes(8-10), uveitis(11) and after
cataract surgeries(12-15). Macular thickening as measured by
the OCT mapping software has recently been shown to corre-late with visual loss in pseudophakia(15). The purpose of this
study is to assess the macular thickness by the OCT retinal map software at the various ACME levels.
METHODS
This is a prospective cross-sectional trial, conducted among a study group of 50 pseudophakic eyes in 48 patients and a control group of 30 eyes of 25 patients. In the study group, surgery was performed by a second- or a third-year medical resident on all patients and the three-piece polyme-thylmethacrylate (PMMA) lens with 6-mm optic zone intra-ocular lenses (LIO) were implanted. All eyes were submitted to the OCT 2 retinal map using the internal fixation target bet-ween the 4th and the 6th postoperative week. Patients who were
unable to see the fixation target were not included. Those patients with reliable OCT maps and at least five meridians without imperfections, were submitted to fluorescein angio-graphy on the same day. Fourteen eyes of fourteen patients showed substandard angiograms and were excluded. The control group comprised thirty 20/20 vision pseudophakic eyes of 25 patients, who received the same lens as the study group, and had a minimum postoperative period of six months. The eyes in the control group were presumed to have a normal macula and were submitted to the OCT 2 macular map only. In this group, eight eyes of seven patients were excluded due to the poor OCT quality. In both groups, a posterior pole biomi-croscopy was performed to rule out signs of macular patholo-gy like blood, anomalous pigmentation or drusen. The exclu-sion criteria were: diabetes, any eye disease and unreadable OCT or angiogram. The final participants were: 36 eyes of 34 patients (study group) and 22 eyes of 18 patients (control group). The angiograms were classified and divided into three groups by reading one of the latest pictures of the examination
(roughly 5 to 10 minutes) . Group I: level 0 (absence of ACME); group II: levels 1 and 2 (incomplete and complete perifoveal ACME respectively) and group III: levels 3 and 4 (up to one disc diameter and greater than one disc diameter ACME area respectively). The OCT macular map is divided into nine zones that correspond to the Early Treatment Diabe-tic Retinopathy Study Research - ETDRS(17) regions: fovea
within 1000 µm centered on the fixation point; internal peri-pheral ring, the circular band from the central 1000 µm to 3000 µm, divided into upper, lower, temporal, and nasal and; external peripheral ring from 3000 µm up to 6000 µm and the same subdivisions (Figure 1); therefore, fovea thickness rela-tes to the mean of the six spoke meridians inside 1000 µm centered on the foveola. The nine OCT zones were compared between the three subgroups of the study group and the control group and, between group I and groups II and III. To enable the data analysis, the Kruskal-Wallis method and Dunn’s comparison was used. Hospital das Clinicas’s Institu-tional Ethics Committee’s approval was obtained.
RESULTS
Among the 34 patients in the study group, 19 patients were female and 15 were male ranging in age (mean ± standard deviation) from 29 to 79 (66±10) years. Among the 36 eyes, 13 (36%) showed ACME with the subgroup classification as follows: 23 (64%) in group I, 10 (28%) in group II and 3 (8%) in group III. In the control group, 8 patients were female and 10 were male with ages ranging from 28 to 79 (64±11) years. The visual acuity (refraction) ranged from 20/20 to 20/60 (3.50 spherical and 5.00 cylindrical) in group I, from 20/20 to 20/100 (2.00 spherical and 5.00 cylindrical) in group II and, from 20/60 to 20/80 (2.00 spherical and 1.00 cylindrical) in group III. The retinal thickness for fovea ranged from 156 to 208 µm (185±15 µm) for the control group; in the study group it ranged from 153 to 232 µm (189±24 µm) for group I, from 163 to 260 µm (213±33 µm) for group II and from 419 to 494 µm (455±38 µm) for group III. The mean retinal thickness of the nine zones of the OCT map and the significance levels, considering all samples, are displayed in table 1. When compared to group I or to the control group, group III showed highly significant thicker retina for all zones (p<0.01), in particular for the fovea and inner nasal regions (p<0.001). When compared to group I or to the control group, group II showed significant thicker retina in fovea and inner temporal regions (p<0.05). The indivi-dual values in decreasing order for the fovea zone in the eyes with ACME are 260 µm, 256 µm, 237 µm, 233 µm, 215 µm, 212 µm, 194 µm, 187 µm, 174 µm and 163 µm, in group II and, 494 µm, 453 µm and 419 µm in group III.
DISCUSSION
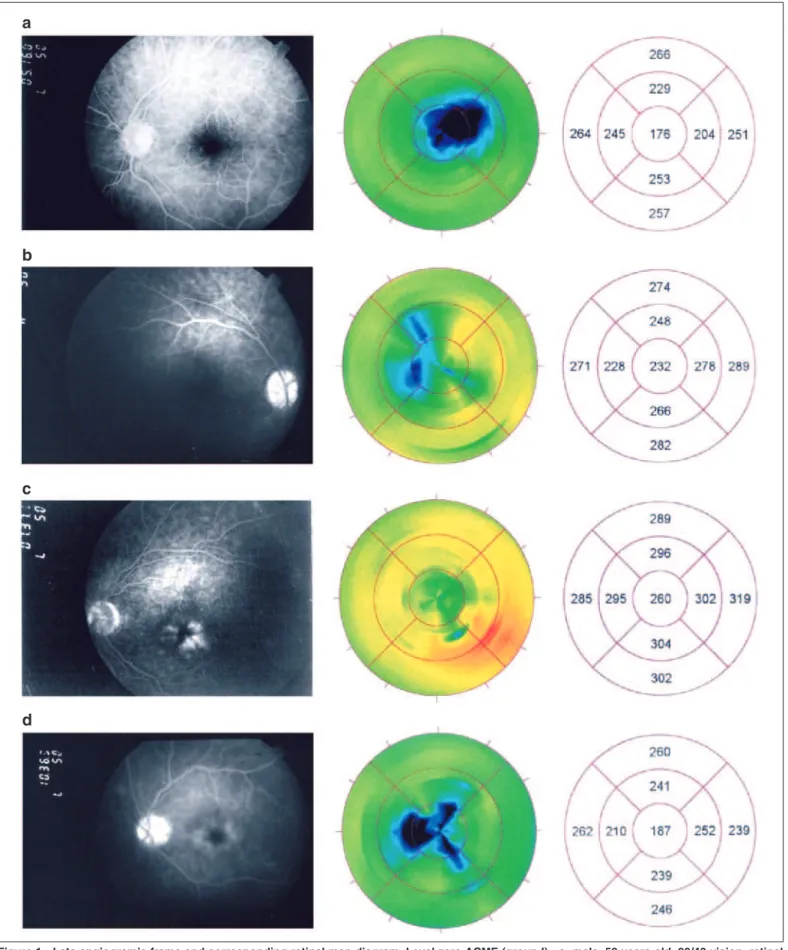
pseudo-Figure 1 - Late angiogram’s frame and corresponding retinal map diagram. Level zero ACME (group I) - a: male, 58 years old, 20/40 vision, retinal thickness at the fovea: 176 µm; b: male, 51 years old, 20/20 vision, retinal thickness at the fovea: 232 µm. Level 1 and 2 ACME (group II) - c: male, 64 years old, 20/20 vision, retinal thickness at the fovea: 260 µm; d: female, 77 years old, 20/20 vision, retinal thickness at the fovea: 187 µm.
a
b
c
phakic macular edema(4,6,16), this entity still continues to be
troublesome for doctors and their patients after uneventful cataract extraction. This study was conducted to evaluate the usefulness of the OCT retinal map in ACME diagnosis.
OCT is currently the most precise technique to measure retinal thickness in vivo. In one study, using manual OCT measurement of three horizontal and one vertical 2.8 mm lines through the fovea, analyzing the data with the angiograms of 153 diabetic macular edema patients and comparing them with the 30 control subjects, the authors found a sensitivity of 89% and specificity of 96% for detecting clinically significant ma-cular edema. The optimum variability coefficient between the measurements was reported to range from 2.3 to 3.3% for the control group and from 1.4 to 2.4% for diabetic patients(9).
Other authors, assessing through OCT the foveal thickness in 21 healthy eyes and nine having a macular edema, found a variability coefficient in the same patient of 10% in the control group and 15% among diabetics. The measurements were compared to those conducted using the Retina Thickness Analyser (RTA). Both methods produced reproducible values but, since the RTA showed a high number of falsely elevated measurements, it was concluded that the reliability of OCT was better(18). In 1998 a macular map software was developed,
allowing a bidimensional mapping of the macula(8). In this
protocol, six 6 mm long radiated lines, crossing each other at the fovea center, in a spoken pattern provide automatically the means for the nine macular ETDRS zones (mean of six lines for the fovea and mean of three lines in the peripheral inner and outer zones). The study has assessed 182 eyes with diabetic retinopathy, 55 eyes without retinopathy in diabetic patients and 73 eyes of healthy volunteers. It was found that the average reproducibility of the central fovea thickness was 11 µm in healthy patients and approximately 20 µm in diabetic patients. Also by this method, 10 eyes of healthy individuals and 10 eyes of diabetic subjects were studied, and the conclu-sion was that the interobserver, intraobserver and intervisitor reproducibility was excellent. A repeatability coefficient of less than 7 µm for healthy and 21 µm for diabetic subjects was found and, an intraclass correlation coefficient greater than
0.89 for healthy and 0.98 for diabetic subjects. The measure-ment variances were small in both healthy and diabetic sub-jects with reproducibilities of ± 5% and ± 6%, respectively(10).
We faced many difficulties in performing the OCT retinal map by the 5th postoperative week. Though using the near infrared light, elderly people felt uneasy during the 6-scan records. Most of them were unwilling to repeat the examina-tion and therefore, all retinal maps with at least five acceptable scan lines were included in this study. When taking the OCT scans, we noticed that the presence of an intraocular lens hampered the focus and, a double line was often visible in the retinographic image (Figure 2). This seems to signify either none or little damage in the scan reliability since it was shown that the presence of the intraocular lens does not influence retinal thickness assessment(13) and, even in the presence of
visually significant posterior capsule opacification, OCT is a reliable method to measure the foveal thickness(14).
Studies in pseudophakic eyes are less numerous than in diabetic patients. In one of these reports, comparing
retros-Table 1. Retinal thickness in the nine zones of the OCT retinal map in the control and study groups
Retinal thickness in micron (mean ± standard deviation)
Zone Control (n=22) Group I (n=23) Group II (n=10) Group III (n=3) p
Fovea 185±15 189±24 213±33‡ 455±038* 0.0032
Superior inner 247±17 242±21 257±21 367±021* 0.010
Inferior inner 246±20 242±17 253±32 412±058* 0.027
Temporal inner 223±19 224±24 245±26‡ 444±086* 0.0052
Nasal inner 247±17 234±23 254±43 374±033* 0.0050
Superior outer 252±15 257±15 260±19 294±022* 0.018
Inferior outer 254±14 252±17 263±21 322±055* 0.039
Temporal outer 244±15 240±22 255±32 404±122* 0.019
Nasal outer 261±12 259±15 266±20 312±033* 0.017
Kruskal-Wallis p values comparing all samples to the control group are displayed in the last column. Dunn’s test was applied to perform the analysis between the subgroups. The signs in the table indicate the significance level as follows: ‡<0.05 and *<0.01.
Figure 2 - Image from the video camera showing a double scan line. This is the right eye of a male, 49-year-old patient with the refraction:
pectively the preoperative retinal thickness at the foveal cen-ter with four postoperative periods, considering the scano-grams to be abnormal when 15 µm thicker than the preopera-tive value, the macula was considered thicker in 11 out of 41 eyes (27%), less than our angiographic findings (36%)(12).
In the present study, the foveal thickness for the control group and for group I was 185±15 µm and 189±24 µm in the fovea zone respectively, which is about 10 µm more than what was reported for eyes with no intraocular implant: 174±18 µm(8)
and of 177±19 µm to 179±19 µm(10). This difference is inside the
average reproducibility of the method(8,10). Since the fovea
thickness is an efficient indicator of the degree of diabetic edema on the OCT map(8,10), it may be presumed that the same
is true for ACME, which is a perifoveal disease. The ACMEs of group III, which are more easily diagnosed biomicros-copically, showed a high statistical difference in the retinal thickness at the fovea (455±38 µm) when compared to group I and to the control group. In table 1 we can see that the highest significance level in thickness was between group III and the control group for the fovea and, between group III and group I for the inner nasal zone (p<0.001). All other zones of group III eyes showed less significant difference from the control and group I eyes (p<0.01). Group II ACME, which is the most difficult to diagnose by slit lamp biomicroscopy, showed statis-tically significant difference from the control group or group I in fovea and inner temporal zones (p<0.05). When individual fovea values in these groups were looked at, a maximum measu-rement of 232 µm in group I and the range from 163 to 260 µm for group II were found. Considering that the variation for the method is about 10 µm(7-8,10), it may be difficult to differentiate
edema and no edema eyes in isolated cases. Should a fovea thickness of over 232 µm on the OCT macular map call the hypothesis of ACME among patients having this type of intraocular lens? Due to the smallness of our sample, a value beyond which a retinal thickening could be suspected can not be established. Figure 1 illustrates the overlap which may occur in individual cases between group I and group II eyes.
CONCLUSION
In conclusion, using the OCT 2 retinal map program, levels 3 and 4 ACME eyes (group III) showed a thicker retina than the control and no edema eyes in the nine studied zones. For levels 1 and 2 ACME eyes (group II) the fovea and temporal inner zones showed a thicker retina than control and no edema eyes. The OCT 2 retinal map is a reliable method to assess ACME. The fast OCT 3 map, simultaneously obtaining all six images, may prove to be better for the diagnosis of this entity.
RESUMO
Objetivo: Medir a espessura retiniana pela tomografia de coerência óptica (OCT) no edema macular angiográfico do
pseudofácico (ACME). Métodos: Trabalho prospectivo com-posto de um grupo de estudo com 36 olhos pseudofácicos, entre a 4ªe a 6ªsemana de pós-operatório, submetidos ao mapa macular com a tomografia de coerência óptica 2 e à angiofluo-resceinografia no mesmo dia e, um grupo controle com 22 olhos pseudofácicos com visão igual a 20/20 e no mínimo 6 meses de pós-operatório, submetidos apenas ao mapa macular com o tomografia de coerência óptica 2. Os critérios de exclu-são foram diabetes e maculopatias e exames de qualidade insuficiente para análise. Os angiogramas foram divididos em 3 grupos segundo a intensidade do edema: Grupo I: nível 0 (ausência de edema macular angiográfico do pseudofácico); grupo II: níveis 1 e 2 (edema macular angiográfico do pseudo-fácico perifoveal incompleto e completo) e grupo III: níveis 3 e 4 (edema macular angiográfico do pseudofácico até um e maior que um diâmetro papilar de área). As nove zonas do mapa macular da tomografia de coerência óptica foram comparadas entre o controle os três subgrupos do grupo de estudo e, entre o grupo I e os grupos II e III. Resultados: Dos 36 olhos do grupo de estudo, 23 (64%) foram classificados como grupo I, 10 (28%) como grupo II e 3 (8%) como grupo III. A espessura para a zona fóvea foi de 185±15 µm no grupo controle, de 189±24 µm no grupo I, de 213±33 µm no grupo II e de 455± 38 µm no grupo III. Diferenças significativas para esta região foram observadas entre o grupo controle ou grupo I e o grupo III para todas as zonas (p<0,01) e, entre o grupo I e o grupo II para a zona fóvea e a temporal interna (p<0,05). Conclusão: O programa de mapa macular da tomografia de coerência óptica 2 é útil para o diagnóstico de edema macular angiográfico do pseudofácico.
Descritores: Catarata; Edema macular cistóide/ diagnóstico; Angiofluoresceinografia; Tomografia de coerência óptica; Retina/patologia
REFERENCES
1. Eduardo Leite Arieta C, Nicolini Delgado AM, Jose NK, Temporini ER, Alves MR, de Carvalho Moreira Filho D. Refractive errors and cataract as causes of visual impairment in Brazil. Ophthalmic Epidemiol. 2003;10(1):15-22. 2. Minassian DC, Mehra V. 3.8 million blinded by cataract each year: projections
from the first epidemiological study of incidence of cataract blindness in India. Br J Ophthalmol. 1990;74(6):341-3. Comment in: Br J Ophthalmol. 1990;74 (6):324.
3. Leinonen J, Laatikainen L. Changes in visual acuity of patients undergoing cataract surgery during the last two decades. Acta Ophthalmol Scand. 2002;80 (5):506-11.
4. Wright PL, Wilkinson CP, Balyeat HD, Popham J, Reinke M. Angiographic cystoid macular edema after posterior chamber lens implantation. Arch Ophthal-mol. 1988;106(6):740-4.
5. Stark WJ Jr, Maumenee AE, Fagadau W, Datiles M, Baker CC, Worthen D, Klein P, Auer C. Cystoid macular edema in pseudophakia. Surv Ophthalmol. 1984;28Suppl:442-51.
6. Hitchings RA. Aphakic macular oedema: a two-year follow-up study. Br J Ophthalmol. 1977;61(10):628-30.
9. Goebel W, Kretzchmar-Gross T. Retinal thickness in diabetic retinopathy: a study using optical coherence tomography (OCT). Retina. 2002;22(6):759-67. 10. Massin P, Vicaut E, Haouchine B, Erginay A, Paques M, Gaudric A. Reproduci-bility of retinal mapping using optical coherence tomography. Arch Ophthalmol. 2001;119(8):1135-42.
11. Antcliff RJ, Stanford MR, Chauhan DS, Graham EM, Spalton DJ, Shiling JS, et al. Comparison between optical coherence tomography and fundus fluorescein angiography for the detection of cystoid macular edema in patients with uveitis. Ophthalmology 2000;107(3):593-9.
12. Sourdille P, Santiago PY. Optical coherence tomography of macular thickness after cataract surgery. J Cataract Refract Surg. 1999;25(2):256-61.
13. Grewing R, Becker H. Retinal thickness immediately after cataract surgery measured by optical coherence tomography. Ophthalmic Surg Lasers. 2000;31 (3):215-7.
14. Hougaard JL, Wang M, Sander B, Larsen M. Effects of pseudophakic lens capsule opacification on optical coherence tomography of the macula. Curr Eye Res. 2001;23(6):415-21.
15. Catier A, Tadayoni R, Paques M, Erginay A, Haouchine B, Gaudric A, et al. Characterization of macular edema from various etiologies by optical coherence tomography. Am J Ophthalmol. 2005;140(2):200-6.
16. Yannuzzi LA. A perspective on the treatment of aphakic cystoid macular edema. Surv Ophthalmol. 1984;28 Suppl:540-53.
17. Photocoagulation for diabetic macular edema. Early Treatment Diabetic Retino-pathy Study report number 1. Early Treatment Diabetic RetinoRetino-pathy Study research group. Arch Ophthalmol. 1985;103(12):1796-806.
18. Neubauer AS, Priglinger S, Ullrich S, Bechmann M, Thiel MJ, Ulbig MW, et al. Comparison of foveal thickness measured with the retinal thickness analyzer and optical coherence tomography. Retina. 2001;21(6):596-601.