THE IMPORTANCE OF GLUCOSE FOR THE FREEZING
TOLERANCE/INTOLERANCE OF THE ANURAN
AMPHIBIANS
Rana catesbeiana
AND
Bufo paracnemis
STEINER, A. A., PETENUSCI, S. O., BRENTEGANI, L. G. and BRANCO, L. G. S. Departamento de Fisiologia, Faculdade de Odontologia de Ribeirão Preto, Universidade de São Paulo,
Ribeirão Preto, SP, Brazil
Correspondence to: Luiz G. S. Branco, Departamento de Fisiologia, Faculdade de Odontologia de Ribeirão Preto, Universidade de São Paulo, CEP 14040-904, Ribeirão Preto, SP, Brazil, e-mail: lgsbranc@usp.br
Received June 17, 1998 – Accepted December 8, 1998 – Distributed May 31, 2000 (With 4 figures)
ABSTRACT
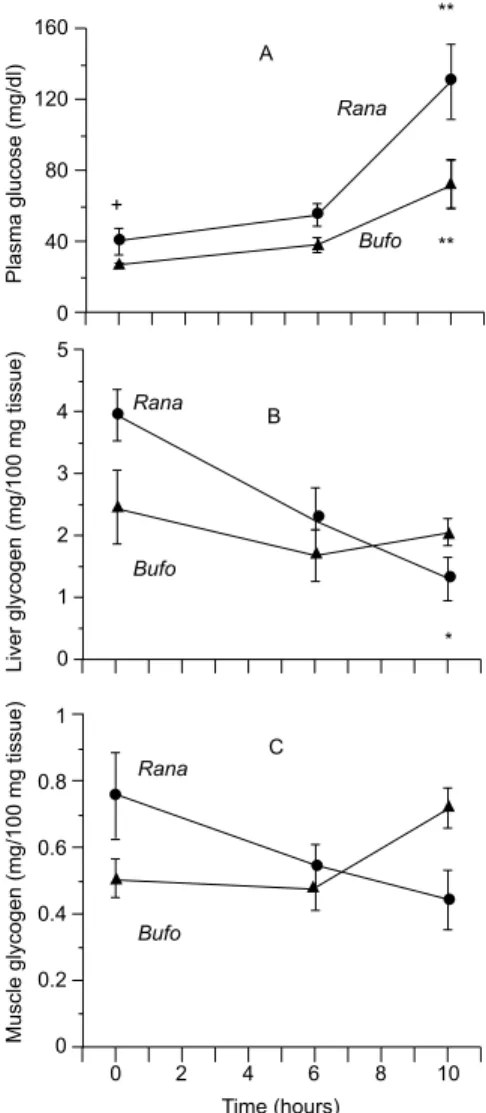
Several species of terrestrially hibernating frogs, turtles and insects have developed mechanisms, such as increased plasma glucose, anti-freeze proteins and antioxidant enzymes that resist to freezing, for survival at subzero temperatures. In the present study, we assessed the importance of glucose to cryoresistance of two anuran amphibians: the frog Rana catesbeiana and the toad Bufo paracnemis. Both animals were exposed to –2ºC for measurements of plasma glucose levels, liver and muscle glycogen content, haematocrit and red blood cell volume. Frogs survived cold exposure but toads did not. Blood glucose concentration increased from 40.35 ± 7.25 to 131.87 ± 20.72 mg/dl (P < 0.01) when the frogs were transferred from 20 to –2ºC. Glucose accumulation in response to cold expo-sition in the frogswas accompanied by a decrease (P < 0.05) in liver glycogen content from 3.94 ± 0.42 to 1.33 ± 0.36 mg/100 mg tissue, indicating that liver carbohydrate reserves were probably the primary carbon source of glucose synthesis whereas muscle carbohydrate seems unimportant. In the toads, the cold-induced hyperglycaemia was less (P < 0.05) pronounced (from 27.25 ± 1.14 to 73.72 ± 13.50 mg/dl) and no significant change could be measured in liver or muscle glycogen. Cold exposition had no effect on the haematocrit of the frogs but significantly reduced (P < 0.01) the haematocrit of toads from 20.0 ± 2.1% to 5.8 ± 1.7% due to a decreased red blood cell volume (from 1532 ± 63 to 728 ± 87 mm3). When toads were injected with glucose, blood glucose increased to levels simi-lar to those of frogs and haematocrit did not change, but this failed to make them cryoresistent. In conclusion, the lack of cold-induced glucose catabolism may not be the only mechanism responsible for the freeze intolerance of Bufo paracnemis, a freeze-intolerant species.
Key words: Bufo paracnemis, Rana catesbeiana, freeze tolerance, cryopreservation, glucose.
RESUMO
A importância da glicose para a tolerância/intolerância ao congelamento dos anfíbios anuros Rana catesbeiana e Bufo paracnemis
Diversas espécies de rãs terrestres, tartarugas e insetos desenvolveram mecanismos para resistência ao congelamento, como o aumento dos níveis de glicose, proteínas anticongelantes e enzimas antioxidantes. Neste estudo, verificou-se a importância da glicose para a crioresistência de dois anfíbios anuros: a rã Rana catesbeiana e o sapo Bufo paracnemis. Os animais foram expostos a –2ºC para
que o catabolismo do glicogênio hepático foi, provavelmente, a principal fonte de carbono para a síntese de glicose, enquanto o glicogênio muscular parace ser de menor importância. Nos sapos, a hiperglicemia induzida pelo frio foi relativamente menor (de 27,25 ± 1,14 para 73,72 ± 13,50 mg/dl; P < 0.05) e não verificou-se variação significativa no conteúdo de glicogênio muscular e hepático. A exposição a –2ºC não teve efeito sobre o hematócrito das rãs, mas reduziu signi-ficativamente (P < 0.01) o hematócrito dos sapos de 20,0 ± 2,1% para 5,8 ± 1,7%, devido a uma redução do volume das hemácias (de 1532 ± 63 para 728 ± 87 mm3). Quando glicose foi injetada nos sapos, a glicemia elevou-se a níveis similares àqueles das rãs e o hematócrito não variou, mesmo assim os sapos não se tornaram crioresistentes. Em conclusão, a deficiência no catabolismo da glicose, induzido pelo frio, não parece ser o único mecanismo responsável pela intolerância ao congelamento de Bufo paracnemis, uma espécie não tolerante ao congelamento.
Palavras-chave: Bufo paracnemis, Rana catesbeiana, tolerância ao congelamento, criopreservação, glicose.
INTRODUCTION
Several species of amphibians are able to survive during extremely unfavorable conditions such as, subzero temperatures (Aarset, 1982; Storey & Storey, 1988, 1992; Zachariassen, 1985). Wood frogs, for instance, may be frozen for 2 weeks with no cardiorespiratory activity and with up to 65% of their total body water as ice (for rev. Pinder et al., 1992; Storey et al., 1996). A cryoprotector, a low molecular weight molecule, such as glucose (in Pseudacris crucifer and P. triseriata) or glycerol (in Hyla versicolor), seems to play an important role in this phenomenon, warranting survival of these animals during freezing (Storey & Storey, 1984, 1985, 1986). These cryoprotector elevates body fluid osmolarity, decreasing the extent of cell volume reduction during extracellular ice formation, preventing cell shrinkage below a critical minimum cell volume and stabilizing membrane proteins (cf. Storey et al., 1996). Other factors are also important to promote crioprotecion, among them antifreeze proteins and an special system of antioxidants proteins (cf. Storey et al.,
1996).
Very little is known about the freezing tolerance/intolerance of bufonids, so comprehen-sive explanations for the mechanisms and evolution of freeze tolerance in anurans are lacking. One recent study showed that liver phosphorylase activity is significantly higher in the wood frog
Pseudacris triceriata than in the toad Bufo cognatus (a freezing intolerant species), suggesting that the ability to mobilize glucose from liver glycogen is associated with freezing tolerance
(Swanson et al., 1996). In the present study, we assessed the importance of blood glucose for freezing tolerance/intolerance of two anuran amphibians, the toad Bufo paracnemis from neotropical areas, and the bullfrog Rana cates-beiana from neoartical areas.
MATERIAL AND METHODS
Animal source and maintenance
Experiments were performed during the active, non-aestivating period of the 2 species from December to March (summer season). Adult bullfrogs, Rana catesbeiana, of either sex weighing
187.4 ± 12.5 g (mean ± SEM) were obtained from a commercial supplier 2-3 weeks before expe-rimentation. Toads, Bufo paracnemis, (mass
192.9 ± 18.2 g) were collected at the Campus of the University of São Paulo at Ribeirão Preto from November to February. Upon arrival, the animals were kept indoors in aquaria with free access to tap water and basking areas at 20-22ºC, on a 12h:12h light:dark photoperiod (Nansen timer digital TE 102). All animals were fed with chicken liver once a week until 7 days before the expe-rimental procedures.
Glycogen extraction and measurement
Glycogen was extracted according to the method of Sjorgren et al. (1938). Briefly, liver and
(–70ºC) in tubes until ready for assay. The tubes were kept on ice after removal from frozen storage and 2 ml of 30% KOH saturated with Na2SO4 was added to the samples, making sure that the tissue was completely immersed in the solution. The tubes were placed in a boiling water bath (100ºC) for one hour until a homogeneous solution was obtained, and were then removed from the water bath and cooled in ice. Absolute ethanol (4.5 ml) was added to precipitate the glycogen from the alkaline digest. The samples were left in ice for 10 minutes and then centrifuged (Hermile Z 360 K) at 840 g for 20 minutes. The supernatant was carefully aspirated and the glycogen washed with distilled water and precipitated with ethanol again. Glycogen content was estimated with anthrone reagent (Seitfer et al. 1950). Briefly, glycogen precipitates were dissolved in 3.0 ml distilled water, transferred to a 10 ml volumetric flask and diluted to the mark with water. The contents of the flasks were thoroughly mixed, and the measured portion was then further diluted with water in a second volumetric flask so as to yield a solution of glycogen concentration of 3-30 mg/ ml. Anthrone (4 ml) was carefully added to 2 ml aliquots of the final dilution in the ice bath, and the tubes were then placed in a boiling water bath (100ºC) for 10 min. After the tubes cooled down, the absorbance of the samples was measured at 620 nm on a Micronal B380 spectrophotometer. Glucose at different concentrations (20, 30 and 50 mg/ml) was used for a calibration curve.
Plasma glucose concentration and red blood cell volume
Glucose concentration was determined quantitatively by an enzymatic (hexokinase) method (Sigma, St. Louis, MO, USA).
To determine the cell volumes, the blood samples were examined under the light microscope with a 100x objective to which a light camera (Reichert) was adapted. The cell was projected onto draft paper at a final 1140x magnification. The outlines of the images obtained (50 cells per animal) was drawn with a soft pencil. The longest and shortest axes were measured in order to obtain the cell volume, and a third axis was obtained by the geometric average of the first two. The volume was calculated according to Valeri et al. (1967) by the following formula:
V = 0.35351426 . D
1. D2. (D1. D2)1/2
were D1 and D2 represent the longest and shortest axis, respectively.
This method was originally described to determine mammals red cells volume. In the present study, we used the same method to access the differences of blood red cell volume of amphibians under two different experimental conditions (20 and –2ºC).
Experimental procedure
The experiments were performed on conscious, unrestrained and undisturbed frogs and toads. During the experiments the frogs were housed in a 1 liter plastic chamber lined with moist paper towels placed inside an environmental chamber (FANEM, B.O.D. 347 cd, São Paulo, Brazil). During the control period the animals were left undisturbed at 20ºC for 48 hours. Control animals were decapitated (n = 6), tissue (liver and
leg muscle) collected for glycogen determination, and blood (about 300 ml) obtained from the pool that had accumulated above the heart for measurements of haematocrit and red blood cell volume. Immediately after being withdrawn, blood was spun (Ravan microcentrifuge, model Ciclo I, São Paulo, Brazil) and plasma was frozen at –20ºC until the time for the determination of plasma glucose concentration.
Another group of animals was transferred from 20 to –2ºC by setting the environmental chamber temperature and placing the animal chamber on an ice-cold bath. Cloacal temperature probes confirmed that there was no difference between animal temperature and environmental chamber temperature after 2 hour at the new temperature. The same procedure described above for the control group was repeated at 6 and 10 hours after transfer to –2ºC.
The animals which were not decapitated during experiments were judged to be alive if, after 2 days of thawing at 20ºC, they appeared to have recovered.
Calculations and statistics analysis
All values are reported as means ± SEM. The effects of freezing on blood glucose, liver glycogen, muscle glycogen and haematocrit were evaluated by analysis of variance (ANOVA), and the diffe-rence between means was assessed by the Tukey-Kramer Multiple Comparisons Test. The effect of freezing on cell volume was assessed by comparing the mean values before (20ºC) and after (–2ºC) freezing by a paired t-test. P < 0.05 was considered significant.
RESULTS
All (6 of 6) of the bullfrogs exposed to –2ºC up to 10 hours survived, whereas only 66% (4 of 6) of the toads exposed to the same temperature survived for 8 hours and none was alive after 10 hours (6 of 6).
Plasma glucose concentration was signi-ficantly higher in the bullfrogs when compared to the toads not only during control conditions (20ºC) but also during cold-exposition (–2ºC) (Fig. 1, panel A). Liver glycogen was significantly higher in bullfrogs than in toads at 20ºC, and decreased significantly after 10 hours at –2ºC, whereas no change was measured in the toad’s livers (Fig. 1, panel B). Slopes from arbitrary linear regression of the relationships between liver glycogen and time was (mean ± SEM): –2.63 ± 0.01 mg/100 mg tissue/hour for frogs and was close to zero for toads. Muscle glycogen was not significantly different and cold caused no alterations in either animal species (Fig. 1, panel C).
No significant difference in haematocrit was observed between frogs and toads at 20ºC. Exposure to –2ºC caused no change in the frog’s haematocrit but a dramatic drop in the toad’s, during both 6 and 10 hours at –2ºC (Fig. 2). Red blood cell volume was approximately 3 times larger in bullfrogs than in toads (P < 0.001) under 20ºC. Cold exposition (–2ºC) caused no change in the frog’s cell volume but a significant 53% reduction in the toad’s (Fig. 3).
When toads were submitted to glucose infusion, plasma glucose increased from 20.7 ±
1.6 to 62.3 ± 11.6 mg/dl while ambient temperature was kept at 20ºC. Exposure to –2ºC caused an additional 3-fold elevation in plasma glucose levels that was maintained to the end of the experimental period (Fig. 4, panel A). Although cold exposure caused no change in haematocrit in the animals infused with glucose (Fig. 4, panel B), toads did not survive exposure to –2ºC for 10 hours.
DISCUSSION
In the present study, we compared a freeze-intolerant toad using a freeze tolerant frog, as a control. Differences with respect to plasma glucose, liver glycogen, heamatocrit and blood cell volume, were evaluated. The frog data is consistent with previous reports (cf. Storey et al., 1996). Our study provides evidence that increased plasma glucose is needed to prevent cell shrinkage, although this is not the only cause of toad’s death.
Exposure to cold (–2ºC) was lethal to toads (Bufo paracnemis), indicating that this species is freeze-intolerant, but not to bullfrogs (Rana catesbeiana). In fact, a previous study (Swanson
et al., 1996) has observed that the toads from neoartical areas, Bufo cognatus and B. woodhousei, are freezing intolerant, indicating that freezing tolerance may be not adaptative, but a phylogenetic characteristic of Bufonidae. In both species we observed a significant increase in blood glucose concentration when the animals were exposed to –2ºC. Both basal glucose levels and the cold-induced hyperglycaemia were significantly higher in the bullfrogs than in the toads (Fig. 1, panel A). It is known that the accumulation of high concentrations of cryoprotector (glucose) is essential for freezing tolerance (Canty et al., 1986; Constanzo & Lee, 1991). Besides glucose, other factors may also be involved, at least in frogs, such as antifreeze proteins (Davies & Hew, 1990; DeVries & Cheng, 1992; DeVries, 1983), increased membrane glucose transporters (King et al., 1993, 1995) and an increased activity of antioxidant enzymes (Storey, 1996; Storey et al., 1996).
We observed a significant decrease in liver glycogen content in frogs but not in toads (Fig. 1, panel B). As to muscle glycogen, no significant change was observed in either species (Fig. 1, panel C). Synthesis of blood glucose is based on the catabolism of liver glycogen (Pinder et al., 1992;
Storey & Storey, 1992) that seems to be well correlated with our data for bullfrogs, but not for toads which showed a significant increase in blood glucose without a concomitant significant reduction
of liver glycogen content. This fact may be due to the non-significant drop in liver glycogen of the toads or even to an activation of gluconeogenesis pathway, which has been usually observed in the liver of mammals. Actually, the latter is an interesting hypothesis that needs to be tested. Recently it has been shown that glycogen phosphorilase activity is higher in freeze-tolerant frogs (Psedacris triseriata) than in freeze-intolerant toads (Bufo cognatus and Bufo woodhousei) (Swanson et al.,
160
120
80
40
0 5
4
3
2
1
0
1
0.8
0.6
0.4
0.2
0 +
Rana
Bufo
**
** A
Plasma
glucose
(mg/dl)
Liver
glycogen
(mg/100
mg
tissue)
Muscle
glycogen
(mg/100
mg
tissue)
Bufo
Bufo Rana
Rana
B
*
C
0 2 4 6 8 10 Time (hours)
1996). In agreement with this study (Swanson et al., 1996), we observed a more pronounced decrease in liver glycogen content in frogs (slope = –2.63 mg/100 mg tissue/hour at –2ºC) than in toads (no significant decrease). Furthermore, basal liver glycogen content was relatively (P < 0.05) higher in the frogs (Fig. 1, panel B). Since liver glyco-genolysis is triggered by ice nucleation in the body
(Lee et al., 1995; Storey et al., 1991; Wolanczyk
et al., 1990) the sustained liver glycogen content of toads may also be due to the lack of a proper sensory system. Alternatively, the higher levels of body glycogen observed in Rana could be related with the fact that these frogs are able to obtain more energy from non aerobic metabolism than toads, during intense activity.
30
25
20
15
10
5
0
0 2 4 6 8 10 Time (hours)
Haematocrit
(%)
Rana
**
*
Bufo
Fig. 2 — Effect of freezing on haematocrit of toads and frogs. Freezing was accompanied by a decrease in the haematocrit in toads. Mean ± S.E.M. (N = 5 to each species); * (P < 0.05) and ** (P < 0.01).
5,000
4,000
3,000
2,000
1,000
0
Red
blood
cell
volume
(
m)
µ
3
Rana Bufo
+
** 25ºC –2ºC
Fig. 3 — Effect of freezing on red blood cell volume. Toad cells are significantly (P < 0.01) smaller than frog cells under control conditions (+ denotes difference in basal cell volume between species). Cold exposure caused a decrease (** de-notes P < 0.01) in red blood cell volume in toads but not in frogs. Mean ± S.E.M. (N = 6 for each species.)
Colligative cryopretectants (glucose in the case of Rana catesbeiana) are accumulated in high concentrations and function primarily to lessen the extent of cell volume reduction during extracellular
Storey et al., 1996). This cell protection mechanism,
i.e., hyperglycaemia, might be related to the differences observed in the haematocrit of frogs and toads (Fig. 2). In the latter, the relatively small increase in plasma glucose concentration which was observed in toads may not be sufficient to keep a constant cell volume during freezing, with a consequent decrease in the haematocrit (Figs. 2 and
3). The cell volume reduction may be responsible for animal death (Storey & Storey, 1992). When we artificially increased the toad’s blood glucose concentration to levels slightly above of those of the frogs by means of infusion, haematocrit did not change during freezing (Figs. 4, panels A and B), indicating a sustained red blood cell volume. Nevertheless, no toad survived exposition at –2ºC.
250
200
150
100
50
0
30
25
20
15
0
Plasma
glucose
(mg/dl)
Hematocrit
(%)
Glucose infusion
Glucose infusion
A
B –2ºC
–2ºC
* *
–0,18 –0,16 0 2 4 6 8 10 Time (hours)
Fig. 4 — Effect of freezing on plasma glucose levels and haematocrit of toads previously submitted to glucose infusion. Panel A shows that freezing caused a drastic increase in blood glucose levels (*P < 0.05). Panel B shows that haematocrit did not change during freezing. However, toads did not survive freezing temperatures. Mean ± S.E.M. (N = 4).
Besides hyperglycaemia, it has been shown that for any low molecular weight metabolite to be effective as a cryoprotector it must be able to
in the number of membrane transporters during freezing in the frog Rana sylvatica (King et al.,
1993, 1995). This increase might also have happened in the toads studied here, whose haema-tocrit was kept steady.
Perhaps, haematocrit did not change because the red blood cell glucose transporter (GLUT1) may be more effective during freezing than the transporters of another cell type.
In conclusion, the present study shows that toads have a relatively reduced basal liver glycogen content and a smaller increase in plasma glucose than frogs during subzero temperatures exposition, which may not be large enough to avoid cell shrinkage. However, the lack of freeze-induced glucose catabolism is not the only factor respon-sible for the toads’ freeze intolerance.
This study was supported by Fundação de Amparo à Pesquisa do Estado de São Paulo (FAPESP) Grant 96/0711-7 and Conselho Nacional de Desenvolvimento Científico e Tecnológico (CNPq) Grant 520220-96-0. A.A.S. was the recipient of a fellowship from FAPESP.
REFERENCES
AARSET, A. V., 1982, Freezing tolerance in intertidal verte-brates (a review). Comp. Biochem. Physiol., A. 73: 571-580. ASHWOOD-SMITH, M. J., 1987, Mechanisms of cryoprotection action. In: K. Bowler & B. J. Fuller (eds.),
Temparature and animals Cells. pp. 395-406. Company of Biologists, Cambridge.
CANTY, A., DRIEDZIC, W. R. & STOREY, K. B., 1986, Freeze tolerance of isolated ventricle strips of the wood frog, Rana sylvatica. Cryo-letters, 7: 81-86.
CONSTANZO, J. P. & LEE, R. E., 1991, Freeze-thaw injury in erythrocytes of the freeze tolerant wood frog, Rana sylvatica. Am. J. Physiol., 261: R1346-1350. DAVIES, P. L. & HEW, C. L., 1990, Biochemistry of fish
antifreeze proteins. FASEB J., 4: 2460-2468.
DEVRIES, A. L. & CHENG, C. H. C., 1992, The role of an-tifreeze glycopeptides & peptides in the survival of cold-water fishes. In: G. N. Somero, C. B. Osmond & C. L. Bolis (eds.), Water and Life. pp. 301-315. Springer-Verlag, Berlim.
DEVRIES, A. L., 1983, Antifreezes peptides & gycopeptides in cold-water fishes. Ann. Rev. Physiol., 45: 245-260. KING, P. A., ROSHOLT, M. N. & STOREY, K. B., 1993,
Adaptations of plasma membrane glucose transport fa-cilitate cryoprotectant distribution in freeze tolerant frogs. Am. J. Physiol., 265: R1036-1042.
KING, P. A., ROSHOLT, M. N. & STOREY, K. B., 1995, Seazonal changes in plasma membrane glucose transport in freeze tolerant wood frogs. Can. J. Zool., 73: 1-9.
LEE, M. R., LEE, R. E., STRONG-GANDERSON, J.M. & MINGES, S. R., 1995, Isolation of ice nucleating active bacteria from the freeze tolerant frog, Rana sylvatica.
Cryobiol., 32: 358-365.
MAZUR, P., 1984, Freezing of living cells: mechanisms and implications. Am. J. Physiol., 247: C125-C142. PINDER, A. W., STOREY, K. B. & ULTSCH, G. R., 1992,
Estivation and hibertation. In: M. E. Feder & W. W. Burggren (eds.), Environmental Physiology of the Am-phibians. pp. 250-274. University of Chicago, Chigago. SEITFER, S., DAYTON, S., NOVIC, B. & MUNTWYLER, E., 1950, The estimation of glycogen with the anthrone reagent. Arch. Biochem., 25: 191-200.
SJORGREN, B., NORDENSKJOLD, T., HOLMGEEM, H. & MÖLLERSTRÖ, J., 1938, Beitrag Zur Kenntnis der Leverrhythmik (Glycogen, phosphor und Calcium in der Kaninchenleber). Pflügers Arch. Ges. Physiol., 240: 427-432.
STOREY, K. B., 1996, Oxidative stress: Animal adaptations in nature. Braz. J. Med. Biol. Res., 29: 1715-1733. STOREY, K. B. & STOREY, J. M., 1984, Biochemical
ad-aptation for freezing tolerance in the wood frog, Rana sylvatica. J. Comp. Physiol., B 155: 29-36.
STOREY, J. M. & STOREY, K. B., 1985, Triggering of cryoprotectant synthesis by the initiation of ice nucle-ation in the freeze tolerant frog, Rana sylvatica. J. Comp. Physiol., B 156: 191-195.
STOREY, K. B. & STOREY, J. M., 1986, Freeze tolerance and intolerance as strategies of winter survival in terres-trially-hibernating amphibians. Comp. Biochem. Physiol., 83A: 613-617.
STOREY, K. B. & STOREY, J. M., 1988, Freeze tolerance in animals. Physiological Rev., 68: 27-84.
STOREY, K. B. & Storey, J. M., 1992, Natural freeze tol-erance in ectothermic vertebrates. Ann. Rev. Physiol., 54: 619-637.
STOREY, K. B., MCDONALD, D. G., DUMAN, J. G. & STOREY, J. M., 1991, Blood chemistry and ice nucle-ating activity in hatchling painted turtles. Cryo-Letters, 12: 351-358.
STOREY, K. B., MOSSER, D. D., DOUGLAS, D. N., GRUNDY, J. E. & STOREY, J. M., 1996, Biochemistry below 0ºC: nature’s frozen vertebrates. Braz. J. Med. Biol. Res., 29: 293-307.
SWANSON, D. L., GRAVES, B. M. & KOSTER, K. L., 1996, Freezing tolerance/intolerance and cryoprotectant synthesis in terrestrially overwintering anurans in The Great Plains, USA. J. Comp. Physiol., B 166: 110-119. VALERI, V., CRUZ, A. R., BRANDAO, J. S. H. & LISON, L. S., 1967, Relationship between cell nuclear volume and deoxyribonucleic acid of cell of normal epithelium, of carcinoma in situ and of invasive carcinoma of the uterine cervix. Acta Cytol., 11: 488-496.
WOLANCZYK, J. P., STOREY, K. B. & BAUST, J. G., 1990, Nucleating activity in the blood of the freeze tol-erant frog. Cryobiol., 27: 328-335.