Article
J. Braz. Chem. Soc., Vol. 23, No. 1, 120-123, 2012. Printed in Brazil - ©2012 Sociedade Brasileira de Química 0103 - 5053 $6.00+0.00
A
*e-mail: [email protected]
Morphology, Microstructure and Electrocatalytic Properties of
Activated Copper Surfaces
Juan C. M. Gamboa, Denise F. S. Petri, Tânia M. Benedetti, Vinicius R. Gonçales and Mauro Bertotti*
Instituto de Química, Universidade de São Paulo, 05508-900 São Paulo-SP, Brazil
Alterações morfológicas em superfícies de cobre resultantes da aplicação de um protocolo definido de potencial foram examinadas por microscopia eletrônica de varredura (MEV) e microscopia de força atômica (AFM). Os resultados mostraram uma boa correlação entre o tempo empregado na ativação do eletrodo, microestrutura resultante e a atividade eletroquímica.
Morphologic changes on copper surfaces upon applying an established potential protocol were examined by scanning electron microscopy (SEM) and atomic force microscopy (AFM). The results showed a good correlation between the time employed in the electrode activation and the resulting microstructure and electrochemical activity.
Keywords: nitrite, copper electrode, activation process, SEM, AFM
Introduction
The deliberate manipulation of electrodic surfaces consists of an area of continuing interest, because this approach leads to an improvement in the ability to recognize molecules and carry out electron transfer processes at higher rates. Hence, one of the dominant subjects in electrochemistry is the attempt to control the chemical composition and morphological structure of the electrode surface to gain advantages in electroanalytical determinations. It is well known that the electroactivity of copper surfaces depends strongly on their morphology, surface area and structure, which would in turn depend on the method employed to prepare the electrode prior to electrochemical measurements. Hence, several studies have been reported in the literature on the use of copper surfaces aiming for the quantification of different species such as glucose,1 carbohydrates,2 ethanol,3 nitrate,4, 5 nitrite,5 and sufite.6
The electrochemical determination of nitrate after deposition of copper from solutions containing Cu(II)
has been reported by some authors,7,8 who examined
qualitatively the morphology of the copper deposit by scanning electron microscopy (SEM) and atomic force microscopy (AFM). The increased sensitivity for
nitrate after the surface modification by deposition of the fresh copper layer was attributed to morphologic changes assessed through quantitative parameters such as roughness and porosity of the film. Our group reported a new procedure for the activation of copper surfaces using a potential protocol based on copper oxidation and subsequent reduction of generated copper ions.9,10 Taking into account these findings and as an attempt to understand which surface parameters control the electrochemical activity, the present study aims to evaluate whether there is a quantitative correlation between the surface area of copper electrodes and their electrochemical properties. Accordingly, copper electrodes were activated for different periods of time to produce layers which were analyzed by SEM and AFM. Then, the electrochemical activity of each generated surface was evaluated towards the cathodic reduction of nitrite. To the best of our knowledge, this is the first time that such a quantitative approach is applied for copper electrodes.
Experimental
Chemicals and materials
Gamboa et al. 121 Vol. 23, No. 1, 2012
The supporting electrolyte was a 0.1 mol L-1 Na
2SO4 solution, pH 2.0 (adjusted with H2SO4).
Electrodes and instrumentation
An Autolab PGSTAT 30 (Eco Chemie) bipotentiostat with data acquisition software made available by the manufacturer (GPES 4.8 version) was used for the electrochemical measurements. Experiments were done in a conventional electrochemical cell using a Ag/AgCl (saturated KCl) electrode and a platinum wire as reference and counter electrodes, respectively. The working electrode
was a 1 cm2 pure copper sheet (Pertech of Brazil)
supported on a phenolic resin plate. The copper electrode was activated by polarization at 0.50 V (copper dissolution) and then at –0.25 V (copper redeposition) for 10, 20 and 30 s. Solutions were deoxygenated with argon for 5 min prior to the experiments.
AFM topographic images were obtained for copper surfaces using a pico SPM-LE molecular imaging system with cantilevers operating in the intermittent-contact mode (AAC), slightly below their resonance frequency of
approximately 305 kHz in air. Scan areas (25 × 25) µm2
with a resolution of 512 × 512 pixels were obtained. Image processing and the determination of the root mean square (RMS) roughness values were performed using the Pico Scan software. At least three films of the same composition were analyzed at different topographic positions on the surface. The morphology of the copper surfaces was analyzed by using a field emission gun scanning electron microscope (FEG SEM) JEOL JSM-7401F. In order to estimate the copper film thickness, the electrodes were tilted at 90o, so that the electron beam scanned the interface copper/phenolic resin plate. Copper substrates were conveniently pre-treated with the established potential protocol and stored in plastic bottles purged with argon to prevent copper surfaces from oxidation prior to AFM and SEM analyses.
Results and Discussion
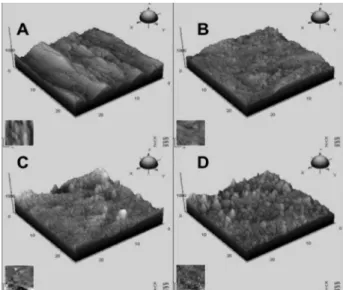
The activation of the copper surface by the proposed procedure involves the application of positive and negative potential steps. AFM topographic images were obtained to evaluate the effect of the activation time on the morphology and the surface area of the copper layer. Figure 1 presents AFM images prior to polarization of the copper electrode and after 10, 20 and 30 s of activation according to the procedure described in the Experimental section. As it can be seen, the electrode surface presents a rather heterogeneous morphology upon activation and the
appearing of protuberances is noticed to a large extent as the activation time increases from 10 to 30 s.
SEM images obtained for copper electrodes prior to activation presented a homogeneous surface (Figure 2A). After activation for 10 s (Figure 2B) the formation of well-defined filaments is noticed, evidencing the nucleation of electrodeposited copper. Longer activation times (Figure 2C and D) favors the formation of copper, pyramidal crystals and the complete surface modification.
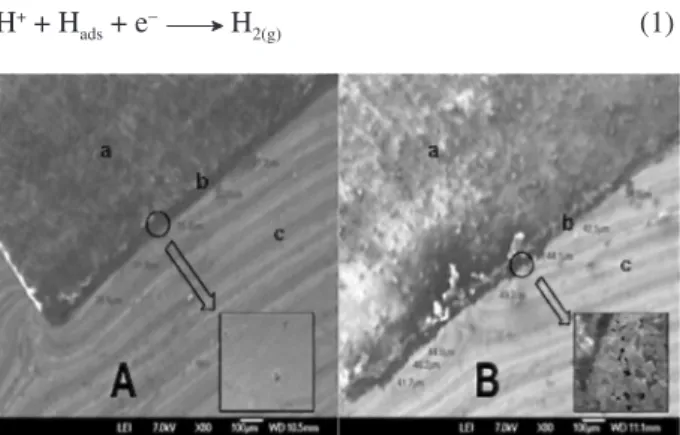
The influence of the activation procedure on the film thickness was evaluated by SEM by obtaining the images with a copper electrode placed in a vertical position. The bare unmodified copper layer presents a very smooth surface (Figure 3A), whereas a much rougher texture was obtained after the activation procedure and an increase of
Figure 1. AFM topographic images for a copper electrode obtained before (A) and after pre-treatment of the surface using the proposed potential protocol for 10 (B), 20 (C) and 30 s (D). Scan areas (25 × 25) µm2.
Morphology, Microstructure and Electrocatalytic Properties of Activated Copper Surfaces J. Braz. Chem. Soc.
122
ca. 10 µm in the film thickness was observed (Figure 3B).
This open pore structure is attributable to the presence of pyramidal crystals and the possible adsorption of hydrogen bubbles on the electrode surface, which can explain the formation of the voids seen in Figure 3B. The evolution of hydrogen depends on the solution pH and this has been reported in the literature11,12 to occur at negative potentials due to the interaction of H-atoms adsorbed in specific sites and diffusing protons, according to the following equation:
H+ + H
ads + e− H2(g) (1)
The images shown in Figures 1-3 reveal that the copper deposition process affects strongly the electrode surface morphology. In order to evaluate whether there is a correlation between surface morphology and the electrochemical response, mean roughness (RMS) values were determined for copper electrode surfaces after 10 s, 20 s and 30 s activation. Within the experimental error, RMS values presented no correlation with the activation time. This lack of correlation can be explained taking into account the RMS calculation, which considers the mean peak-to-valley distance and the deviations corresponding to all peak-to-valley distances measured for a given area. In this sense, RMS is a poor information about the surface because it is not regarded to the surface geometry. Hence, surfaces with different geometries might present similar peak-to-valley distances, yielding similar RMS values. Thus, RMS calculation is not a reliable tool to distinguish these surfaces (Table 1). On the other hand, calculations of surface fractal dimensions (FD) can also yield information about the surface roughness; for smooth surfaces FD = 2, whereas for extremely rough surfaces FD = 3. FD values were calculated as a function of activation time, using Gwyddion, a free software (www.gwyddion.net), and bilinear interpolation. As shown in Table 1, FD values increased with activation time up to 20 s and remained practically the same for 30 s.
The surface area was calculated by triangulation with the Gwyddion software and its dependence on the activation time is presented in Figure 4. Similarly to the dependence of FD on the activation time, there is an evident increase in the electrode surface area with increasing the activation time up to 20 s. The sigmoidal fit to the experimental data shows that for activation times longer than 20 s the surface area has already achieved a maximal magnitude or should increase modestly. The inset in Figure 4 shows the influence of the activation time towards nitrite sensing using a copper electrode. The electrochemical signal increases with the activation time up to 30 s, when the maximal current value seems to be achieved. This trend has also been noticed in a previous work.13 The increased surface area, accompanied by a favorable adsorption of reactant molecules and hydrogen, facilitates the cathodic reduction of nitrite. Both behaviors indicate that there is an optimal activation time to obtain copper cathodes with maximal surface area and improved electrochemical response. This is in agreement with previous scanning electrochemical microscopy (SECM) experiments, which indicated the enhancement of the electrochemical reactivity of copper cathodes monitored with methyl viologen upon the potential activation protocol.13
Conclusions
By using an established activation protocol based on oxidative and reductive steps, the surface area of copper
Figure 3. SEM images (secondary electron images) of a copper electrode obtained before (A) and after (B) pre-treatment of the surface for 30 s. a) Phenolic resin, b) copper layer and c) stub.
Table 1. Influence of activation time on RMS and FD values
Activation time / s RMS / nm FD
0 (249 ± 19) 2.47 ± 0.02
10 (384 ± 24) 2.49 ± 0.01
20 (360 ± 22) 2.60 ± 0.02
30 (280 ± 10) 2.57 ± 0.03
Figure 4. Dependence of surface area and current signal (inset) on the activation time. Current values were measured by differential pulse voltammetry in a 0.07 mmol L-1 NO
2
− + 0.1 mol L-1 Na
2SO4 solution
Gamboa et al. 123 Vol. 23, No. 1, 2012
electrodes can be greatly increased because of the rougher texture of the copper layer, generating very favorable platforms for cathodic reductions involving anions like nitrate and nitrite. A considerable increase in thickness (10 µm) was observed as a consequence of the formation of pyramidal crystals and probable adsorption of hydrogen bubbles on the structure. The rough texture produced by the electrochemical treatment is very similar to the one obtained by copper electrodeposition from solutions containing Cu(II), a procedure usually employed.7,8,14
However, the proposed activation protocol is advantageous as a plating solution is not required for the deposition of the catalytic layer and the surface can be easily renewed.
Acknowledgments
Authors are thankful to FAPESP (Fundação de Amparo à Pesquisa do Estado de São Paulo), CAPES (Coordenação de Aperfeiçoamento de Pessoal de Nível Superior) and CNPq (Conselho Nacional de Desenvolvimento Científico e Tecnológico) for the financial support.
References
1. Babu, T. G. S.; Ramachandran, T.; Bipin, N.; Microchim. Acta
2010, 169, 49.
2. Luo, M. Z.; Baldwin, R. P.; J. Electroanal. Chem.1995, 387, 87.
3. Paixão, T. R. L. C.; Corbo, D.; Bertotti, M.; Anal. Chim. Acta
2002, 472, 123.
4. Fogg, A. G.; Scullion, S. P.; Edmonds, T. E.; Birch, B. J.; Analyst
1991, 116, 573.
5. Shovon, S. M.; Terou, H.; Anal. Sci. 2010,26, 1173. 6. Corbo, D.; Bertotti, M.; Anal. Bioanal. Chem. 2002, 374, 476. 7. Davis, J.; Moorcroft, M. J.; Wilkins, S. J.; Compton, R. G.;
Cardosi, M. F.; Analyst2000, 125, 732.
8. Davis, J.; Moorcroft, M. J.; Wilkins, S. J.; Compton, R. G.; Cardosi, M. F.; Electroanalysis 2000, 12, 17.
9. Paixão, T. R. L. C.; Cardoso, J. L.; Bertotti, M.; Talanta2007,
186, 191.
10. Gamboa, J. C. M.; Peña, R. C.; Paixão, T. R. L. C.; Bertotti, M.;
Talanta 2009, 80, 58.
11. Simpson, B. K.; Johnson, D. C.; Electroanalysis2004,16, 532. 12. Wang, H. Y.; Huang, Y. G.; Tan, Z.; Hu, X. Y.; Anal. Chim. Acta
2004, 526, 13.
13. Gamboa, J. C. M.; Peña, R. C.; Paixão, T. R. L. C.; Lima, A. S.; Bertotti, M.; Electroanalysis 2010,22, 2627.
14. Carpenter, N. G.; Pletcher, D.; Anal. Chim. Acta1995, 317, 287.
Submitted: June 30, 2011 Published online: October 27, 2011