Article
Printed in Brazil - ©2018 Sociedade Brasileira de Química*e-mail: [email protected]
Development of a Novel and Simple Electroanalytical Procedure for the
Determination of Copper in Biofuel Employing a Sensor Based on Vulcan
Functionalized with Carbazone
TayaneA.Freitas,aManoelJ.A.Lima,aAldaléaL.B.Marques,bEdmarP.Marques,a
RitaC.S.LuzbandCiceroW.B.Bezerra*,a
aDepartamento de Química and bDepartamento de Tecnologia Química,
Universidade Federal do Maranhão, 65080-805 São Luís-MA, Brazil
A novel and simple electroanalytical method for the determination of Cu2+ in biodiesel
samples by stripping voltammetric analysis was developed. The method employs a carbon paste electrode (CPE) modified with Vulcan carbon, previouly functionalized with carbazone (CBZ). The CPE/Vulcan-CBZ sensor promoted a significant increase in the analytical signal obtained from copper as compared to unmodified CPE, and the CPE modified with Vulcan carbon (CPE/ Vulcan). Vulcan-CBZ, Vulcan and CBZ materials were characterized by Fourier transform infrared spectroscopy (FTIR) technique. The electrochemical behavior of the sensor was evaluated using cyclic voltammetry (CV) and square-wave anodic stripping voltammetric (SWASV) techniques. The CPE/Vulcan-CBZ modified electrode showed excellent response and was able to detect
Cu2+ at nanomolar levels. The electrochemical method is based on preconcentration of Cu2+ ions
on the CPE/Vulcan-CBZ at 0.35 V vs. Ag/AgCl(sat) in 0.2 mol L-1 ammonium sulfate solution
((NH4)2SO4), pH 3.5, during 120 s, followed by subsequent chemical stripping. The analytical signal
showed a linear response for Cu2+ concentrations in the range from 6 to 190 nmol L-1 (r = 0.998),
with a detection limit of 1.2 nmol L-1. The sensor was successfully applied for the determination
of Cu2+ in biodiesel and the average recovery varied between 97.0 and 102.8% for the soybean
biodiesel samples and between 109.6 and 111.0% for the babassu biodiesel samples showing a good accuracy for the proposed method.
Keywords: biofuel, copper, voltammetric sensor, Vulcan carbon, carbazone
Introduction
The pursuit of alternative fuels has been acquiring prominence in the last decades. The replacement of fossil fuels has been motivated by environmental, economical and social factors, since society itself depends on its use. In this context, one alternative that has stood out is the use of biofuels, such as charcoal, alcohol, biogas and biodiesel.1,2
Biodiesel is a renewable fuel produced either from vegetable sources (soybean, castor oil, palm oil, sunflower, among others) or from ethanol (from sugarcane) or
methanol (which can be obtained from wood biomass).3
It is, therefore, a biodegradable, sustainable and environmentally friendly fuel. However, some metals, such as Cu, Fe, and Ni, can be inserted in the production process with the catalysts, during transportation and storage. Furthermore, the presence of these metals, even
at trace levels, can promote the formation of gums and sediments that damage vehicle engines and promote the oxidation of biodiesel.4,5
Copper, iron and the effect of nickel on biodiesel’s stability has been widely evaluated. Among these metals, copper is the most powerful catalyst in biodiesel’s oxidation
process.5 Therefore, the monitoring of the amount of
copper is extremely important in this fuel for preventing undesirable variations in its physical state and properties, during its use or storage.5
In this context, it is opportune and necessary to develop novel sensitive and selective analytical methods for copper determination in biodiesel. Many studies have been conducted on the determination and monitoring
of metals in fuels, employing spectroanalytical6-11 and
electroanalytical12-17 techniques. The latter has been playing
In the electroanalytical methods, the main reaction occurs at the electrode-solution interface, on which, all the versatility, efficiency and performance of the analytical methodology depends. However, unfavorable situations may occur in which the interaction of electrode with the sample causes loss, low signal or irreproducible measurements.18 Thus, it is necessary to develop materials
that can act efficiently as electrode surfaces for the quantification of different species, with great selectivity, sensitivity and stability, similar to the case of metal ions.
Among the several types of carbon materials, the Vulcan XC-72R is mostly used as a support for fuel cells due to its high electrical conductivity, porous structure, large surface area and chemical reactivity.19,20 This material has oxygenated
surface groups that may be useful for the generation of thiosemicarbazones, which present important properties to form stable complexes with some metal cations.21-25
This work describes the synthesis and application of the Vulcan-cabarzone composite (Vulcan-CBZ) for the
determination of copper ions (Cu2+) in complex samples,
such as biodiesel, aiming to the development of a stable, sensitive and selective voltammetric sensor. Additionally, to the best of our knowledge, there is no report available that addresses the modification of Vulcan with tiosemicarbazide and its applications. The methodology was based on the use of a modified composite (Vulcan-CBZ) to increase the analytical signal, employing the square wave anodic redissolution (SWASV) technique for the analyte quantification.
Experimental
Reagents and solutions
For this research, all solutions were prepared using purified water (specific resistivity > 18.2 MΩ cm at 25 °C). The chemicals used were of analytical grade (Merck, Aldrich and Vetec), such as: HNO3, HCl, K3[Fe(CN)6],
KCl, (NH4)2SO4, KNO3, CH3COOH, CH3COONa, H3PO4,
K2HPO4, H2C2O4, Na2C2O4, H2SO4, NH4OH, C2H5OH,
CuSO4.5H2O, N3H5S (thiosemicarbazide, CB), graphite
powder and mineral oil. The standard metal solutions (Cu2+,
Pb2+, Co2+, Cd2+ and Zn2+) were prepared from a stock solution
of 1000 mg L-1 (Titrisol, Merck). The Vulcan XC-72R came
from Cabot Corporation. The vegetable oils used (babassu and soybean) were purchased from a local market.
Equipment and accessories
In this research, Fourier transform infrared (FTIR) spectra were obtained using a Shimadzu IR spectrophotometer,
model Prestige-21, in the region between 4000-400 cm-1
with the ATR (attenuated total reflectance) accessory, employing 1% KBr pellets. The pH measurements were performed using a Quimis digital pH meter, model Q400A. The electrochemical measurements were performed with an Autolab voltammetric analyzer (Metrohm), model PGSTAT 302, coupled with an Intel Celeron D computer with a GPES software.
The electrochemical measurements were carried out in a three-electrode system composed of a carbon paste electrode (CPE) as working electrode, Pt wire as counter electrode, and Ag/AgCl (saturated) as reference electrode. The measurements were carried out using 10 mL of the supporting electrolyte. The working electrode was a CPE modified with Vulcan-CBZ with electroactive area of the electrode of ca. 0.265 cm2, estimated according to
Randles-Sevcik equation.17 Additional equipment employed was a
LAB 1000 centrifuge, model DM0412, and an ultrasound Quimis, model Q 335 D.
Synthesis of the composite Vulcan-carbazone (Vulcan-CBZ)
Vulcan-CBZ composite was prepared based on the condensation reaction of thiosemicarbazide (CB) and carbonyl groups at the Vulcan support. About 500 mg of
Vulcan XC-72R were oxidized by HNO3 (1.0 mol L-1,
50 mL) under reflux condition for 3 h. Consequently, the obtained product was filtered and successively washed with water until pH remained ca. 6. It was then oven-dried at 70 °C. The anchoring of CB in the funtionalized Vulcan was performed by the reaction between the previously oxidized support (100 mg, corresponding to 0.5970 mmol of the surface acid groups) and the CB (163 mg, 1.791 mmol), in slightly acidified ethanolic medium (HCl), having kept under reflux conditions for 2 h. The synthesized material, designated as Vulcan-carbazone (Vulcan-CBZ), was oven-dried at 50 °C and kept under vacuum atmosphere.
Preparation of the working electrode and electrochemical measurements
The working electrode body was constructed by pressing a copper rod inside of a pipette tip and leaving a hole at the surface for packaging the carbon paste, which was prepared by thoroughly mixing graphite powder, Vulcan-CBZ and mineral oil, in a mortar with pestle. The working electrode was smoothed later on, using a clean paper (A4) until it revealed a shiny appearance.
variables studied were: (i) carbon paste composition: 25% (m/m) mineral oil, 2.5 to 15.0% (m/m) of Vulcan-CBZ and 72.5 to 60% of graphite; (ii) supporting electrolyte: 0.1 mol L-1
(NH4)2SO4, KNO3, CH3COONa/CH3COOH, H3PO4/K2HPO4
and H2C2O4/Na2C2O4; (iii) supporting electrolyte
concentration: 0.05 to 0.2 mol L-1 and (iv) pH range: 2.5 to
7.0. The modification of the CPE with CB was made only by mixing 5% CB with 70% grafite and 25% nujol oil. In addition, the following SWASV operational parameters were studied: deposition potential (Edep), deposition time (tdep) and
frequency (f).
Sample preparation and analysis
In this work, biodiesel samples were obtained via methylic route, and soybean (A) and babassu (B) oils were used as vegetable oil sources. Moreover, samples were prepared according to the procedure described by Freitas et al.,26 with minor modifications. A total of 0.2 mL
of biodiesel samples were treated with 1.9 mL of HCl 37%
(m/v) and 1.9 mL of 30% H2O2 (m/v); under ultrasonic
conditions for 30 min. Then the samples were centrifuged for 10 min at 2000 rpm, from which an aliquot of 0.2 mL of the supernatant was withdrawn and added to the supporting electrolyte.
Results and Discussion
Characterization of materials
The FTIR spectra of the Vulcan, Vulcan-carbazone (Vulcan-CBZ) and the thiosemicarbazine in its free-form (CB) are shown in Figure S1 (Supplementary Information (SI) section). The Vulcan material (Figure S1a) shows a broad peak in the range of 3500-3200 cm-1 which corresponds to the
vibration of stretching and bending of OH groups. There is a little contribution of: (i) symmetrical and anti-symmetrical CH2 stretching vibrations in the 2900-2800 cm-1 region; and
(ii) the peak at 1714 cm-1 resulting from the stretching of the
carbonyl bond of the COOH group.27 Also, in the medium
frequency region, there is a broad band in the range of 1665-1500 cm-1 due to the contribution of the angular deformation
of the OH group conjugated with the CO stretch. Finally, the peaks at 1352 and 1230 cm-1 correspond to the C–C and
C–OH stretching vibration of carboxylic groups.27
Relating to Vulcan-CBZ spectrum (Figure S1b) the presence of characteristic stretches of thiosemicarbazide functional groups can be clearly observed (Figure S1c):22,28,29
υ(C=S) 840-730 cm-1, υ(N–N) 1037-840 cm-1 and υ(N–H)
3368-3175 cm-1. It is also noted that the peak assigned to
N–H centered at 3363 cm-1 underwent a slight change. A
peak between 1562-1546 cm-1 is further observed which
corresponds to the absorption of the C=N bond, and the bond between support (Vulcan) and ligand (CB). It indicates that the Vulcan-CBZ composite was formed, as suggested by the following schematic condensation reaction (equation 1):
Vulcan(C=O) + H2NNHC(=S)NH2→
Vulcan(C=NNHC(=S)NH2) + H2O (1)
Electrochemical behavior of Vulcan-CBZ in the presence of Cu2+
In order to evaluate the viability of the Vulcan-CBZ which acts as an electrochemical sensor for the determination of Cu2+ ions, preliminary records of SWASV
were carried out at different ion concentration of Cu2+, in the
presence of unmodified carbon paste electrode (unmodified CPE); the carbon paste electrodes modified with Vulcan (CPE/Vulcan); and Vulcan-carbazone (CPE/Vulcan-CBZ) (Figure 1). The initially established experimental conditions were as following: 0.1 mol L-1 (NH
4)2SO4 as electrolyte, pH
3.5, carbon-paste composition of graphite powder (70%), modifier (5%) and mineral oil (25%).
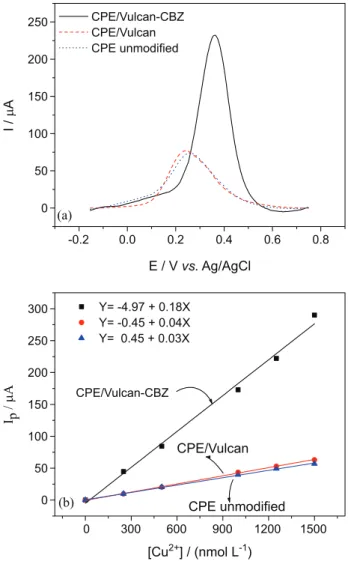
As observed from Figure 1a, higher analytical signal was achieved by using Vulcan-CBZ (black solid line). In fact, this electrode increased the electroanalytical response by five times when compared to the other tested electrodes, indicating that it played an important role in the electrochemical detection of Cu2+. It can be explained
due to the presence of donor atoms (S and N) on the composite surface, which allow the formation of the metal ion complexes. Indeed, thiosemicarbazones are able to form stable complexes with some metallic cations, such as zinc, copper and iron.21,22
The analytical curves obtained (Figure 1b) showed a good linear range for all electrodes. However, special sensitivity was reached while using CPE/Vulcan-CBZ
(0.18 µA nmol-1 L) in comparison to CPE/Vulcan
(0.04 µA nmol-1 L) and unmodified CPE (0.03 µA nmol-1 L).
Additionally, considering the coordination capacity of the CB ligand, construction of an analytical curve with only CPE/CB was attempted. It was observed that the electrode did not provide a linear response in the determination of
Cu2+ ions in the concentration range studied (data not
Influence of scan rate
In this work, the cyclic voltammetry of Cu2+ in
0.1 mol L-1 (NH
4)2SO4, pH 3.5, was investigated at
CPE/Vulcan-CBZ electrode within the potential window of –0.75 to 0.75 V and recorded at different scan rates (Figure 2a). The carbon-paste composition was: 70% graphite powder, 5% Vulcan-CBZ and 25% mineral oil. An anodic sweep with an initial potential of –0.75V shows one oxidation peak at 0.29 V, followed by two reduction peaks at 0.01 and –0.36 V in the reverse sweep. The appearance of two reduction peaks can be associated with the presence of more than one coordination site on the electrode for Cu2+.30
The influence of scan rate on the oxidation of copper was evaluated from 10 to 100 mV s-1. It can be found that
both cathodic and anodic peak current goes higher with the increase of scan rate. It is further observed that both peak positions are slightly shifted towards the negative potential (cathodic peak) and positive direction (anodic peak) (Figure 2a). In addition to dependence of peak current with scan rate, the ratio ipa/ipc (ipa and ipc are the anodic and
Figure1. (a) Electrode response: CPE/Vulcan-CBZ (black solid voltammogram); CPE/Vulcan (red dashed voltammogram) and unmodified CPE (blue dotted voltammogram) to 1.0 µmol L-1 of Cu2+; (b) calibration
curves obtained with materials used in (a) (CPE/Vulcan-CBZ, CPE/Vulcan, unmodified CPE) at different concentrations of Cu2+: 250;
500; 750; 1000; 1250 and 1500 nmol L-1. Experiments were performed
with the SWASV technique in the following experimental conditions: Edep = –0.5 V, tdep = 105 s, f = 60 Hz and Ap = 0.025 V.
Figure2. (a) Cyclic voltammograms recorded at scan rates between 10 and 100 mV s-1. Relation between (b) anodic peak current (I
p) versus v1/2
and (c) log anodic peak current (Ip) versus log v (scan rate). Experiments
were carried in 0.1 mol L-1 (NH
cathodic peak current, respectively) is greater than unity, suggesting a non-reversible process.
The experimental results indicate that there is a linear variation of peak currents with square root of scan rate (Ip (µA) = 22.3 + 18.8v1/2, r = 0.988), suggesting that the
process is diffusion controlled (Figure 2b). Furthermore,
the plot of log peak current vs. log scan rate showed
a straight line (Figure 2c), its slope value is below 0.5 (log Ip = –3.3 + 0.39log v, r = 0.986) which confirms
that the overall reaction is controlled by a diffusional process.31,32
Optimization of the experimental and operational conditions of the SWASV technique
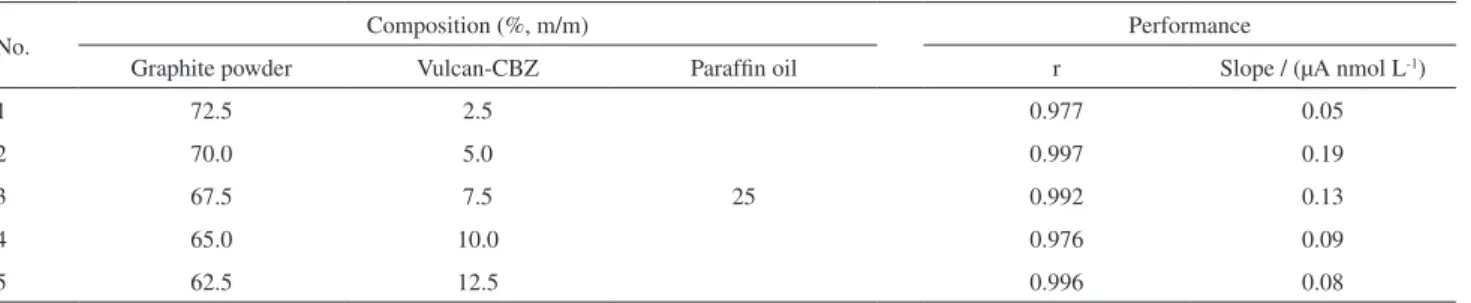
In order to verify the effect of the carbon paste composition in the voltammetric response of the electrodes, analytical curves were constructed by SWASV using the following composition of Vulcan-CBZ:graphite powder (% m/m): 2.5:72.5; 5:70; 7.5:67.5; 10:65; 12.5:62.5; 15:60, and 25% m/m of mineral oil, on electrodes. Table 1 summarizes the analytical figure of merits obtained for each curve. The anodic peak current increased up to 5% (m/m) with the amount of Vulcan-CBZ in the paste, and decreased when more modifier is used in the electrode preparation. This electrode provided better results regarding to some of the analytical parameters, such as the linear correlation coefficient and sensitivity, and was employed in the subsequent studies.
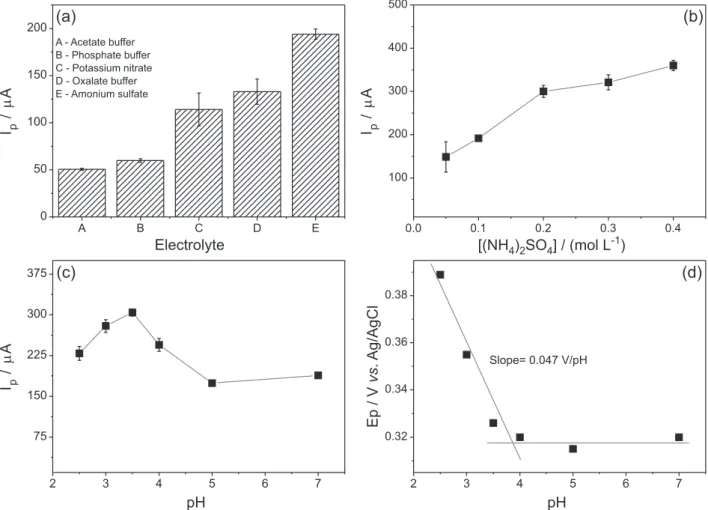
Also to assess the best sensor response, another evaluated parameter was the nature of the supporting electrolyte. The electrolytic solutions studied were ammonium sulfate, potassium nitrate, phosphate buffer, acetate buffer and oxalate buffer, all in the concentration of 0.1 mol L-1 (pH 3.5), containing 1.0 µmol L-1 of copper in the
electrochemical cell. The most defined peaks and maximum anodic currents were found when the (NH4)2SO4 solution
was used, followed by the solutions of KNO3, oxalate
buffer, phosphate buffer and acetate buffer (Figure 3a),
showing that there is a significant contribution of the ionic species from the solution, in the electrodeposition
of Cu2+ on the electrode surface. Thus, the ammonium
sulfate solution was chosen as the supporting electrolyte. Regarding the concentration of solution (Figure 3b), the increase in current variation occurred in the range of 0.05 to 0.4 mol L-1. This fact was expected, since the conductivity
of the solution increases with the concentration of the
electrolyte.33 However, at the concentration between 0.2
and 0.4 mol L-1, no significant variation in the analytical
signal was observed. Thus, the 0.2 mol L-1 concentration
of this electrolyte was chosen for the subsequent analysis. The effect of pH has also been investigated in the range of 2.5 to 7.0 (Figure 3c). The pH of the solution directly affected the voltammetric response of copper over the CPE/Vulcan-CBZ. A pronounced increase of the peak current in the pH range of 2.5 and 3.5 is observed along with a decrease of peak current between 3.5 and 5.0. According to literature,34 this result can be justified
by the fact that the Cu2+ ions undergo partial or total
hydrolysis at pH higher than 3.5, decreasing the free Cu2+
concentration, and subsequently decreasing the interaction with the electrode. Another suggestion is that, the decrease of the peak currents above pH 3.5 occurs due to lower stability of the Vulcan-CBZ material in pH values above 3.5, which makes it difficult the interaction between the
Cu2+ ions and the electrode surface (CPE/Vulcan-CBZ).
Based on these results, pH 3.5 was chosen to perform the other analysis.
Additionally, the effect of pH on the redox potential
of Cu2+ was also evaluated using CPE/Vulcan-CBZ. The
experimental results indicate that pH has a significant influence on copper peak potential values. According
to Figure 3d, the peak potential (Ep) of the copper ions
shifted to more negative potentials, with an increase in the pH value from 2.5 to 4.0. The Ep values changed linearly
with changes in the pH values, showing an inclination of –0.047 V pH-1. This inclination is close to that expected for
an electrode reaction involving 2 protons and 2 electrons
Table1. Optimization of the carbon paste ingredients. Analytical curves obtained by SWASV with the following concentrations of Cu2+: 0.25; 0.5; 0.75;
1.0; 1.25 and 1.5 µmol L-1. E
dep = –0.5 V, tdep = 105 s, f = 60 Hz and Ap = 0.025 V
No. Composition (%, m/m) Performance
Graphite powder Vulcan-CBZ Paraffin oil r Slope / (µA nmol L-1)
1 72.5 2.5 0.977 0.05
2 70.0 5.0 0.997 0.19
3 67.5 7.5 25 0.992 0.13
4 65.0 10.0 0.976 0.09
5 62.5 12.5 0.996 0.08
(0.059 V pH-1 at 25 °C). Thus, Cu2+ ions are accumulated
on the electrode as a complex, since bonding takes place between the metal ions and CBZ ligand. Hereafter, this complex is reduced to generate Cu0 and a free CBZ ligand
(Cu2+-Vulcan-CBZ + 2H+ + 2e- ⇄ Cu0 + Vulcan-CBZ).
Subsequently, the Cu0 is reoxidized to Cu2+, and it is at this
redissolution stage that the final determination is as following: Cu0 + Vulcan-CBZ ⇄ Cu2+-Vulcan-CBZ + 2H+ + 2e-.
The operational parameters of the SWASV technique: deposition potential (Edep), deposition time (tdep) and
frequency (f), were also studied, setting the amplitude (Ap)
at 0.025 V and the equilibrium time (teq) as 15 s. Figure 4
shows the influence of these parameters on the analytical signal of copper. According to the obtained results, it is observed that the highest peak currents for the analyte were reached under the following conditions: Edep = –0.5 V;
tdep = 120 s; f = 60 Hz; Ap = 0.025 V. Therefore, such
conditions were used for the construction of the analytical curve for copper. The experiments were conducted in the presence of 150 nmol L-1 of Cu2+ ions in 0.2 mol L-1 of
(NH4)2SO4, pH 3.5.
Analytical characterization of the sensor
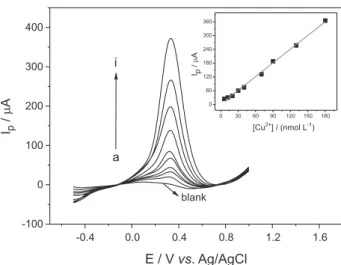
Figure 5 is the analytical curve for the determination of Cu2+ ions in the biodiesel samples under optimized conditions.
A linear range from 6 to 190 nmol L-1 is observed, with the
following equation: Ip (µA) = 1.1 + 2.0[Cu2+] (nmol L-1),
(r = 0.998, n = 9). The limit of detection (LOD) and quantification (LOQ) were estimated as 1.2 and
4 nmol L-1, respectively. These values were calculated,
using the following equations: LOD = (3 × SD)/b and LOQ = (10 × SD)/b, where SD is the standard deviation taken for ten measures of the blank (0.80 × 10⁻⁶) and b is
the value for the angular coefficient of the analytical curve.
Study of the sensor selectivity
The influence of possible interferents, such as Pb2+,
Co2+, Cd2+ and Zn2+ was also investigated by SWASV,
in the optimized experimental conditions. In this sense,
five analytical curves for Cu2+ were obtained at the
concentration range of 6 to 30 nmol L-1 in the absence
Figure3. Effect of the: (a) nature of the supporting electrolyte (0.1 mol L-1, pH 3.5); (b) supporting electrolyte concentration (0.05, 0.1, 0.2, 0.3 and
0.4 mol L-1 (pH 3.5); (c) and (d) pH of the electrolytic solution on the voltammetric Cu2+ response. Experimental conditions: [Cu2+] = 1.0 µmol L-1.
(Figure 6, curve a) and presence of the interferents (Figure 6, curves b, c, d, and e). Based on these results, it was observed that the sensitivity of the Vulcan-CBZ-based sensor for the copper ions in absence and presence of foreign ions were similar, confirming the good interaction of the modified electrode with the analyte
of interest (Cu2+). Moreover, although there is a small
variation of the sensitivity for the determination of the copper, the shift of the sensitivity for determination of the analyte of interest in presence of foreign species was lower than 7% when compared to sensitivity of the sensor for the determination of the analyte in the absence of each interfering species. These results suggest that these ions do not significantly interfere in the determination of copper. Furthermore, it is also important to emphasize that the standard addition method is a very reliable way to minimize the effect of the analyzed matrix. Finally, it can be said that the proposed sensor presents, besides a great sensitivity, an excellent selectivity for the developed system.
Figure 5. SW anodic redissolution voltammograms for various concentration of Cu2+: (a) 6; (b) 12; (c) 20; (d) 30; (e) 40; (f) 70; (g) 90;
(h) 130.0; and (i) 190 nmol L-1. Insert: analytical curve for copper.
Experiments conducted in 0.2 mol L-1 solution (NH
4)2SO4, pH 3.5.
Edep = –0.5 V; tdep = 120 s; f = 60 Hz; Ap = 0.025 V and teq = 15 s.
Figure4. Optimization of the analytical SWASV parameters for Cu2+ ion
(150 nmol L-1) determination: (a) E
dep using a tdep = 105 s, Ap = 0.025 V
and f = 60 Hz, and (b) tdep using an Edep = –0.5 V; and (c) frequency with
Edep = –0.5 V, tdep = 120 s.
Figure6. Analytical curves for copper ions in absence (a) and presence of possible interferents (b, c, d, and e). Experiments conducted in 0.2 mol L-1 of (NH
4)2SO4 solution, pH 3.5. [foreign specie] = 0.1 µmol L-1.
Edep = –0.5 V; tdep = 120 s; f = 60 Hz; Ap = 0.025 V and teq = 15 s; potential
Application of the sensor in fuel samples
The CPE/Vulcan-CBZ sensor was applied for the
determination of Cu2+ in biodiesel samples, using the
two-level recovery study, as shown in Table 2, and the voltammograms of the analyzes of the fortified biodiesel samples and their respective standard addition curve are shown in Figures S2 and S3 (in the SI section). The average recovery varied between 97.0 and 102.8% for the soybean biodiesel samples and between 109.6 and 111.0% for the babassu biodiesel samples, confirming the applicability of the proposed electrode for biodiesel samples.
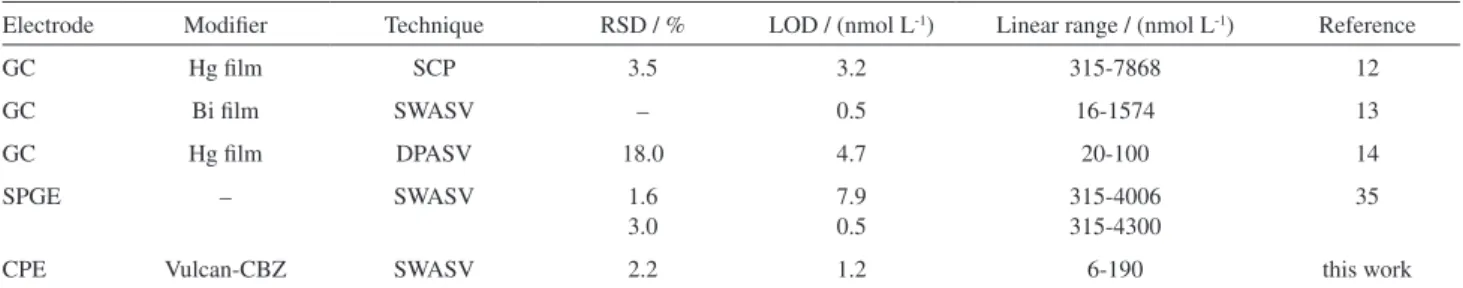
Table 3 presents the comparison of the proposed method with the literature data for determination of copper ions in biodiesel. It can be observed that CPE/Vulcan-CBZ presented one of the lowest detection limits, a wide linear range and a good relative standard deviation (RSD) compared to the other reported work,11,14,35 indicating that
this method is an excellent alternative for the quantification of copper in fuel samples.
Conclusions
The proposed electrochemical sensor provided high sensitivity, good linearity, optimum oxidation peak definition, high reproducibility and low limits of detection and quantification, due to its chelate forming ability and high affinity of the Vulcan-CBZ material for copper ions. Although the sensor shows response to other metallic species, it can be observed that these do not significantly Table2. Summary of results for copper fortification in biodiesel samples (n = 3)
Sample [Cu2+] added / (nmol L-1) [Cu2+] recovered / (nmol L-1) Recovery / %
A1 10.0 9.7 ± 0.1 97.0 ± 1.4
A2 25.0 25.7 ± 1.2 102.8 ± 5.1
B1 10.0 11.1 ± 0.2 111.0 ± 2.6
B2 25.0 27.4 ± 0.6 109.6 ± 2.6
A: soybean biodiesel; B: babassu biodiesel.
Table3. Comparison of different modified electrodes for copper determination in biodiesel matrices
Electrode Modifier Technique RSD / % LOD / (nmol L-1) Linear range / (nmol L-1) Reference
GC Hg film SCP 3.5 3.2 315-7868 12
GC Bi film SWASV – 0.5 16-1574 13
GC Hg film DPASV 18.0 4.7 20-100 14
SPGE – SWASV 1.6
3.0
7.9 0.5
315-4006 315-4300
35
CPE Vulcan-CBZ SWASV 2.2 1.2 6-190 this work
GC: glassy-carbon; SPGE: screen-printed gold electrode; CPE: carbon paste electrode; SCP: stripping chronopotentiometry; DPASV: differential pulse anodic stripping voltammetry; SWASV: square wave anodic stripping voltammetry.
interfere in the copper response. The application of this electrode in biodiesel samples, showed good accuracy verified by the recovery studies. The easy preparation of the sample and the low cost appear as advantages to the existing procedures. In addition, the method proved to be simple, fast and inexpensive for implementation, compared to procedures presented in the literature, indicating that this sensor can be used as a viable alternative for determination of trace amounts of Cu2+ in fuel samples.
Supplementary Information
Supplementary information is available free of charge at http://jbcs.sbq.org.br as a PDF file.
Acknowledgments
The authors are grateful to Brazilian agencies CNPq, Capes and FAPEMA for fellowships and financial support.
References
1. Demirbas, A.; Energy Convers. Manage.2008, 49, 2106. 2. Guo, D.; Pan, H.; Li, X.; Appl. Microbiol. Biotechnol.2015,
18, 7805.
3. Milano, J.; Ong, H. C.; Masjuki, H. H.; Chong, W. T.; Lam, M. K.; Loh, P. K.; Vellayan, V.; Renewable Sustainable Energy Rev.2016, 58, 180.
5. Knothe, G.; Dunn, R. O.; J. Am. Oil Chem. Soc.2003, 80, 1021. 6. Antunes, G. A.; dos Santos, H. S.; da Silva, Y. P.; Silva, M. M.; Piatnicki, C. M. S.; Samios, D.; Energy Fuels2017, 31, 2944. 7. Lima, A. S. S.; Rodrigues, S. M.; Korn, M. G. A.; Ribeiro, D.
S. M.; Santos, J. L. M.; Teixeira, L. S. G.; Microchem. J.2014, 117, 144.
8. Behbahani, M.; Akbari, A. A.; Amini, M. M.; Bagheri, A.; Anal. Methods2014, 6, 8785.
9. Ghisi, M.; Chaves, E. S.; Quadros, D. P. C.; Marques, E. P.; Curtius, A. J.; Marques, A. L. B.; Microchem. J.2011, 98, 62. 10. Lobo, F. A.; Goveia, D.; de Oliveira, A. P.; Pereira-Filho, E. R.;
Fraceto, L. F.; Dias Filho, N. L.; Rosa, A. H.; Fuel2009, 88, 1907.
11. Sanchez, R.; Sánchez, C.; Lienemann, C.-P.; Todolí, J.-L.; J. Anal. At. Spectrom.2015, 30, 64.
12. Almeida, E. S.; Monteiro, M. A. N. A.; Montes, R. H. O.; Mosquetta, R.; Coelho, N. M. M.; Richter, E. M.; Muñoz, R. A. A.; Electroanalysis2010, 22, 1846.
13. Pinto, L.; Lemos, S. G.; Microchem. J.2013, 110, 417. 14. Martiniano, L. C.; Abrantes, V. R.; Yotsumoto Neto, S.;
Marques, E. P.; Fonseca, T. C. O.; Paim, L. L.; Souza, A. G.; Stradiotto, N. R.; Aucélio, R. Q.; Cavalcante, G. H. R.; Marques, A. L. B.; Fuel2013, 103, 1164.
15. Yotsumoto Neto, S.; Viegas, H. D. C.; Almeida, J. M. S.; Cavalheiro, E. T. G.; Araújo, A. S.; Marques, E. P.; Marques, A. L. B.; Electroanalysis2015, 27, 1.
16. Tormin, T. F.; Narciso, L. C. D.; Richter, E. M.; Munoz, R. A. A.; Fuel2014, 117, 952.
17. Almeida, E. S.; Richter, E. M.; Munoz, R. A. A.; Anal. Chim. Acta.2014, 837, 38.
18. Lowinsohn, D.; Bertotti, M.; Quim. Nova2006, 29, 1318. 19. Dipti, S. S.; Chung, I.-C.; Chung, W. S.; Met. Mater. Int.2007,
13, 417.
20. Bezerra, C. W. B.; Zhang, L.; Liu, H.; Lee, K.; Marques, A. L. B.; Marques, E. P.; Wang, H.; Zhang, J.; J. Power Sources2007, 173, 891.
21. Tenório, R. P.; Góes, A. J. S.; de Lima, J. G.; de Faria, A. R.; Alves, A. J.; de Aquino, T. M.; Quim. Nova 2005, 28, 1030. 22. Sousa-Pereira, D.; Goulart, C. M.; dos Reis, C. M.; Echevarria,
A.; Rev. Virtual Quim.2013, 5, 770.
23. Afkhami, A.; Bagheri, H.; Khoshsafar, H.; Saber-Tehranic, M.; Tabatabaeed, M.; Shirzadmehra, A.; Anal. Chim. Acta2012, 746, 98.
24. Afkhami, A.; Ghaedi, H.; Madrakian, T.; Rezaeivala, M.; Electrochim. Acta2013, 89, 377.
25. Afkhami, A.; Soltani-Felehgari, F.; Madrakian, T.; Ghaedi, H.; Rezaeivala, M.; Anal. Chim. Acta2013, 771, 21.
26. Freitas, H. C.; Almeida, E. S.; Tormin, T. F.; Richter, E. M.; Munoz, R. A. A.; Anal. Methods2015, 7, 7170.
27. O’Reilly, J. M.; Mosher, R. A.; Carbon1983, 21, 47. 28. Silverstein, R. M.; Webster, F. X.; Kiemle, D. J.; Identificação
Espectrométrica de Compostos Orgânicos; LTC: Rio de Janeiro, 2006.
29. Pandian, G. D.; Anbusrinivasan, P.; Mojumdar, S. C.; J. Therm. Anal. Calorim.2015, 119, 845.
30. Manzanera-Estrada, M.; Ayala, L. F. H.; Osorio-Monreal, G.; García-Ramos, J. C.; Ortiz-Frade, L.; J. Mex. Chem. Soc.2013, 57, 192.
31. Duarte, E. H.; Gorla, F. A.; Sartori, E. R.; Tarley, C. R. T.; Quim. Nova 2014, 37, 1496.
32. Gowda, J. I.; Nandibewoor, S. T.; Asian J. Pharm. Sci.2014, 9, 42.
33. Agostinho, S. M. L.; Villamil, R. F. V.; Quim. Nova2004, 27, 813.
34. Janegitz, B. C.; Marcolino Junior, L. H.; Fatibello-Filho, O.; Quim. Nova2007, 30, 1673.
35. Tormin, T. F.; Oliveira, G. K. F.; Richter, E. M.; Munoz, R. A. A.; Electroanalysis2016, 28, 940.
Submitted: July 21, 2017
Published online: October 10, 2017