Article
0103 - 5053 $6.00+0.00
*e-mail: [email protected], [email protected]
#Present address: Department of Chemistry, Islamic Azad University, Fars
Science and Research Branch, P. O. Box: 73715-181, Marvdasht, Iran
Electrooxidation and Determination of Etidronate using Copper Nanoparticles
and Microparticles-modiied Carbon Paste Electrodes
H. Heli,*,a,b,# F. Faramarzi,c A. Jabbari,c A. Parsaeid and A. A. Moosavi-Movahedia
aInstitute of Biochemistry and Biophysics, University of Tehran, Tehran, Iran
bDepartment of Chemistry, Razi University, Kermanshah, Iran
cDepartment of Chemistry, K. N. Toosi University of Technology, Tehran, Iran
dSobhan Oncology Co., Tehran, Iran
O comportamento eletroquímico e a determinação de um bisfosfonato, o etidronato de sódio, em três diferentes eletrodos de cobre: eletrodo de cobre policristalino (CE) e eletrodos de pasta de carbono modiicados com micropartículas de cobre (m-CPE) e nanopartículas de cobre (n-CPE) foi investigado. Usando o eletrodo CE, os voltamogramas apresentaram um pico de corrente anódica, enquanto com m-CPE e n-CPE, foram observados dois picos de corrente de oxidação. A densidade de corrente anódica em 610 mV para n-CPE é cinco vezes maior do que para m-CPE. Isto está relacionado ao efeito do tamanho das nanopartículas de cobre. As correntes anódicas foram relacionadas à oxidação eletrocatalítica do etidronato
via eletrogeração de espécies ativas de Cu(III) em um mecanismo EC’. Os valores para a constante de velocidade catalítica para o processo de oxidação e o coeiciente de difusão do etidronato foram 8,9 × 103 cm3 mol-1 s-1 e 1,55 × 10⁻⁶ cm2 s-1, respectivamente. Um procedimento
sensível e rápido foi desenvolvido para a análise de etidronato, e os parâmetros analíticos correspondentes foram relatados. O etidronato foi determinado com um intervalo linear de 10,57 µmol L-1 e um limite de detecção de 200-2538 µmol L-1. A exatitude foi
checada pela aplicação do teste de recuperação nas amostras. O método amperométrico proposto foi aplicado à análise de comprimidos farmacêuticos comerciais e os resultados apresentaram concordância com os valores de literatura.
The electrochemical behavior and determination of a bisphosphonate drug, sodium etidronate, on three different copper-based electrodes: polycrystalline copper electrode (CE) and copper microparticles- (m-CPE) and copper nanoparticles (n-CPE)-modiied carbon paste electrodes was investigated. In the voltammograms recorded using CE, one anodic peak was appeared while, both m-CPE and n-CPE represented two anodic oxidation peaks. The anodic current density at 610 mV for n-CPE is >5 times higher that of m-CPE. This was related to the nanosize effect of copper nanoparticles. The anodic currents were related to the electrocatalytic oxidation of etidronate via the electrogenerated active species of Cu(III) in an EC’ mechanism. The catalytic rate constant for the oxidation process and the diffusion coeficient of etidronate were obtained as 8.9×103 cm3 mol-1 s-1 and 1.55×10⁻⁶ cm2 s-1, respectively. A sensitive and time-saving sensing
procedure was developed for the analysis of etidronate, and the corresponding analytical parameters were reported. Etidronate was determined with a limit of detection of 10.57 µmol L-1 with a linear
range of 200-2538 µmol L-1. Accuracy was also checked by recovery test on spiked samples. The
proposed amperometric method was applied to the analysis of commercial pharmaceutical tablets and the results were in good agreement with the declared values.
Introduction
Bisphosphonates are potent inhibitors of bone resorption. They have been commonly used for treatment of cancer hypercalcemia and metastatic bone diseases such as osteoporosis and Paget’s disease. Recent results indicate their potential application for prevention and treatment of cancer-induced bone loss and bone pain.1-3
Etidronate ((1-hydroxyethylidene) bisphosphonate, (1-hydroxy-1-phosphono-ethyl)phosphonic acid, Scheme 1), the irst compound used in clinical practice, is belong to the non-N-containing bisphosphonate family.1,2
It is also used to prevent an unusual condition called heterotopic ossiication.
The determination of etidronate is not simple since this compound lacks natural chromophore or luorephore for photometric and lurometric detections. Determination of etidronate can performed by ion chromatography directly using methods such as evaporative light-scattering detection and conductivity detection or after conversion into a detectable compound through derivatization protocols.4 The disadvantages of these methods are that
they are not simple enough for the routine analysis, and require sophisticated or expensive instruments. Also, derivatization procedure is time consuming and sometimes the resulting derivatives are not stable enough for complete analysis. The latest edition of British Pharmacopoeia monograph describes a liquid chromatography method with differential refractometer detection for the assay of etidronate sodium.5 The latest edition of United
States Pharmacopoeia monograph describes a liquid chromatography method equipped with a conductivity detector for the assay of the drug.6
The redox properties of drugs that can give insight into its metabolic fate can be studied by electrochemical techniques. The obtained data from electrochemical techniques are often correlated with molecular structures and pharmacological activities of drugs. In addition, the electrochemistry route is valuable in elucidating some mechanisms of the drug action in vivo.7,8 Moreover,
electrochemical techniques have a well-defined role in drug analysis and various electroanalytical methods have been developed for the electroanalysis of drugs. These methods represent quick response, high sensitivity,
abilities to miniaturization and analysis of drugs even in samples containing complex matrix. Most favorable property for modern electroanalytical methods is that excipients do not interfere. Hence, sample can be prepared simply by dissolution of pharmaceutical ingredient in suitable solvent.
Nanomaterials can exhibit unique properties differ deeply from the corresponding bulk scale due to their limited size and a high density of corner or edge surface sites; they can adopt geometries not seen in the bulk state. Also, in the case of metal oxides, there could be important variations in the oxygen/metal ratio. Oxygen vacancies which are not common in the bulk state can be present in the nanoparticles. These vacant sites can enhance the reactivity of nanostructured metal oxides. In the other extreme, a nanoparticle could have an oxygen/ metal ratio larger than observed for bulk oxides of a given metal.9 Nanostructured materials have recently
attracted application in the study of electrochemistry of drugs and biologically active compounds and development of electroanalytical methods for analysis of drugs.10-16 Different types of nanostructured materials
including nanotubes of carbon,14,15 nanoparticles10-13 and
nanowires16 have been employed in electrochemical
analysis of drugs.
Design of new chemically modified electrodes (CMEs) has been interested in recent years and widely employed for the sensitive and selective analytical tools for the detection and determination of the biologically active compounds.11-15,17-20 One of the most important
components of CMEs, the catalyst, is able to catalyze the electrode process via significant decreasing of overpotential and/or increasing the current, with respect to the unmodiied electrode. The catalyst component of a CME which can be various organic and inorganic compounds, conducting polymers, metals, etc. is usually immobilized in the body or onto the surface of electrodes. Nanostructured materials as the catalyst can incorporate very interesting properties to CMEs from both points of view of mechanistic investigations and analysis procedures.10-15
Continuing our recent studies on the electrocatalytic oxidation and determination of some drugs and biologically important compounds using CMEs,10-15, 17-21 in the study
described here, we investigated the electrooxidation and determination of sodium etidronate in bulk as well as pharmaceutical forms on a carbon paste electrode modiied with copper nanoparticles. The electrochemistry of etidronate has never attended and this work is a study on electrochemistry and electrochemical determination of this bisphosphonate drug.
Experimental
Materials
Sodium etidronate was received as a gift from Modava Co. Ltd., Tehran, Iran. The etidronate tablets were obtained from a local drugstore. All chemicals including copper microparticles with the diameter of < 63 µm were obtained from Merck or Aldrich. All solutions were prepared with doubly distilled water.
Apparatus
Electrochemical measurements were carried out in a conventional three-electrode cell powered by a potentiostat/ galvanostat, µ-Autolab, type III (The Netherlands). An Ag/AgCl, 3 mol L-1 KCl, a platinum disk (both from Azar
electrode Co., Iran) and a carbon paste electrode (CPE), were used as the reference, counter and working electrodes, respectively. The system was run by a PC using the GPES 4.9 software.
The morphologies of the copper nanoparticles were examined by scanning electron microscopy (SEM) using a X-30 Philips instrument and transmission electron microscopy (TEM) using a CEM 902A ZEISS instrument. In the later case, an accelerating voltage of 80 kV was applied. These techniques provided information about the morphology and size of particles. Samples were prepared by placing a drop of the particles, dispersed in acetone, on a carbon-covered copper grid (400 mesh) and evaporating the solvent.
Electrode preparation
Cylindrical copper bars of 99.9% purity were sealed with Teflon to obtain polycrystalline copper working electrodes (CE). CE surfaces were polished with sandpaper and 0.05 µm α-alumina powder to the mirror inish and were subsequently rinsed with distilled water.
Unmodified CPEs (u-CPEs) were prepared by hand-mixing carbon powder and mineral oil with an 80/20% (m/m) ratio. The paste was carefully mixed and homogenized in an agate mortar for 20 min. The resulting paste before use was kept at room temperature in a desiccator. The paste was packed irmly into a cavity (3.6 mm diameter, geometric surface are of 0.1017 cm2
and 0.5 mm depth) at the end of a Telon tube. Electrical contact was established via a copper wire connected to the paste in the inner hole of the tube. The electrode surface was gently smoothed by rubbing on a piece of weighing paper just prior to use. This procedure was also used to
regenerate the surface of the carbon paste electrodes. The copper microparticles and copper nanoparticles modiied carbon paste electrodes (denoted as m-CPEs and n-CPEs, respectively) were prepared by mixing carbon powder together with copper micro or nanoparticles at different ratios in an agate mortar until a uniform paste was obtained. The percentage (m/m) of copper informed throughout the text corresponds to the inal percentage relative to the total paste composition. Then mineral oil was added (20% m/m) and mixed thoroughly. The paste so obtained was packed into a 3 mm diameter cavity at the end of a Telon tube and the electrical contact was provided with a copper wire.
Procedures
Standard solutions of etidronate were prepared by dissolving accurate masses of the bulk sodium etidronate in an appropriate volume of 100 mmol L-1 NaOH (which
was also used as the supporting electrolyte throughout the work); the solutions were then stored in the dark at 4 °C. Additional dilute solutions were prepared daily by accurate dilution just before use.
In order to compare the currents measured with m-CPE and n-CPE, the effective surface areas of the electrodes were determined. Based on the reported mechanism (vide infra), etidronate is oxidized on the active sites of copper placed on the electrode surface. Therefore, the anodic currents must be normalized with respect to the total coverage area of copper active sites. To obtain such effective surface areas, the anodic charge passed for the oxidation of copper species was measured in alkaline solution for the modiied electrodes (data not shown); these values were related directly to the effective surface areas. Accordingly, the currents in the cyclic voltammograms were reported as current densities which they normalized with respect to the effective surface areas. Then the currents in cyclic voltammograms were normalized with respect to the real surface areas.
The calibration curves for etidronate in 100 mmol L-1
NaOH solution were measured by amperometric technique. Working potential step of 610 mV was applied for amperometric measurements, which the transient currents were allowed to decay to steady-state values.
For analysis of the drug tablets, the average mass of 10 tablets was determined; then the tablets were inely powdered and homogenized in a mortar. An appropriate, accurately weighed amount of the homogenized powder was transferred into a 100 mL calibrated lask containing 50 mL of 100 mmol L-1 NaOH solution. The contents of
with the same supporting electrolyte. Appropriate solutions were prepared by taking suitable aliquots of the clear iltrate and diluting them with 100 mmol L-1 NaOH. All studies/
measurements were carried out at room temperature.
Results and Discussion
Figure 1A shows SEM image of copper nanoparticles. Spherical nanoparticles were clearly observed which some particles aggregations are also occurred. Copper particles have an average size of 80 nm. Figure 1B represents TEM image of copper nanoparticles. Copper particles with near-spherical shape with an average diameter of 80 nm can be observed. Interestingly, a similarity between the particles size and morphology obtained from SEM measurement and from TEM micrographs is noticeable.
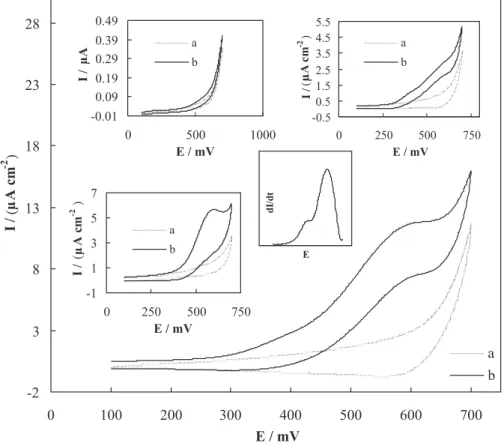
Figure 2 shows cyclic voltammograms of 100 mmol L-1
NaOH solution obtained using n-CPE (main panel), m-CPE (inset A), u-CPE (inset B) and CE (inset C) in the potential range of 100 to 700 mV in the absence (curve a) and presence (curves b) of 5 mmol L-1 etidronate. Etidronate
represented very weak oxidation signal on u-CPE that Figure 1. SEM (A) and TEM (B) images of copper nanoparticles.
Figure 2. Cyclic voltammograms recorded in the absence (a) and presence of 5 mmol L-1 etidronate (b) in 100 mmol L-1 sodium hydroxide solution using
n-CPE. The potential sweep rate was 10 mV s-1. Inset A: Cyclic voltammograms recorded in the absence (a) and presence of 5 mmol L-1 etidronate (b) in
100 mmol L-1 sodium hydroxide solution using m-CPE. The potential sweep rate was 10 mV s-1. Inset B: Cyclic voltammograms recorded in the absence
(a) and presence of 5 mmol L-1 etidronate (b) in 100 mmol L-1 sodium hydroxide solution using u-CPE. The potential sweep rate was 10 mV s-1. Inset C:
Cyclic voltammograms recorded in the absence (a) and presence of 5 mmol L-1 etidronate (b) in 100 mmol L-1 sodium hydroxide solution using CE. The
indicates its weak electroreactivity on carbon-based surfaces. Etidronate was oxidized on both m-CPE and n-CPE in alkaline solution and two anodic peaks were appeared in the voltammograms located at 390 and 625 mV for m-CPE and 410 and 610 mV for n-CPE. Two overlapped anodic peak appeared in the voltammograms recorded using n-CPE can be better visualized when the derivative voltammogram is looked at, as represented in Figure 2, inset D. In the voltammogram recorded using CE, however, one anodic peak related to the etidronate electrooxidation was appeared. It seems that two anodic peaks which appeared in the voltammograms of m-CPE and n-CPE were appeared as a single peak. In the both voltammograms of m-CPE and n-CPE, anodic peaks were followed by a decrease in the cathodic peak current in the reverse sweep. However in the voltammogram of n-CPE the current density of anodic peaks were higher compared to m-CPE and CE. It can be related to the nanosize effect and/or higher surface area of the nanoparticles of copper. Herein, nanoparticles represented higher reactivity compared to those of bulky (microparticles) material due to nanosize effect, because the currents were normalized for the effective surface areas of both electrodes (vide supra). Therefore, nanoparticles of copper performed the electrooxidation process of etidronate with a higher rate compared to those of microparticles from kinetics point of view.
The electrochemistry of copper and copper-based electrodes in alkaline solutions has been extensively investigated.22-25 It is evident that in the entire range of
potential window of aqueous electrolytes, different copper species are created and the Cu(II)/Cu(III) redox couple is generated at the anodic edge of the voltammograms in alkaline solutions.22-25 Regarding the nature of Cu(III)
entity, species ranging from copper oxy-hydroxide to Cu(III) radical have been proposed.26,27 It is well known
that copper can oxidize some organic compounds by chemical reaction between those substrates and Cu(III) active species via a redox mediation electron transfer process (mediated electrocatalytic reaction, EC’ mechanism) at the anodic edge of the voltammograms in alkaline solutions.10,11,21,22,26,27
Based on these explanations and the obtained results, it can be judged that etidronate was oxidized on the copper-based electrode described here via the active Cu(III) species. Copper species were immobilized on the electrode surface, and the higher valence species oxidized etidronate via chemical reactions followed by generation of lower valence species. Higher valance copper species, which is generated at positive potentials, has been reported to play the key role of a redox mediator in the oxidation of organic compounds at copper-based electrodes.10,11,21,22,27
Therefore, the electrode reactions may proceeded via a mechanism involving a rate-limiting step, in which the reaction product(s) were formed upon chemical reactions of etidronate with Cu(III) species, and regeneration of the lower copper species occured through chemical redox reactions. Based on the results, the following mechanism can be proposed for the mediated oxidation of the drug on the modiied surfaces. The redox transition of the copper species:
Cu(II) Cu(III) + e− (1)
is followed by the oxidation of etidronate on the modiied surface in two steps via the following reactions:
kcat1
Cu(III) + Etidronate → Intermediate/Product 1 + Cu(II) (2) kcat2
Cu(III) + Etidronate/Product 1 → Product 2 + Cu(II) (3)
The proposition of two-step reaction for the electrocatalytic oxidation of etidronate on the electrode surfaces (reactions 2 and 3) is based on the appearance of two anodic peaks in the voltammograms of m-CPE and n-CPE (Figure 2, curves b).
Oxidation of the etidronate with higher catalytic rates can be related to nanometer dimensions of nanoparticles of copper which are stably distributed on the carbon surface (vide supra, Figure 1) which is fully and easily accessible for the substrates, and consequently can be readily and completely used as an electrochemical sensing unit. Moreover, nanoparticles are often irregularly shaped objects, and hence there are some defect sites, such as steps that separate planar atomic terraces, or kinks where a step advances or recedes, exposing corner or edge atoms on a plane. The enhancement of the reactivity of these defect sites can be so large that their presence determines to a very large extent the catalytic activity of a material.
The electrooxidation process of etidronate on n-CPE and m-CPE can be attributed to the oxidation of one electroreactive functional group in multiple steps and/or simultaneous oxidation of electroreactive functional groups present in etidronate structure. Herein, as an alcohol analogue, etidronate can not be oxidized because it is a third-type alcohol. First- and second-types alcohols can be oxidized to the corresponding aldehydes or cetones.28
that the number of exchanged electrons in the reaction mechanism is basically equal to unity (reaction (1) in the text); however, the inal products are formed via multiple occurrence of reaction (1).
In order to the more inspection the reaction mechanism and its kinetic, the oxidation of etidronate on n-CPE was investigated by the chronoamperometry technique. Figure 3 shows chronoamperograms recorded in the absence (curve a) and presence (curves b-g) of etidronate using the potential steps of 610 mV. In Figure 3, inset A, a typical chronoamperogram recorded in the presence of 5 mmol L-1
etidronate using applied potential step of 420 mV is also shown. As can be seen, the transient currents at two applied potentials of 420 and 610 mV decay with time in Cottrellian manner (Figure 3, insets B and A1). This indicates that the two steps of the electrocatalytic oxidation of etidronate on n-CPE were controlled by diffusion in the bulk of solution. Therefore, etidronate was electrocatalytically oxidized on nanoparticles of copper via two diffusion-controlled steps. By using the slope of the line represented in Figure 3, inset B, the diffusion coeficients of etidronate can be obtained according to the Cottrell equation:2
I = nFAD1/2Cπ-1/2 t-1/2 (4)
where D is the diffusion coeficient, A is the electrode surface area and C is the bulk concentration. The mean value of the diffusion coeficient for etidronate was found to be 1.55×10⁻⁶ cm2 s-1.
Chronoamperometry can also be used for the evaluation of the catalytic rate constant according to the following equation:29
Icat/Id = γ1/2[π1/2erf (γ1/2) + exp (-γ)/γ1/2] (5)
where Icat and Id are the currents in the presence and absence of etidronate, respectively, and γ = kcatCt is the argument of the error function. kcat is the catalytic rate constant and t is elapsed time. In the cases where γ > 1.5, erf(γ1/2) is almost
equal to unity and the above equation can be reduced to:
Icat/Id = γ1/2 π1/2 =π1/2(k catCt)
1/2 (6)
From the slopes of the Icat/Idvs. t1/2 plots, presented in
Figures 3, inset C, the mean value of kcat for the etidronate oxidation at 610 mV was obtained as 8.9×103 cm3 mol-1 s-1.
It should be pointed out that kcat is either kcat1 or kcat2 whichever is larger.
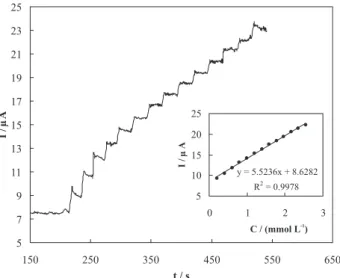
In order to develop a simple and time-saving procedure for the analysis of etidronate in pure form as well as pharmaceutical formulations, amperometry technique was used. Typical amperometric signals obtained during successive increments of etidronate to a 100 mmol L-1
deviation of the intercept and m is the slope of the calibration curves.30 The determined parameters for calibration curves of
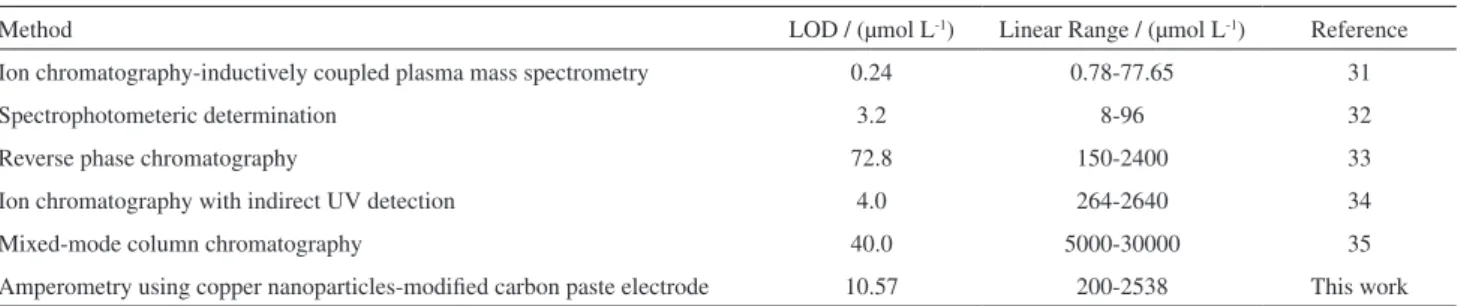
drug, accuracy and precision, LOD and LOQ and the slope of calibration curves are reported in Table 1. A comparison between the analytical parameters for etidronate obtained from some different methods is made in Table 2.
Recovery tests were carried out using the authentic samples. Satisfactory results were obtained in the recovery test. The analysis results of the recovery test are shown in Table 3.
Figure 3. Chronoamperograms of n-CPE in 100 mmol L-1 sodium hydroxide solution with different concentrations of etidronate of: a) 0, b) 0.05, c) 0.2,
d) 0.5, e) 1.0, f) 3.0 and g) 5.0 mmol L-1. Potential step was 610 mV. Inset A: Chronoamperograms of n-CPE in 100 mmol L-1 sodium hydroxide solution
with 5.0 mmol L-1 etidronate. Potential step was 420 mV. Inset A1: Dependency of transient current on t-0.5 related to the curve shown in inset A. Inset B:
Dependency of transient current on t-0.5 related to curve g in main panel. Inset C: Dependence of I cat/Id on t
0.5 related to curve g in main panel.
Figure 4. Current signal as a function of time in 100 mmol L-1 sodium
hydroxide solution during repetitive injections of etidronate using n-CPE. Applied potential was 610 mV. Inset: Dependency of the transient current on etidronate concentration using n-CPE.
Table 1. The determined parameters for calibration curve of etidronate and accuracy and precision (n=3) for electrocatalytic oxidation of the drug on n-CPE
Linear range / (µmol L-1) 200-2538
Slope (A M-1) (5.52 ± 0.3)×10-3
Intercept (A) (8.63 ± 1.8)×10-6
LOD / (µmol L-1) 10.57
LOQ / (µmol L-1) 35.23
R.S.D / (%) 2.3
Bias / (%) 1.05
Table 2. Comparison of various methods for determination of etidronate
Method LOD / (µmol L-1) Linear Range / (µmol L-1) Reference
Ion chromatography-inductively coupled plasma mass spectrometry 0.24 0.78-77.65 31
Spectrophotometeric determination 3.2 8-96 32
Reverse phase chromatography 72.8 150-2400 33
Ion chromatography with indirect UV detection 4.0 264-2640 34
Mixed-mode column chromatography 40.0 5000-30000 35
Amperometry using copper nanoparticles-modiied carbon paste electrode 10.57 200-2538 This work
Table 3. Recovery test results of etidronate
Sample Added quantity / (µmol L-1)
Recovered quantity / (µmol L-1)
Recovery / (%)
Sample 1 610 597 97.9
Sample 2 794 800 100.8
Sample 3 1008 995 98.7
Sample 4 1190 1210 101.7
Sample 5 2350 2480 105.5
The applicability of the proposed amperometric method for the sample dosage form was examined by analyzing the tablets. It was found that the amounts of drug determined using this method was in good agreement with the reported values. The values of experimentally determined drugs and declared values in tablets are tabulated in Table 4.
Selectivity of the amperometric procedure for the assay of etidronate was examined in the presence of some common excipients in the same ratios usually used in pharmaceutical preparations (for example, gelatin, talc, starch, and magnesium stearate). The results showed no signiicant interference from excipients of tablets of etidronate. Therefore, the procedure was able to assay
etidronate in the presence of excipients and hence, it can be considered selective.
In order to verify the durability and long-term stability of the n-CPE, 100 consecutive cyclic voltammograms using this electrode were recorded in 100 mmol L-1 NaOH
solution containing 5 mmol L-1 etidronate. It was found that
the peak currents changed slightly (<5%).
Conclusions
Carbon paste electrodes modified with micro and nanoparticles of copper and also polycrystalline copper electrode were employed for the electrocatalytic oxidation and determination of etidronate. Etidronate was oxidized on copper-based electrodes via mediation of Cu(III) active species. m-CPE represented two anodic peaks in the voltammograms. n-CPE was also generated two anodic peaks, however, with the higher corresponding currents. The higher current of electrocatalytic oxidation of etidronate using nanoparticles of copper with respect to the microparticles one was related to the acceleration of the electrooxidation process by nanosize effect of copper nanoparticles. Amperometric procedure was successfully applied using n-CPE for the quantiication of the etidronate with high sensitivities in bulk and pharmaceutical samples.
Acknowledgments
The inancial support of the Iran National Science Foundation (INSF) and University of Tehran are gratefully acknowledged. The authors are also grateful to Modava Co. Ltd., Tehran, Iran.
References
1. Major, P. P.; Cook, R.; Am. J. Clin. Oncol. 2002, 25, 10. 2. Body, J. J.; Support. Care Cancer 1999, 7, 1.
3. Robert, E.; Oncologist 2004, 9, 14.
4. Zacharis, C. K.; Tzanavaras, P. D.; J. Pharm. Biomed. Anal. 2008, 48, 483 and references therein.
Table 4. Determination of etidronate in pharmaceutical forms
Sample Type
Amount labeled /
mg
Amount found /
mg
Percentage R.S.D / (%) Bias / (%)
Etidronate Tablet 1
200 197.9 98.95 6.2 −1.0
Etidronate Tablet 2
200 199.5 99.75 4.8 −0.3
Etidronate Tablet 3
200 198.2 99.1 5.8 −0.9
Etidronate Tablet 4
200 202.2 101.09 8.1 1.1
Etidronate Tablet 5
5. British Pharmacopoeia, Index+ for Windows v1.16C, 2007. 6. United State Pharmacopoeia USP30 NF25.
7. Shawgo, R. S.; Voskerician, G.; Duc, H. L. H.; Li, Y. W.; Lynn, A.; MacEwan, M.; Langer, R.; Anderson, J. M.; Cima, M. J.; J. Biomed. Mater. Res., Part A 2004, 71, 559.
8. Pinkerton, T. C.; Lawson, B. L.; Clin. Chem. 1982, 28, 1946. 9. Fernandez-Garcia, M.; Martinez-Arias, A.; Hanson, J. C.;
Rodriguez, J. A.; Chem. Rev. 2004, 104, 4063.
10. Heli, H.; Hajjizadeh, M.; Jabbari, A.; Moosavi-Movahedi, A. A.; Anal. Biochem. 2009, 388, 81.
11. Heli, H.; Hajjizadeh, M.; Jabbari, A.; Moosavi-Movahedi, A. A.; Biosens. Bioelectron. 2009, 24, 2328.
12. Houshmand, M.; Jabbari, A.; Heli, H.; Hajjizadeh, M.; Moosavi-Movahedi, A. A.; J. Solid State Electrochem. 2008, 12, 1117. 13. Heli, H.; Jabbari, A.; Majdi, S.; Mahjoub, S.; Moosavi-Movahedi, A. A.; Sheibani, S.; J. Solid State Electrochem. 2009, 13, 1951.
14. Yadegari, H.; Jabbari, A.; Heli, H.; Moosavi-Movahedi, A. A.; Karimian, K.; Khodadadi, A.; Electrochim. Acta 2008, 53, 2907. 15. Majdi, S.; Jabbari, A.; Heli, H.; Yadegari, H.; Moosavi-Movahedi, A. A.; Haghgoo, S.; J. Solid State Electrochem. 2009, 13, 407.
16. Liu, L.; Song, J.; Anal. Biochem. 2006, 354, 22.
17. Hajjizadeh, M.; Jabbari, A.; Heli, H.; Moosavi-Movahedi, A. A.; Shaiee, A.; Karimian, K.; Anal. Biochem. 2008, 373, 337. 18. Majdi, A.; Jabbari, A.; Heli, H.; Moosavi-Movahedi, A. A.;
Electrochim. Acta 2007, 52, 4622.
19. Hajjizadeh, M.; Jabbari, A.; Heli, H.; Moosavi-Movahedi, A. A.; Haghgoo, S.; Electrochim. Acta 2007, 53, 1766.
20. Majdi, S.; Jabbari, A.; Heli, H.; J. Solid State Electrochem. 2007, 11, 601.
21. Hajjizadeh, M.; Jabbari, A.; Heli, H.; Moosavi-Movahedi, A. A.; Chem. Anal. (Warsaw, Pol.) 2008, 53, 429.
22. Marioli, J. M.; Kuwana, T.; Electrochim. Acta 1992, 37, 1187. 23. Pyun, C. H.; Park, S. M.; J. Electrochem. Soc. 1986, 132, 2024. 24. Abd El Haleem, S. M.; Ateya, B. G.; J. Electroanal. Chem.
1981, 117, 309.
25. Burke, L. D.; Ahern, M. J. G.; Ryan, T. G.; J. Electrochem. Soc. 1990, 137, 553.
26. Meyerstein, D.; Hawkridge, F. M.; Kuwana, T.; J. Electroanal. Chem. 1972, 40, 377.
27. Fleischmann, M.; Korinek, K.; Pletcher, D.; J. Chem. Soc., Perkin Trans. 1972, 10, 1396.
28. Morrow, G. W. In Organic Electrochemistry; Lund, H.; Hammerich, O., eds., Marcel Dekker: New York, 1991, ch. 16. 29. Bard, A. J.; Faulkner, L. R.; Electrochemical Methods, Wiley:
New York, 2001.
30. Miller, J. C.; Miller, J. N.; Statistics for Analytical Chemistry, 4th ed., Ellis-Harwood: New York, 1994.
31. Kovacevic, M.; Gartner, A.; Novic, M.; J. Chromatogr., A 2004, 1039, 77.
32. Taha, E. A.; Youssef, N. F.; Chem. Pharm. Bull. 2003, 51, 1444. 33. Xie, Z.; Jiang, Y.; Zhang, D.; J. Chromatogr., A 2006, 1104,
173.
34. Tsai, E. W.; IP, D. P.; Brooks, M. A.; J. Pharm. Biomed. Anal. 1993, 11, 513.
35. Liu, X. K.; Fang, J. B.; Cauchon, N.; Zhou, P.; J. Pharm. Biomed. Anal. 2008, 46, 639.
Received: December 31, 2008