Article
Printed in Brazil - ©2012 Sociedade Brasileira de Química0103 - 5053 $6.00+0.00
A
*e-mail: [email protected]
Development and Validation of an LC-UV Method for Quantification of a
New Thiazolidinedione (LPSF/AC-23) with Antitumor Activity in Rat Plasma
Raphael D. Valério,a Ricardo M. Silva,a Hellencléia P. Cunha,a Maria C. A. Lima,b Suely L. Galdino,b Ivan R. Pittab and Maria Bernadete S. Maia*,a
aLaboratório de Farmacologia de Produtos Bioativos, Departamento de Fisiologia e Farmacologia,
Universidade Federal de Pernambuco, 50670-901 Recife-PE, Brazil
bDepartamento de Antibióticos, Universidade Federal de Pernambuco, 50732-270 Recife-PE, Brazil
Um método rápido e simples de LC-UV (cromatograia líquida com detecção ultravioleta) foi desenvolvido e validado para quantiicação do 5-acridina-9-ilmetileno-3-(4-lúor-benzil)-tiazolidina-2,4-diona (LPSF/AC-23) em plasma de ratos utilizando extração por precipitação proteica com acetonitrila, e uma tiazolidinadiona (3-(2-bromo-benzil)-5-(5-bromo-2-metoxi-benzilideno)-tiazolidina-2,4-diona) como padrão interno. A separação e quantificação do LPSF/AC-23 foi realizada utilizando uma fase móvel composta por uma mistura de acetonitrila/metanol/tampão fosfato (55:30:15) eluída de forma isocrática através de uma coluna analítica C18 seguida de detecção UV a 249 nm. A curva de calibração foi linear na faixa de
100-10.000 ng mL–1. A precisão intra e interdia apresentou valores de desvio-padrão relativo
preconizados pela Agência Nacional de Vigilância Sanitária (Anvisa) e a exatidão, expressa pelo erro relativo, variou de –3,49 a 7,67%. A recuperação foi de 92,25% para o analito e 89,67% para o padrão interno e nenhum interferente endógeno foi observado. Desta forma, o método proposto pode ser aplicado na determinação quantitativa do LPSF/AC-23 em plasma de ratos em estudos farmacocinéticos e de biodisponibilidade.
A quick and simple LC-UV (liquid chromatography with ultraviolet detection) method was developed and validated for quantiication of 2,4-thiazolidinedione,5-(9-acridinylmethylene)-3-[(4-luorophenyl)methyl] (LPSF/AC-23) in rat plasma using protein precipitation extraction with acetonitrile, and a thiazolidinedione 2,4-thiazolidinedione,5-[(5-bromo-2-methoxyphenyl) methylene]-3-[(2-bromophenyl)methyl] as an internal standard. The separation and quantiication of LPSF/AC-23 were performed using a mobile phase consisting of a mixture of acetonitrile/methanol/phosphate buffer (55:30:15) eluted in an isocratic manner through a C18 analytical column followed by UV detection at 249 nm. The calibration curve was linear
in the range of 100-10,000 ng mL–1. The intra- and inter-day precisions expressed by relative
standard deviation values were recommended by the Brazilian Health Surveillance Agency (Anvisa), and accuracy expressed by relative error ranged from −3.49 to 7.67%. The recovery was 92.25% for the analyte and 89.67% for the internal standard and no endogenous interference was observed. Thus, the proposed method can be applied to quantitative determination of LPSF/AC-23 in plasma of rats, in pharmacokinetic and bioavailability studies.
Keywords: LPSF/AC-23, LC-UV, rat plasma, validation, antitumor
Introduction
Cancer stands out as one of the major diseases that aflict the world’s population today. For an overview of the situation, in 2008, there were 7.6 million deaths due to this disease, a number that represents approximately
13% of all deaths reported worldwide that year.1 It is expected that the number of new cases of the disease will surge from 11.3 million to 15.5 million between 2007 and 2030 and the number of deaths from cancer in the world will increase by 45% over the same period, reaching a staggering 11.5 million deaths.2
suffering for the population and great economic loss to the country since a large part of the affected population is in the economically active age group, thus causing a decrease in work-force.4 Added to this there is also a large inancial expenditure by the government to treat the sick allocated to public hospitals.
In an attempt to improve the outlook described above, the modern organic synthesis has provided a signiicant increase in the number of synthetic substances that have been used as important therapeutic agents in humans.5 In this context, studies developed by the Therapeutic Innovation Research Group (Federal University of Pernambuco (UFPE), Brazil) related to the synthesis of new drugs based on imidazolidine have generated promising molecules, among which are the derived 2,4-thiazolidinedione, 5-(9-acridinylmethylene)-3-[(4-fluorophenyl)methyl] (LPSF/AC-23) (Figure 1). This has demonstrated signiicant antitumor activity in vivo against the model of solid tumor sarcoma 180 at a dose of 46 mg kg−1 day–1.
LPSF/AC-23 is an acridine, and therapeutic activity of this class of compounds comes from their ability to bind to DNA, intercalating between base pairs and thus blocking the action of the enzymes topoisomerase I and II, which are important in cell division. This mechanism affects the structure and functional integrity of the genome to alter or impede the vital process of cell progression, promoting the death of the carcinogenic cell.6,7
As LPSF/AC-23 is an original molecule, there is no method in the literature for monitoring plasma levels of this compound. Considering then the therapeutic potential of this molecule, the objective of this work was to develop a simple, selective and reproducible bioanalytical method with adequate sensitivity for the quantitative determination of the chemical in the plasma of rats. Such a method is an essential item in studies involving pharmaceutical and pharmacological aspects (pre-clinical and clinical) of this new antitumor agent.
Experimental
Chemical substances
LPSF/AC-23 and the internal standard (IS, 2,4-thiazolidinedione,5-[(5-bromo-2-methoxyphenyl) methylene]-3-[(2-bromophenyl)methyl]) were supplied by the Laboratory of Planning and Synthesis of Drugs (UFPE). HPLC-grade methanol and acetonitrile were purchased from URQ Labor (Brazil). Ultrapure water was obtained through a Milli-Q purification system. Analytical grade sodium phosphate was purchased from Vetec (Brazil). The plasma used for the development and validation of the method was obtained from Wistar rats aged between 60 and 90 days with a weight ranging from 200 to 300 g, housed at the Animal Facility of the Department of Physiology and Pharmacology (UFPE) and not undergoing any pharmacological treatment. All methodology was approved by the Ethics Committee on Animal Experimentation (EAEC, UFPE, Recife-PE, Brazil), process No. 23076.024804/2009-62.
Preparation of standard solutions
A stock solution of LPSF/AC-23 at a concentration of 100 μg mL–1 was prepared in acetonitrile. Subsequently, standard solutions were prepared from this concentrated stock solution by dilution with ultrapure water. These diluted working solutions were used to obtain the calibration curve and the low (300 mg mL–1), medium (5000 ng mL–1) and high (8000 ng mL–1) quality control samples. The concentrations of the calibration curve ranged from 100 to 10.000 ng mL–1.
Sample preparation (in vitro)
For the preparation of the samples for the construction of the calibration curve and quality controls, 100 μL of spiked plasma were separated and added to 300 μL of an acetonitrile solution containing 2 μg mL–1 of IS. This Figure 1. Structural formula of the compound (a) 2,4-thiazolidinedione,
mixture was homogenized with the aid of a vortex for 30 s. Afterward, the samples were centrifuged at 4500 rpm for 10 min. The supernatant was then transferred to a 2 mL Eppendorf® tube and an aliquot of 20 μL was injected directly into the chromatographic system. The blank plasma samples were prepared as described above, but without the addition of the analyte and IS.
Mass spectrometer
To conirm the identity of both LPSF/AC-23 and IS, a mass spectrometer model Shimadzu LC-MS-IT-TOF (liquid chromatograph/mass spectrometer coupled to atmospheric pressure ionization with ion-trap and time-of-flight, Kyoto, Japan) was used with electrospray ionization (ESI) operating in the positive and negative mode.
System and chromatographic conditions
Samples were analyzed using an HPLC (high performance liquid chromatography) system (Shimadzu, Kyoto, Japan), consisting of a pump (model LC-10AD), UV detector (fixed model SPD-10) and manual injection system operated by LCSolutions software, running on Windows Vista, for data acquisition. A C18 column (Phenomenex® Luna type (5 μm, 150 mm × 4.6 mm) was used. The mobile phase consisted of methanol/acetonitrile/phosphate buffer (5 mmol L-1) (30:55:15 v/v/v) at pH 6.0 with a low rate of 1 mL min–1 and oven temperature at 40 °C. The wavelength used for the detection of LPSF/AC-23 and IS was 249 nm.
Validation protocol
The method was validated according to the guidelines of the Brazilian National Agency of Sanitary Surveillance (Anvisa),8 published in Resolution No. 899 on May 29, 2003.
Pre-validation of the method
To conirm the purity of the chromatographic peak of LPSF/AC-23 and the internal standard, solutions were prepared of the analyte and IS in acetonitrile at concentration of 7000 ng mL–1. These solutions were subjected to analysis in a LC-MS-IT-TOF equipment from Shimadzu.
To determine the wavelength with maximum absorption in the ultraviolet spectrum of these same samples of LPSF/AC-23 and IS, they were scanned in the visible-ultraviolet spectrum using the LC-MS-IT-TOF equipment, which has a diode array detector (DAD).
Method validation
To validate the method developed, three calibration curves were built in duplicate on the same day (intra-day), with a one-hour interval between the construction of one curve and the next. Additionally, three calibration curves were built in duplicate on different days (inter-days). All curves contained seven calibration points ranging from 100 to 10.000 ng mL–1. The quality control samples were also analyzed on these days, as recommended by the Anvisa validation protocol.8 The parameters of selectivity, linearity, recovery, precision and accuracy of the method were analyzed for validation.
S e l e c t iv i t y wa s ve r i fi e d b y c o m p a r i n g t h e chromatograms obtained from samples containing LPSF/AC23 and IS, with those obtained from blank plasma samples. Sensitivity was determined, with the aid of software, through successive dilutions of plasma solutions with the analyte until they reached a signal/noise ratio determined by legislation, namely: 3:1 for the limit of detection (LOD) and 5:1 for the lower limit of quantiication (LOQ). The linearity of the calibration curves obtained from the ratio of the area of the analyte over the area of IS (x-axis) as a function of the ratio of analyte concentration on IS (y-axis) was calculated by the software LCSolutions, by the method of least squares and submitted to regression analysis to calculate the mathematical equation of calibration and corresponding correlation coefficients. The method is considered linear if the linear correlation coeficient is ≤ 0.98.8 The precision and intra- and inter-day accuracy were obtained from the analysis (in octaplicate) of the low, medium and high-quality controls (LQC, MQC and HQC, respectively) samples. Precision was calculated as the relative standard deviation (RSD) of the experimental concentrations, and accuracy as the relative error value (RE) obtained when comparing the experimental concentrations and nominal concentrations of the samples. The acceptance criterion for precision is that RSD is ≤ 15%, for LQC, MQC and HQC concentrations, with the exception of LOQ, for which values of ≤ 20% were accepted.8 For the accuracy, RE values ranging from ± 15% of the nominal concentration were accepted, with the exception again of the lower LOQ, for which variations up to ± 20% were accepted.8
Stability studies
The stability of short and long duration of LPSF/AC-23 in plasma and the stability after freezing and thawing cycles were evaluated by processing samples of LQC and HQC. To assess the stability of short duration, LQC and HQC samples (in triplicate) were kept at room temperature for 6 h and then processed. The results were compared with those obtained from the analysis of freshly prepared samples. For the long-duration studies, LQC and HQC samples were stored in a freezer at −20 °C for 30 days and then processed. The results were compared with those obtained from the analysis of samples prepared on the irst day of the test. Stability studies of freezing and thawing were performed by analyzing LQC and HQC samples after three cycles (−20 °C and room temperature) and the results
were compared with those obtained from the analysis of freshly prepared samples.
Results
Pre-validation of the method
The result of the test to confirm the purity of the chromatographic peak of a sample containing LPSF/AC-23 made by LC-MS is shown in Figure 2.
In this test, the soft ionization technique was used, therefore, during the run itself, it was observed if the molecular ion was formed. Based on the result shown in Figure 2, the exact molecular weight of LPSF/AC-23 plus a proton can be seen, thus conirming that the observed peak in the chromatogram corresponds to the analyte.
The results of determining the wavelength of highest absorption in the ultraviolet spectrum for LPSF/AC-23 and IS are shown in Figure 3.
The result shown in Figure 3 reveals that the wavelength in the ultraviolet region in which LPSF/AC-23 has its
maximum absorption is 249 nm. As the IS has its maximum absorption in the region between 229-279 nm, there is no signiicant difference between one wavelength and the other in this region. These results are important because they show that the two components can be monitored at the wavelength of maximum absorption of the analyte (249 nm), an essential condition to be able to use LPSF/GQ-113B as IS.
In the design tests of ideal chromatographic conditions, various mobile phases were tested based on the physicochemical properties of the new molecule (molecular weight 414.063, descriptors of the molecule log P = 5.51 and pKa 6.05, calculated by the Chemicalize molecular modeling software) in an attempt to develop a simple, rapid and sensitive method for the quantiication of
LPSF/AC-23 in biological matrices. Due to having a high log P value, LPSF/AC-23 is insoluble in water and soluble in organic solvents such as acetonitrile, ethyl acetate and methanol. In this context, the mobile phases tested consisted of mixtures of acetonitrile, methanol and phosphate buffer with various pH values. The optimization of chromatographic conditions was conducted to obtain peaks with good resolution and symmetry, free of endogenous interference, reduced retention time and high sensitivity. Based on this, the chromatographic conditions deined as ideal for the course of this study were the following: mobile phase consisting of acetonitrile/methanol/phosphate buffer (5 mmol L-1) (55:30:15) at pH 6.0, temperature 40 °C and low rate of 1 mL min-1. The elution of the mobile phase was done in an isocratic manner.
Method validation
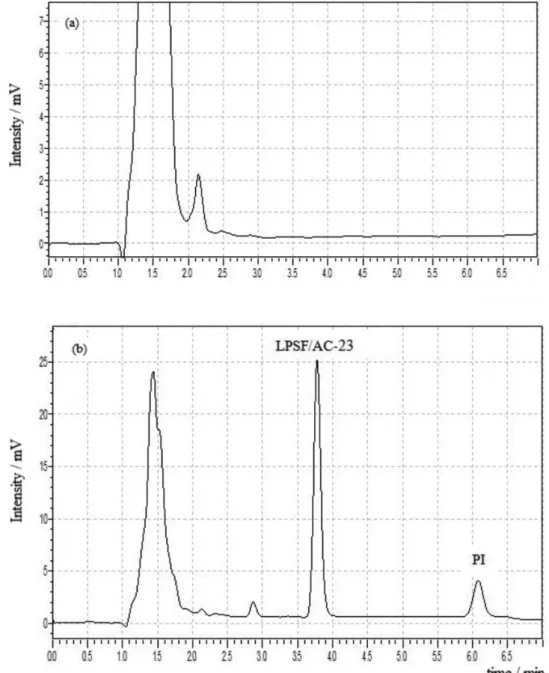
Selectivity
The selectivity of the bioanalytical method developed can be seen in Figure 4 by comparing the chromatogram obtained from blank plasma samples (Figure 4a) with plasma samples spiked with LPSF/AC-23 and IS (Figure 4b).
Under these chromatographic conditions, all plasma components elute in the time window between 1.0 and 3.0 min, thus not interfering with the time window for the elution of LPSF/AC-23 and IS. In addition, there was adequate stabilization of the baseline. For these reasons,
these chromatographic parameters were chosen as ideal for the course of this study. Thus, the retention time of LPSF/AC-23 was set at 3.80 ± 0.02 min and the retention time of IS at 6.15 ± 0.05 min.
Recovery
The average recovery for individual concentrations and the overall average recovery of LPSF/AC-23 and IS are shown in Table 1.
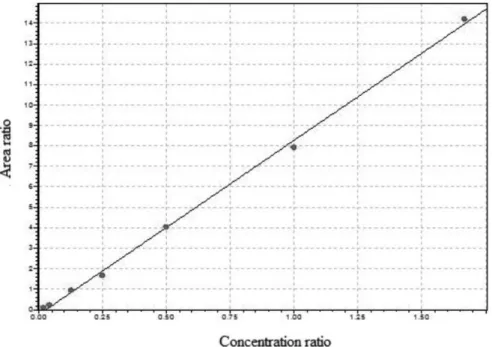
Linearity
The method was linear between concentrations of 100 and 10.000 ng mL–1. The linear correlation coeficient (r)
ranged from 0.9937 to 0.9991 and the coefficient of determination from 0.9874 to 0.9982 for the constructed curves, thus showing that the method has a good linear relationship according to Anvisa validation protocol.8 The average analytical curve is shown in Figure 5.
Lower limit of quantification
The lower LOQ was 100 ng mL–1, which was the lowest concentration of the analytical curve which could be determined under the conditions used in this bioanalytical method, with adequate precision and accuracy (Table 2).
Precision and accuracy
The test results of precision and accuracy are shown in Table 2.
The results show that the method developed is precise and accurate, as the values of RSD and RE were below 20% for the lower LOQ (100 ng mL–1) and 15% for LQC concentrations (300 ng mL–1), MQC (5000 ng mL−1) and HQC (8000 ng mL–1), thus obeying
the parameters recommended by Anvisa.8
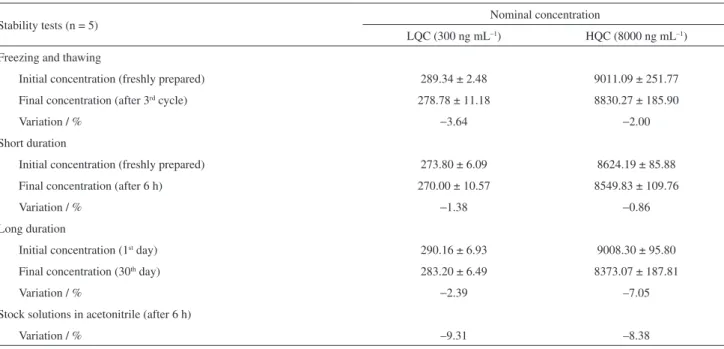
Stability studies
The results for the stability tests are shown in Table 3.
Table 1. Recovery of LPSF/AC-23 and of the internal standard
Plasma concentration /
(ng mL–1)
LPSF/AC-23 Internal standard
Average recovery / %
(n = 5)
Average recovery / %
(n = 15)
LQC 300 98.63 −
MQC 5000 92.31 −
HQC 8000 85.81 −
Internal standard 6000 − 89.67
Overall average 92.25 89.67
Low, medium and high-quality controls: LQC, MQC and HQC, respectively.
Figure 5. Average analytical curve of LPSF/AC-23. The average equation of the calibration curve was y = 7.9472 x – 0.1815; the average of r = 0.9968 and r2 = 0.9936.
Table 2. Precision and accuracy in the quantiication of LPSF/AC-23
LPSF/AC-23 nominal concentration / (ng mL–1)
Intra-day (n = 8) Inter-day (n = 8)
Recovered concentration /
(ng mL-1) RSD / % RE / %
Recovered concentrationa /
(ng mL-1) RSD / % RE / %
100 100.51 ± 14.96 14.88 0.51 100.98 ± 16.70 16.53 0.98
300 291.97 ± 6.68 2.28 –2.67 289.51 ± 16.37 5.65 −3.49
5000 4894.01 ± 223.27 4.56 –2.11 4850.33 ± 153.45 3.16 −2.99
8000 8613.94 ± 278.57 3.23 7.67 8466.96 ± 414.40 4.89 5.83
Table 3. Stability of LPSF/AC-23 in the Wistar rat plasma and in the standard solutions under different storage conditions
Stability tests (n = 5) Nominal concentration
LQC (300 ng mL–1) HQC (8000 ng mL–1)
Freezing and thawing
Initial concentration (freshly prepared) 289.34 ± 2.48 9011.09 ± 251.77
Final concentration (after 3rd cycle) 278.78 ± 11.18 8830.27 ± 185.90
Variation / % −3.64 −2.00
Short duration
Initial concentration (freshly prepared) 273.80 ± 6.09 8624.19 ± 85.88
Final concentration (after 6 h) 270.00 ± 10.57 8549.83 ± 109.76
Variation / % −1.38 −0.86
Long duration
Initial concentration (1st day) 290.16 ± 6.93 9008.30 ± 95.80
Final concentration (30th day) 283.20 ± 6.49 8373.07 ± 187.81
Variation / % −2.39 –7.05
Stock solutions in acetonitrile (after 6 h)
Variation / % –9.31 –8.38
Low and high-quality controls: LQC and HQC, respectively.
The results show that LPSF/AC-23 is stable in Wistar rat plasma under various storage and temperature conditions, as the variation percentage values were low.
The analyte is also stable in a standard solution of acetonitrile for a period of 6 h as the variation between the initial and inal amount was below 15%.
Discussion
Pre-validation of the method
To determine the ideal chromatographic conditions along with sample preparation are certainly the most time consuming and laborious steps when it comes to validation of bioanalytical methods.9-11 They are steps that are not well deined and studied, resulting in a high variability of data (errors), and thereby sometimes making it impossible to continue the study.
In a study by other authors, various types of mobile phases were tested and it was experimentally observed that all were able to elute 95% of unextracted plasma proteins within 3 min.12 Based on this, for this study, it was changed the composition of mobile phases and the experimental parameters of low, temperature and pH to obtain a retention time for the analyte and IS that was as small as possible, but that did not interfere with endogenous components of the biological matrix.
The solvents used in the composition of mobile phases were acetonitrile and methanol in different proportions with a phosphate buffer. These are the solvents of choice when
it comes to drug analysis in chromatographic systems.13 In this context, the irst noteworthy point is that the retention time of LPSF/AC-23 is directly proportional to the amount of water present in the mobile phase to the point that, if using a mobile phase in which half of its composition is phosphate buffer, it may take more than 60 min to be eluted. This shows that the compound actually has a great afinity for organic phases (polar) and little afinity for aqueous systems, conirming the results of the solubility tests and the descriptors of the molecule (log P = 5.51). Another relevant point is that when the inluences of the organic solvents (methanol and acetonitrile) are compared in the elution strength of the mobile phase, it can be observed that the latter more strongly inluences this parameter, increasing it. When considering the data obtained between the mobile phases consisting of methanol/phosphate buffer (50:50 v/v) and acenonitrile/phosphate buffer (50:50 v/v), LPSF/AC-23 is found to elute within 60 min (precisely 39.55 min) when using the mobile phase with acetonitrile, which does not happen when methanol is used (RT higher than 60 min).
Method validation
was obtained. For these reasons, this mobile phase, along with other parameters of pH, temperature and low rate, was chosen as the ideal for the course of this study.
The results show that the method is linear in the concentration range of 100 to 10.000 ng mL–1, the linear correlation coeficients for all the analytical curves were above the limit of 0.98 determined by Anvisa.8
The method achieved excellent recovery of both LPSF/AC-23 and IS. The irst had an average recovery of 92.25% and the second 89.67%. These results were even a bit superior to those found in pre-validation tests in which the best extraction method was deined, showing that the methodology developed can actually recover almost all of the analyte and IS that was used to contaminate the sample, a very important fact for later trials of in vivo pharmacokinetics.
When analyzing the results, it can be observed that the method developed is precise and accurate within the concentration range of the calibration curve (100-10.000 ng mL–1) because the values of relative standard deviation and relative error were always below 20% for the quality control sample at lower LOQ concentration and less than 15% for LQC, MQC and HQC concentrations, thus meeting the standards of Anvisa.8
With respect to stability of LPSF/AC-23 in the biological matrix used in this study, the results showed that the analyte is stable under different storage and temperature conditions, as variations were always lower than 15% of the initial concentration. Results for the freezing and thawing test had a maximum variation of −3.64%; for the short term
test, maximum variation of −1.38%; for the long term test, maximum variation of –7.05%.
In relation to the stability of LPSF/AC-23 in stock solutions in acetonitrile, the results also show the stability of these solutions, because the maximum variation over the initial concentration was –9.31%, again below the 15% as recommended by Anvisa.8
It must be emphasized that the results obtained here relate to the stability of the analyte only under the conditions studied and only in the biological matrix studied, in this case, the plasma from Wistar rats. The same results cannot be extrapolated to other biological matrices or other temperature and storage conditions than those studied in this work.
General aspects
Because it is a novel molecule, it is not possible to directly compare the features and parameters of this method with other methods, already validated, but it is possible to compare the results obtained from studies using LPSF/AC-23-like molecules, such as thioacridines and
thiazolidinediones. Following this reasoning, one can consider a study that developed and validated a method for determining a pirazoloacridine with antitumor activity in human plasma.14 The retention time obtained in that study for the analyte was 13.7 ± 0.5 min.14 In comparison to RT of LPSF/AC-23 (3.80 ± 0.02 min) and IS (6.15 ± 0.05 min), using the method developed and validated here, it can be seen that the method developed in this work is almost twice as fast. In terms of the total time of analysis, it can be seen that the method developed here (less than 7 min), in comparison with the other works for the quantiication of thiazolidinadiones in the plasma of rats or humans (25,15 12,16 11,17 9,18 8 19 and 7.5 min),20 again showing the best results.
Another important aspect is that the method developed in this work uses a small volume of plasma to perform the analysis (100 μL), a very relevant fact since, in pharmacokinetic studies involving small rodents, only a small sample amount of the biological matrix (plasma) is generally obtained thereby hindering the realization of the analyses. Compared with the volume of plasma used in other studies involving similar molecules, the amount of sample used here is ten times smaller,15,18 two and a half times less14 and twice less,19 showing once again this to be a most advantageous method.
Conclusions
Acknowledgements
This work was supported by the Conselho Nacional de Desenvolvimento Cientíico e Tecnológico (CNPq-Brazil, Process No. 135869/2009-9).
References
1. http://www.who.int/mediacentre/factsheets/fs297/es/ accessed in July 2012.
2. http://www.who.int/features/qa/15/es/index.html accessed in July 2012.
3. http://mortalidade.inca.gov.br/Mortalidade/ accessed in July 2012.
4. Costa-Couto, M. H; Nascimento, A. C.; Ciênc. Saúde Coletiva
2008, 13, 1869.
5. Verma A.; Saraf S. K.; Eur. J. Med. Chem. 2008, 43, 897. 6. Pigatto, M. C.; Lima M. C. A.; Galdino, S. L.; Pitta, I. R.;
Vessecchi, R.; Assis, M. D.; Santos, J. S.; Costa, T. D.; Lopes, N. P.; Eur. J. Med. Chem. 2011, 46, 4245.
7. Arimondo, P. B.; Hélène, C.; Curr. Med. Chem. Anticancer Agents 2001, 1, 219.
8. Agência Nacional de Vigilância Sanitária (Anvisa); Guia para Validação de Métodos Analíticos e Bioanalíticos, Resolução-RE No. 899, 2003.
9. Hernandes-Borges, J.; Borges-Miquel, T. M.; Rodrigues-Delgado, M. A.; Cifuentes, A. J.; Chromatogr., A2007, 1153, 214. 10. Erny, G. L.; Cifuentes, A.; J. Pharm. Biomed. Anal. 2006, 40,
509.
11. Gilar, M.; Anal. Biochem.2001, 298, 196.
12. Misl’anova, C.; Hutta, M.; J. Chromatogr., B: Anal. Technol. Biomed. Life Sci. 2001, 765, 167.
13. Meyer, R. V.; Practical High-Performance Liquid Chromatography, 4th ed.; John Wiley & Sons Ltda: New Jersey,
USA, 2004.
14. Jayewardene, A. L.; Santoro, J. E.; Gambertoglio, J. G.;
J. Chromatogr., B: Anal. Technol. Biomed. Life Sci. 1997,
702, 203.
15. Kolte, B. L.; Raut, B. B.; Deo, A. A.; Bagool, M. A.; Shinde, D. B.; J. Chromatogr., B: Anal. Technol. Biomed. Life Sci.2003,
788, 37.
16. Sun. N.; Lu, G.; Lin. M.; Fan, G.; Wu, Y.; Talanta2009, 78, 506.
17. Sun. N.; Lin. M.; Fan, Y.; Hong, Z.; Lu, G.; J. Chromatogr., B: Anal. Technol. Biomed. Life Sci. 2006, 835, 35.
18. Sripalakit, P.; Neamhom, P.; Saraphanchotiwitthaya, A.;
J. Chromatogr., B: Anal. Technol. Biomed. Life Sci. 2006,
843, 164.
19. He, J.; Hu,Y. F.; Duan, L. F.; Tan Z. R.; Wang, L. S.; Wang, D.; Zhang, W.; Li, Z.; Liu, J.; Tu, J. H.; Yao, Y. M.; Zhou, H.;
J. Pharm. Biomed. Anal.2007, 43, 580.
20. Uchoa, F. D.; Cattani V. B.; Lima, M. C.; Galdino, S. L.; Pitta, I. R.; Costa, T. D.; J. Braz. Chem. Soc. 2008, 19, 1553.
![Figure 1. Structural formula of the compound (a) 2,4-thiazolidinedione, 5-(9-acridinylmethylene)-3-[(4-fluorophenyl)methyl] and (b) of the internal standard 2,4-thiazolidinedione,5-[(5-bromo-2-methoxyphenyl) methylene]-3-[(2-bromophenyl)methyl].](https://thumb-eu.123doks.com/thumbv2/123dok_br/18996121.462248/2.892.177.367.503.863/structural-thiazolidinedione-acridinylmethylene-fluorophenyl-thiazolidinedione-methoxyphenyl-methylene-bromophenyl.webp)
![Figure 3. Chromatograms of scanning diode array detector of the (a) sample containing the compound 2,4-thiazolidinedione,5-(9-acridinylmethylene)- 2,4-thiazolidinedione,5-(9-acridinylmethylene)-3-[(4-luorophenyl)methyl] and (b) the sample containing intern](https://thumb-eu.123doks.com/thumbv2/123dok_br/18996121.462248/5.892.111.751.116.743/chromatograms-containing-thiazolidinedione-acridinylmethylene-thiazolidinedione-acridinylmethylene-luorophenyl-containing.webp)