Arq. Bras. Med. Vet. Zootec., v.68, n.3, p.805-813, 2016
Validation of an HPLC-UV method for the identification and quantification of bioactive amines in chicken meat
[Validação de metodologia por HPLC/UV para identificação e quantificação de aminas bioativas em carne de frango de corte]
D.C.S. Assis1, L.D.M. Menezes2, A.L. Lima1, R.W.T. Klein2, L.G.D. Heneine3,L.J.C. Lara1, L.V. Teixeira1, C.B.D. Ornellas1, S.V. Cançado1, T.C. Figueiredo1*
1Escola de Veterinária ˗ Universidade Federal de Minas Gerais ˗ EV-UFMG Belo Horizonte, MG 2Instituto Mineiro de Agropecuária ˗ IMA Belo Horizonte, MG
3Fundação Ezequiel Dias ˗ FUNED Belo Horizonte, MG
ABSTRACT
A high-performance liquid chromatography with ultraviolet detection (HPLC-UV) method was validated for the study of bioactive amines in chicken meat. A gradient elution system with an ultraviolet detector was used after extraction with trichloroacetic acid and pre-column derivatization with dansyl chloride. Putrescine, cadaverine, histamine, tyramine, spermidine, and spermine standards were used for the evaluation of the following performance parameters: selectivity, linearity, precision, recovery, limits of detection, limits of quantification and ruggedness. The results indicated excellent selectivity, separation of all amines, a coefficient of determination greater than 0.99 and recovery from 92.25 to 102.25% at the concentration of 47.2mg.kg-1, with a limit of detection at 0.3mg.kg-1 and a limit of quantification at
0.9mg.kg-1 for all amines, with the exception of histamine, which exhibited the limit of quantification, of
1mg.kg-1. In conclusion, the performance parameters demonstrated adequacy of the method for the
detection and quantification of bioactive amines in chicken meat.
Keywords: validation, chicken meat, bioactive amines, HPLC-UV
RESUMO
Um método de cromatografia líquida de alta eficiência (CLAE) para pesquisa de aminas bioativas em carne de frango foi validado. Foi utilizado um sistema de gradiente de eluição com detector ultravioleta, após extração com ácido tricloroacético e derivação pré-coluna com cloreto de dansila. Os padrões de putrescina, cadaverina, histamina, tiramina, espermidina e espermina foram utilizados para avaliação dos seguintes parâmetros de desempenho: seletividade, linearidade, precisão, recuperação, limites de detecção, limites de quantificação e robustez. Os resultados mostraram excelente seletividade e separação de todas as aminas, coeficiente de determinação superior a 0,99, recuperação entre 92,25 e 105,25% na concentração 47,2mg.kg-1, limites de detecção de 0,3mg.kg-1 e limite de quantificação de 0,9mg.kg-1 para todas as aminas, com exceção da histamina, que apresentou o limite de quantificação mais alto, de 1mg.kg-1. Foi concluído que os parâmetros de desempenho demonstraram adequação do método para detecção e quantificação de aminas bioativas em carne de frango.
Palavras-chaves: validação, carne de frango, aminas bioativas, HPLC-UV
INTRODUCTION
Chicken meat has high nutritional value and is rich in proteins, vitamins and minerals. However, this product is highly perishable and is
Recebido em 11 de agosto de 2015 Aceito em 5 de janeiro de 2016
*Autor para correspondência (corresponding author) E-mail: [email protected]
The consumption of food with high amine content can be harmful to health, potentially leading to histamine poisoning, migraine, or hypertensive crisis (Palencia et al., 2011). Approximately 30% of individuals with classical migraine may have a crisis when they consume tyramine-rich food (Glória and Vieira, 2007). At high concentrations, putrescine and cadaverine may lead to hypotension, bradycardia, exaggerated muscle contraction of the jaw, limb paralysis, and potentiation of the toxicity of other amines (Veciana-Nogués et al., 1997). Hence, the study of biogenic amines is important not only due to their toxicity but also because they can be used as food quality indicators. In this sense, the development of methodologies able to detect toxic compounds has been increasingly pursued to ensure that food products are not associated with any type of risk for the consumer.
The validation of analytical methods is required when the method to be employed is not yet recognized or approved by regulatory agencies and should always be performed when an existing method is modified to meet specific requirements, to ensure that its performance characteristics fulfill the requirements for the intended analytical operations (EURACHEM, 1998). The validation process allows demonstrating that a test method has the necessary characteristics to guarantee results with the required quality, therefore ensuring the reliability of the results under the conditions in which the method is employed (Lanças, 2004; Ribani et al., 2007).
High-performance liquid chromatography (HPLC) methods have been used by many authors for the analysis of bioactive amines in chicken meat (Baston et al., 2010; Buňkova et al., 2010). However, the used methodologies in the above mentioned articles were not validated. The lack of validated methods for the analysis of these compounds in chicken meat can generate unreliable results, which are not officially recognized by international authorities and the scientific community (Baston et al., 2008). There is an HPLC-UV validated method for the analysis of bioactive amines in chicken meat (Lázaro et al., 2013). Nevertheless, there are several differences in the described methodology, especially in the extraction procedures and derivatization process.
Thus, the purpose of this study was to validate a quantitative HPLC method with ultraviolet detection (HPLC-UV) for the study of bioactive amines in chicken breast meat.
MATERIAL AND METHODS
Samples of chicken (Gallus gallus domesticus) breast meat were directly collected from meat packing industries and transported to the laboratory in isothermal boxes with ice.
For amine extraction, the samples were ground, and a 5g aliquot was directly weighted in 50mL polypropylene centrifuge tubes before the addition of 7mL of 50g.L-1 trichloroacetic acid
(TCA 50g.L-1). The tubes were agitated for
10min in a mechanical shaker at 200RPM (Tecnal, São Paulo, Brazil) and centrifuged at 5,232x g at 4°C for 25min in a refrigerated centrifuge (Cientec, São Paulo, Brazil). After the first centrifugation step, the supernatant was filtered through a Whatman no. 1 filter paper. This procedure was repeated two more times with the addition of 7mL and 6mL of TCA 50g.L-1, for a total of 20mL of acid added in
three successive extraction steps (7mL, 7mL, and 6mL). The resulting extracts were stored in 0.5mL microtubes and frozen at -20°C for later application of the derivatization process and chromatographic analysis.
The resulting extract was dissolved in 600L of acetonitrile and filtered using a filtration unit in polytetrafluoroethylene (PTFE) membrane, 0.45 m pore size, and diameter from 13 to 15mm (Millipore Corp, Milford, MA, USA). The filtrate was reserved for injection.
The amine standards (spermine
tetrahydrochloride, spermidine trihydrochloride, putrescine dihydrochloride, cadaverine dihydrochloride, histamine dihydrochloride, and tyramine chloride) were purchased from Sigma Chemical Co. (St. Louis, MO).
Trichloroacetic acid (TCA) from Sigma-Aldrich (St Louis, MO, USA), and toluene, acetonitrile, and sodium bicarbonate from Merck (Darmstadt, Germany) were used. All of the reagents and chemicals used were of analytical purity (a.p.) grade, except for the solvents used in HPLC, which were of HPLC grade.
Stock solutions of each amine were prepared at a concentration of 1mg.mL-1 by dilution of the
standards in 0.1N hydrochloric acid (HCl) and kept at 4±1°C. After this procedure, 1mL of each stock solution was transferred to a volumetric flask, resulting in a standard solution with a final concentration of 0.1666g.mL-1 of each amine.
The derivatization solution was prepared by adding 750mg of dansyl chloride (Sigma-Aldrich®, St. Louis, MO, USA) into 100mL of acetone (LiChrosolv®, Merck, Darmstadt, Germany). The solution was kept at -20°C, while the L-proline solution (Merck, Darmstadt, Germany), which was prepared at the concentration of 100mg.mL-1 of ultrapure water
(Milli-Q Plus System), was kept under refrigeration.
The chromatographic system consisted of a ÄKTAmicro™ (GE HealthCare, Buckinghamshire, England), equipped with two pumps (model P-900), a manual injector (model INV-907) with a 100μL loop, UV visible detector (UV-900), and the Unicorn 5.11 software (GE HealthCare, Buckinghamshire,
England) for data processing. The
chromatograms were processed in the 254nm wavelength.
For the separation of amines, a Kromasil C18
chromatographic column (5-µm particle size,
100 Angstrom, 25cm x 4.6mm) (AkzoNobel, Amsterdam, The Netherlands) was used. The column temperature was 20°C. The mobile phases water (A) and acetonitrile (B) were used and the elution program consisted of a gradient system with a 1.0mL/min flow-rate. The gradient applied was as follows: 60% to 75% (v/v) B in A within 6.23min; maintained at 75% (v/v) B in A for 2.38min; from 75% to 95% (v/v) B in A within 6.27min; maintained at 95% (v/v) B in A for 7.32min. The total run time was 31.66min. An injection of 100% (v/v) A for 8.3min was used between each sample to flush the HPLC system.
To validate the method for identifying bioactive amines in chicken breast meat, the following performance parameters were evaluated: selectivity, linearity, precision, accuracy, limit of detection (LoD), limit of quantification (LoQ), and ruggedness (Thompson et al., 2002).
Selectivity was evaluated by comparing the retention times of the amine standards added to the solvent (water) and in the presence of the matrix (chicken breast).
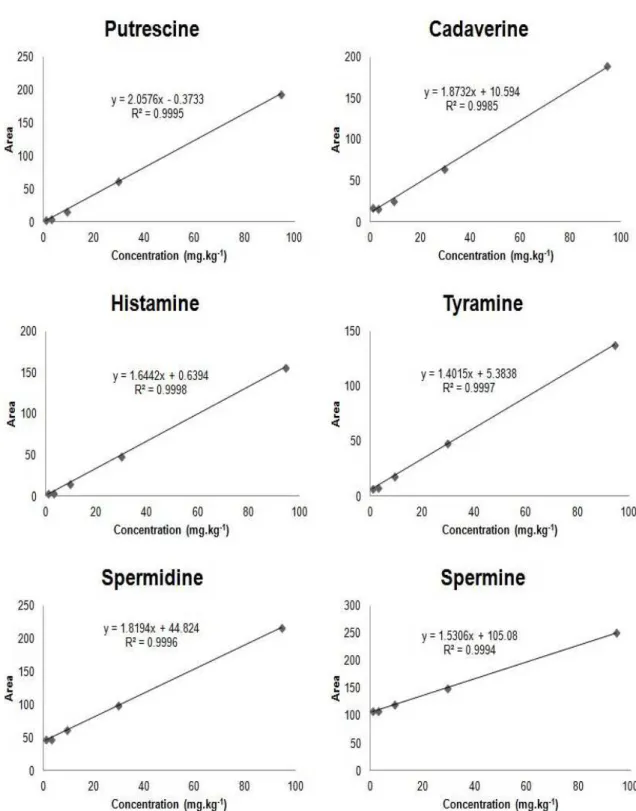
To evaluate linearity, the chicken breast matrix was fortified with the standard solution of the six amines at concentrations of 0.9, 2.9, 9.2, 29.5, and 94.4mg.kg-1, using seven replicates. After
analysis, a plot of peak area versus concentration was created, and the equations of the curves and the coefficients of determination (R2) and
correlation (r) were defined by linear regression (INMETRO, 2010).
The precision of the analyses was evaluated by determining the relative standard deviation (RSD) under repeatability conditions, using the results obtained by successive analysis of the same sample in short time intervals, and performed under the same conditions (same equipment and analyst). The chicken breast samples were supplemented by the standard solution at three concentration levels – low (2.9mg.kg-1), medium (47.2mg.kg-1), and high
(94.4mg.kg-1), considering the method’s linear
interval, with three replicates each (ICH, 2005).
Accuracy was evaluated using recovery tests. Analyses of the method’s linear interval at low (2.9mg.kg-1), medium (47.2mg.kg-1), and high
triplicate. The recovery obtained at each concentration was calculated using the equation R=[(C1-C2)/C3]x100, which considers the
analytic concentration in the fortified sample (C1), the analytic concentration in the
non-fortified sample (C2), and the analytic
concentration added to the fortified sample (C3)
(EC, 2002; Codex Alimentarius, 2009).
The LoD and LoQ were calculated from equations that consider the parameters of the analytical curve, LoD=[(3xσ)/S] and LoQ=[(10xσ)/S], using the standard deviation of the response (σ) and the slope of the analytical curve (S) (ICH, 2005).
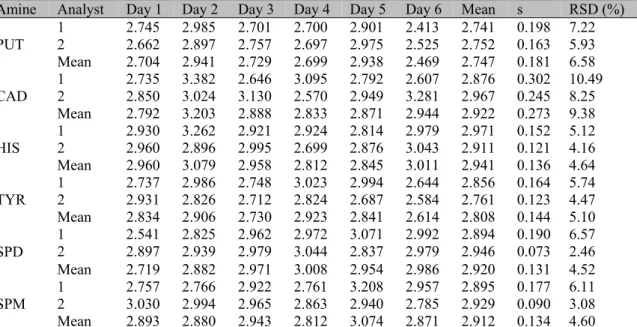
The ruggedness of the method was evaluated by modifying two factors (analyst and day of analysis) during the analysis of the chicken breast meat samples (USP, 1995).
RESULTS AND DISCUSSION
The analytical method used to study bioactive amines in chicken breast meat exhibited good performance characteristics for all parameters evaluated, with excellent selectivity and separation of all amines, coefficient of determination (R2) and correlation coefficient (r)
values greater than 0.99, recovery coefficient from 92.25 to 105.25% (at the concentration of 47.2mg.kg-1), limits of detection equal to
0.3mg.kg-1 for all the amines, and limit of
quantification from 0.9 to 1.0mg.kg-1 for the
proposed method.
The analytical curves and coefficient of determination (R2) from the analysis of amines
added to chicken meat, obtained in the evaluation of linearity in the range of 0.9 to 94.4mg.kg-1, are
represented in Figure 1.
The values obtained show that the model is adequate because the coefficient of determination is greater than 0.99, which is considered to be evidence of an excellent fit of the data to the regression line. According to the criteria of the European and Brazilian legislations, values higher than 0.99 are recommended for the linearity tests (EC, 2002; INMETRO, 2010). This parameter allows an estimation of the quality of the obtained curve because the closer to 1.0 its value is, the lower the dispersion of the set of experimental points
and the lower the uncertainty of the estimated regression coefficients (Ribani et al., 2007).
The evaluation of selectivity (Figure 2) was performed by visual assessment of chromatogram (A), which shows the analysis of the standard solution of the six amines added to water at the concentration of 11.2mg.kg-1, as well
as chromatogram (B), which represents the analysis of the chicken breast matrix with the addition of a standard solution of the six studied amines at the concentration of 94.4mg.kg-1.
The presence of a relevant peak (X) (23.19±0.05 min) that could not be identified was observed during the chromatographic run. This peak is most likely caused by the use of dansyl chloride as a derivatization agent. When evaluating different protocols for the determination of amines in fish, other authors also observed the emergence of an interfering peak and suggested that this phenomenon could be the result of reactions involving excess dansyl chloride (Malle et al., 1996). The use of different L-proline concentrations is an important procedure for the neutralization of excess dansyl chloride and to avoid the emergence of an interfering peak (Innocente et al., 2007). Hence, it is possible that the amount of L-proline added during the derivatization process was not sufficient to neutralize all of the dansyl chloride, thus allowing the emergence of this peak. Another relevant peak (Y) (28.08±0.04 min) was observed but could not be identified. However, the presence of such peaks did not interfere in the separation of amines because they do not elute at the same retention time as the peaks of interest.
Figure 2. Chromatograms with the addition of a standard solution of the six amines (11.2mg.kg-1) to water
(A) and addition of standard solution (94.4mg.kg-1) to chicken meat (B). 1 = putrescine, 2 = cadaverine, 3
= histamine, 4 = tyramine, 5 = spermidine and 6 = spermine; X = interfering peak; Y = unidentified compound.
The LoD of the method was 0.3mg.kg-1 for all
amines. The LoQ of the method was 0.9mg.kg-1
for all the amines, with the exception of histamine, with LoQ equal to 1mg.kg-1
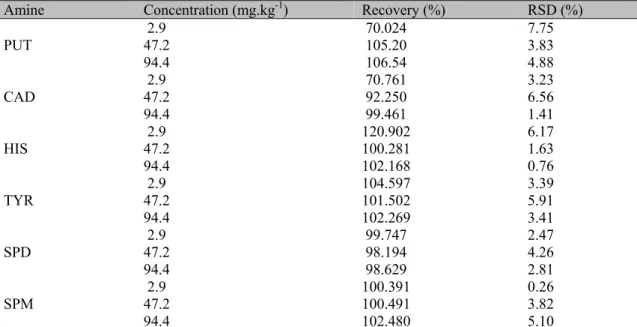
Table 1 indicates the mean recovery percentages with new techniques used to evaluate the accuracy, while the RSD was still used for the evaluation of precision. The accuracy of the validated method was within the range recommended by the EC (2002) and the Codex Alimentarius (2009) which determine a recovery percentage from 70 to 110% and from 80 to 110%, respectively, for analyte concentrations higher than 1mg.kg-1 (EC, 2002; Codex
Alimentarius, 2009). However, the recovery of histamine at a concentration of 2.9mg.kg-1 was
120.9%, which does not satisfy the specified values. Hence, the evaluated method exhibited satisfactory accuracy within the range of 2.9 to 94.4mg.kg-1 for putrescine, cadaverine, tyramine,
spermidine, and spermine.
The precision of the method exhibited satisfactory results for all six amines in the range of 2.9 to 94.4mg.kg-1. The RSD of the results
obtained in the recovery tests ranged from 0.26 to 7.75%. These values are within the range recommended by the EC (2002) and the Codex Alimentarius (2009) which predicts a maximum RSD of 10% for the concentration range evaluated in this study.
Table 1. Mean recovery percentages and relative standard deviation values of amines in the chicken breast matrix
Amine Concentration (mg.kg-1) Recovery (%) RSD (%)
PUT 2.9 47.2 70.024 105.20 7.75 3.83
94.4 106.54 4.88
CAD 2.9 47.2 70.761 92.250 3.23 6.56
94.4 99.461 1.41
HIS 2.9 47.2 120.902 100.281 6.17 1.63
94.4 102.168 0.76
TYR 2.9 47.2 104.597 101.502 3.39 5.91
94.4 102.269 3.41
SPD 2.9 47.2 99.747 98.194 2.47 4.26
94.4 98.629 2.81
SPM 2.9 47.2 100.391 100.491 0.26 3.82
94.4 102.480 5.10
RSD= relative standard deviation; PUT= putrescine; CAD= cadaverine; HIS= histamine; TYR= tyramine; SPD= spermidine; SPM= spermine.
Table 2.Results of the analysis of biogenic amines in chicken breast meat performed by different analysts during the six-day period
Amine Analyst Day 1 Day 2 Day 3 Day 4 Day 5 Day 6 Mean s RSD (%)
PUT 1 2 2.745 2.985 2.701 2.700 2.901 2.413 2.741 0.198 7.22 2.662 2.897 2.757 2.697 2.975 2.525 2.752 0.163 5.93
Mean 2.704 2.941 2.729 2.699 2.938 2.469 2.747 0.181 6.58
CAD 1 2 2.735 3.382 2.646 3.095 2.792 2.607 2.876 0.302 10.49 2.850 3.024 3.130 2.570 2.949 3.281 2.967 0.245 8.25
Mean 2.792 3.203 2.888 2.833 2.871 2.944 2.922 0.273 9.38
HIS 1 2 2.930 3.262 2.921 2.924 2.814 2.979 2.971 0.152 5.12 2.960 2.896 2.995 2.699 2.876 3.043 2.911 0.121 4.16
Mean 2.960 3.079 2.958 2.812 2.845 3.011 2.941 0.136 4.64
TYR 1 2 2.737 2.986 2.748 3.023 2.994 2.644 2.856 0.164 5.74 2.931 2.826 2.712 2.824 2.687 2.584 2.761 0.123 4.47
Mean 2.834 2.906 2.730 2.923 2.841 2.614 2.808 0.144 5.10
SPD 1 2 2.541 2.825 2.962 2.972 3.071 2.992 2.894 0.190 6.57 2.897 2.939 2.979 3.044 2.837 2.979 2.946 0.073 2.46
Mean 2.719 2.882 2.971 3.008 2.954 2.986 2.920 0.131 4.52
SPM 1 2 2.757 2.766 2.922 2.761 3.208 2.957 2.895 0.177 6.11 3.030 2.994 2.965 2.863 2.940 2.785 2.929 0.090 3.08
Mean 2.893 2.880 2.943 2.812 3.074 2.871 2.912 0.134 4.60
RSD= relative standard deviation; s= standard deviations PUT= putrescine; CAD= cadaverine; HIS= histamine; TYR= tyramine; SPD= spermidine; SPM= spermine.
CONCLUSION
The ion-pair reversed-phase high-performance liquid chromatography (HPLC) method with ultraviolet detection (UV) after pre-column derivatization with dansyl chloride was validated in this study, and its use is thus adequate for the determination of bioactive amines in chicken meat.
ACKNOWLEDGMENTS
The authors acknowledge the assistance of the College of Postgraduate Studies on Animal Science at the Escola de Veterinária at the Universidade Federal de Minas Gerais (UFMG) and Pró-Reitoria de Pesquisa at the UFMG for providing funds for publication, the Conselho Nacional de Desenvolvimento Científico e Tecnológico (CNPq) for providing scholarship and funds forresearching. The authors also thank the Instituto Mineiro de Agropecuária (IMA) and the Fundação Ezequiel Dias (FUNED) for assisting with the analyses.
REFERENCES
BASTON, O.; BARNA, O.; VASILE, A. Microbiota and biogenic amines variation of chiken meat; comparison between white and red meat. Ann. Food Sci. Tecnol., v.11, p.69-73, 2010.
BASTON, O.; STROIA, A.L.; MOISE, D.; BARNA, O. Validation study of a HPLC method able to measure biogenic amines in chicken meat. Food Technol., v.31, p.44-50, 2008. BRINK, B.T.; DAMINK, C.; JOOSTEN, H.M.L.J.; VELD, J.H.J.H. Occurrence and formation of biologically active amines in foods. Int. J. Food Microbiol., v.11, p.73-84, 1990. BUŇKOVA, L.; BUŇKA, F.; KLČOVSKA, P. et al. Formation of biogenic amines by Gram-negative bacteria isolated from poultry skin. Food Chem., v.121, p.203-206, 2010.
COMMISSION Decision 2002/657/EC
FITNESS for purpose of analytical methods. A laboratory guide to method validation. Teddington: LGC, 1998, 62p.
GLÓRIA, M.B.A.; VIEIRA, S.M. Technological and toxicological significance of bioactive amines in grapes and wines. In: benkeblia, N. (Ed.). Food. United Kingdon: Global Science Books. 2007. p.258-270.
GUIDELINES for the design and
implementation of national regulatory food safety assurance programme associated with the use of veterinary drugs in food producing animals. Viena: Fao, 2009 CAC/GL 71-2009, p.38.
INNOCENTE, N.; BIASUTTI, M.; PADOVESE, M.; MORET, S. Determination of biogenic amines in cheese using HPLC technique and direct derivatization of acid extract. Food Chem., v.101, p.1285-1289, 2007.
LANÇAS, F.M. Validação de métodos
cromatográficos de análise. São Carlos, SP: RiMa, 2004. 62p.
LÁZARO, C.A.; CONTE-JÚNIOR, C.A.; CUNHA, F.L. et al. Validation of an HPLC Methodology for the Identification and Quantification of Biogenic Amines in Chicken Meat. Food Anal. Meths., v.6, p.1024-1032, 2013.
MALLE, P.; VALLE, M.; BOUQUELET, S. Assay of biogenic amines involved in fish decomposition. J. AOAC Int., v.79, p.43-49, 1996.
ORIENTAÇÕES sobre validação de
métodosanalíticos/[Guidelines for the validation of analytical methods]. DOQ-CGCRE-008. INMETRO, 2010. Revisão: 03, fevereiro/2010, p.20.
PALENCIA, P.F.; FERNÁNDEZ, M.;
MOHEDANO, M.L. et al. Role of tyramine synthesis by food-borne Enterococcus durans in adaptation to the gastrointestinal tract environment. Appl. Environ. Microbiol., v.77, p.699-702, 2011.
RIBANI, M.; COLLINS, C.H.; BOTTOLI, C.B.G. Validation of chromatographic methods: Evaluation of detection and quantification limits in the determination of impurities in omeprazole. J. Chromatogr. A, v.1156, p.201-205, 2007.
TEXT and methodology Q2 (R1).
In: INTERNATIONAL CONFERENCE ON
HARMONIZATION. VALIDATION OF
ANALYTICAL PROCEDURES. ICH, 2005. Available in: <http://www.ich.org>. Accessed in: 05 dez. 2011.
THOMPSON, M.; ELLISON, S.L.; WOOD, R. Harmonized guidelines for single-laboratory validation of methods of analisys. J. Pure Appl. Chem., v.74, p.835- 855, 2002.
UNITED STATES PHARMACOPEIA
CONVENTION, 23.ed. National Formulary 18. USA: United States Pharmacopeial Convention, Inc., 1995.